Performance Improvement of Proton Exchange Membrane Fuel Cell
Received: 05-May-2018 / Accepted Date: 15-May-2018 / Published Date: 21-May-2018 DOI: 10.4172/2576-1463.1000203
Abstract
Fuel cell is a device which is used to produce chemical energy into electrical energy. Proton Electrolyte Membrane fuel cell (PEMFC) was not polluting the environment and it has high efficiency. PEM fuel cell, in addition to electricity, water and small amount of heat are generated as by-products. This generated water on cathode side blocks the flow paths and reducing electrochemical reactions. So the low electrochemical reactions will affect the performance of fuel cell. To increase the performance of fuel cell, we can change the flow parameters and flow field design. A 3D model of new flow field channel has been designed with 25 cm2 active area with SOLID WORKS 2008. The solid model has been analyzed with ANSYS 14.5 software. Numerical values of PEMFC were obtained with ANSYS FLUENT 14.5. Comparison has been made for power density of new flow field design with power density of serpentine flow field design.
Keywords: PEMFC; Fuel cell; Flow field design; Water management; Power density
Introduction
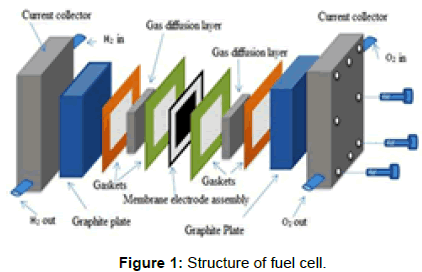
Fuel cell is an electrochemical cell that converts the chemical energy from a fuel into electrical energy by electro chemical reaction of hydrogen fuel with oxygen or other oxidizing agent. Fuel cells consist of Anode, Cathode and Electrolyte. At anode the catalyst causes the fuel to oxidation reaction it generates protons and electrons. The protons flow from anode to cathode through the electrolyte after the oxidation. But the electrons resist by electrolyte and its flow through external circuit. It produces the electricity. Fuel cells produce small amount of potentials about 0.7 Volts. So fuel cells are stacked or connected in series. Energy efficiency of fuel cell is normally obtained at 40%-60% (Figure 1) [1,2].
Proton exchange membrane fuel cell
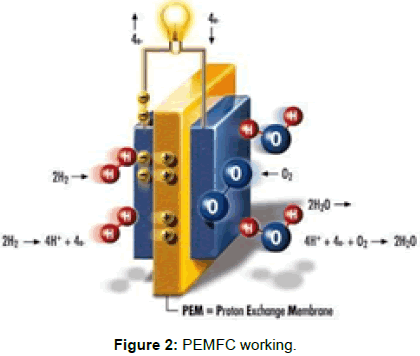
The proton exchange membrane fuel cell is working with hydrogen passes through the anode its split into protons and electrons by platinum based catalyst. The protons pass through the polymer acidic membrane (electrolyte) to the cathode side of the cell. Same time the electrons pass through by external circuit and it generates electricity. After reaction the electrons comes to the cathode side (Figure 2).
At the Anode,  (1.1)
(1.1)
At the Cathode,  (1.2)
(1.2)
Overall reaction,  (1.3)
(1.3)
Literature Review
Muthukumar et al. investigated PEMFC model with 9 pass, 6 pass and 3 pass multi serpentine flow field at COMSOL Multi physics software. 6 pass multi serpentine flow field produce maximum current density is 1.1902 A/cm2 and power density is 0.4761 W/cm2 at 1.5 bar pressure and 0.4 V at 323 K. Because more electrochemical reaction with good water management [3].
Lakshminarayanan et al. investigated the interdigited model in ANSYS 14.5 software packages with different landing to channel width. At L*C – 2:2, the optimum power density is 0.4086 W/cm2 obtained with the temperature of 323 K, voltage is 0.55 and the pressure is 2 bar. Because same L*C width size [4].
Karthikeyan et al. reported about the water management with experimental studies of 25 cm2 and 70 cm2 flow field. Flow plate names serpentine, uniform and zigzag pin type and flow channel with 2 mm cubical carbon porous inserted. While adopting the porous carbon inserts with the porosity level of 80%-90% on the uniform and zigzag pin type flow field designs, it showed a better performance with 9.5% and 11.6% increase in power densities respectively in 25 cm2 PEM Fuel cell and 12.1% and 20.6% increase in power densities respectively in 70 cm2 PEM Fuel cell, when compared to conventional serpentine flow field design [2].
Afshari et al. investigated a new flow field zigzag flow channel with a cooling plate. The cooling plates are 150 mm × 150 mm square area with machined zigzag flow channels with 37 coolant inlet (model b). The cooling plate thickness, channel width, rib width, channel depth and the channels diameter are 2 mm, 2 mm, 2 mm, 1 mm and 1.33 mm, respectively. A similar model consists of straight channels with 37 parallel paths is also considered for comparison (model a). The thermal performance of zigzag channels model was 5%, 23% and 8% increased [5].
Muthukumar et al. analyzed serpentine flow field plate with 80 mm × 80 mm, 2 mm rib width and 25 cm2 active area shown. Model analyzed by ANSYS 14.5 software. For 2 bar with 0.55 V, the optimum current density is 1.207008 A/cm2 and the power density is 0.6638544 W/cm2 obtained. The operating temperature was 323 K has identified [6].
Summary
From the literature survey, the proper flow field design will increase the efficiency of PEMFC and it provides a water management at cathode side.
Methodology
Modeling
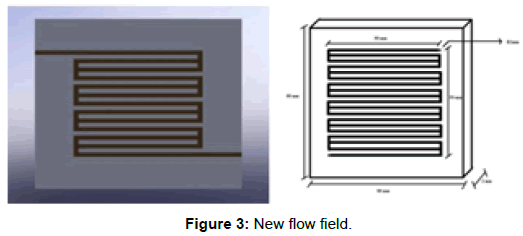
Flow field: A new 3D model of flow field has designed by SOLID WORKS 2008 by using drawing commands and tools. Figure 3 shows the new flow field model.
Catalyst layer: Catalyst layer works as a seal between the graphite plate and GDL. It must be placed in both side such as anode and cathode. Figure 4 shows the Pro-E model of catalyst layer. Two catalyst layers were modelled and assembled in between graphite plate and GDL.
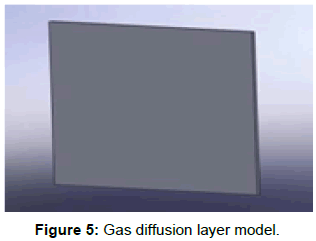
Gas diffusion layer: GDL is placed in between the graphite plate and membrane. Figure 5 shows the model of gas diffusion layer. Carbon sprayed paper as material. GDL model is resembled as catalyst layer and consist of same thickness. 1 mm plates were modelled. Membrane, catalyst layer and GDL have same dimension and procedure for modelling.
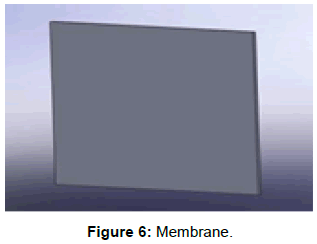
Membrane: Membrane works as electrolysis for PEMFC. It must be placed in centre between anode and cathode. Material of membrane was platinum with carbon particles. A membrane was modelled and assembled in between catalyst layers (A and C). Figure 6 shows the membrane model view.
Dimensions and materials: The Table 1 shows the dimensions and materials of PEMFC.
| Part name | Width (mm) | Length (mm) | Thickness (mm) | Material |
|---|---|---|---|---|
| Anode and the cathode flow plate | 80 | 80 | 10 | Bipolar graphite |
| Anode and the cathode catalyst | 80 | 80 | 0.08 | Carbon with 0.5 mg/cm2 platinum |
| Membrane | 80 | 80 | 0.127 | Copolymer-nafion |
| GDL anode and cathode | 80 | 80 | 0.3 | Tetra fluoro poly ethylene |
| Anode and cathode flow channel (Rib) | 50 | 50 | 2 | Fluid |
Table 1: Dimensions and zone type of the fuel cell parts.
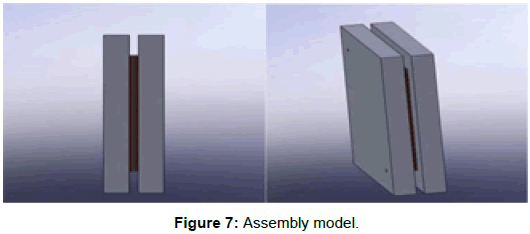
Assembly: At last all components are assembled and mate with the help of assembly in the comment of pro-E software. Figure 7 shows the assembled model of fuel cell setup.
Meshing and analysis of new flow field
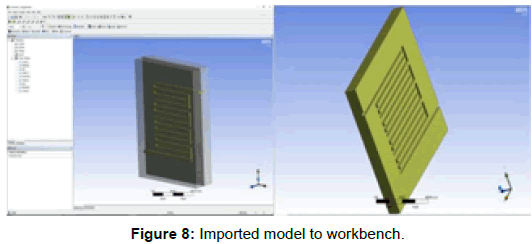
Working on ANSYS 14.5: The assembled PEMFC model was converted into IGES.prt format and it was imported to the ANSYS 14.5 module ANSYS WORKBENCH 14.5.

The design modeller show an import under the tree outline with a lightning bolt next to it. Press the generate button and the geometry show up in the graphics window. Figure 8 shows the importing model of ANSYA 14.5.
Computational fluid dynamics: The assembled PEMFC model was converted into GEOM x b format and it was imported to the ANSYS 14.5 module ANSYS CFD 14.5.

The design modeller show an import under the tree outline with a lightning bolt next to it. Press the generate button and the geometry show up in the graphics window. Figure 9 shows the importing of model to ansys.
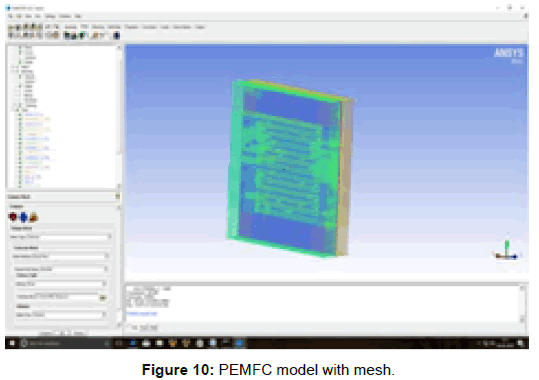
Meshing: After completing CFD volume separating and blocking, the model has pre-mesh with Cartesian type mesh. The meshing PEMFC model has shown on Figure 10.
Exporting to ANSYS FLUENT 14.5
Input boundary conditions to the PEMFC model as per the below given values. The project file saved as a MESH. File for fluent software. The mesh file was imported to the ANSYS FLUENT 14.5 software. PEMFC was uploaded by using the commend DEFINE/MODEL/ ADDON/3.
Setting up the boundary conditions: After importing the PEMFC model the following boundary condition has to be set,
1. Mass flow rate for inlet _ a=4.33 E-07 kg/s
2. Mass flow rate for inlet _c=3.33 E-06 kg/s
3. Pressure =2 bar
4. Vopen =0.95 V
Results and Discussion
The operating parameters for PEMFC at 323 K from the literature survey [7] optimum current density and power density were obtained from the temperature of 323 K and 2 bar shows on Table 2.
| S.NO. | Parameters | Values | |
|---|---|---|---|
| 1 | Temperature | 323 K | |
| 2 | Pressure | 2 bar | |
| 3 | Mass flow rate | Anode | Cathode |
| 4.33 × 10⁻⁷ kg/s | 3.33 × 10⁻⁶ kg/s | ||
Table 2: Parameters involved for analyzing at 323 K.
Power density and current density values were obtained for the input values of temperature 323 K and pressure 2 bar. The anode and cathode of mass flow rates are 4.33 × 10⁻⁷ kg/s and 3.33 × 10⁻⁶ kg/s respectively. Mass flow rate is constant for all temperature, voltage and pressure.
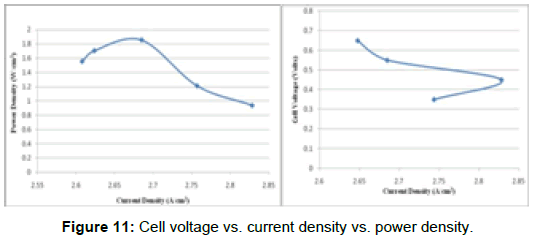
From the Figure 11 maximum power density is 1.55560 W/cm2 and maximum current density is 2.82837 A/cm2 at voltage is 0.55 V. Optimum power density is 1.55560 W/cm2 and optimum current density is 2.82837 A/cm2. So the optimum voltage is 0.55 V selected for further iterations.
Power density and current density values were obtained for the input values of temperature 313 K, 323 K, 333 K, 343 K, 353 K and pressure 2 bar. The anode and cathode of mass flow rates are of 4.33 × 10⁻⁷ kg/s and 3.33 × 10⁻⁶ kg/s respectively. Mass flow rate is constant for all temperature, voltage and pressures. Table 3 shows the current density and power density values obtained numerically from ANSYS for the different temperatures. Table 3 shows the power density obtained at different temperature at 0.55 V.
| Temperature (K) | Current density (A/cm2) | Power density (W/cm2) |
|---|---|---|
| 313 | 2.731172 | 1.5021446 |
| 323 | 2.828366 | 1.5546013 |
| 333 | 2.812321 | 1.5467766 |
| 343 | 2.756281 | 1.5159546 |
| 353 | 2.726692 | 1.4996806 |
Table 3: Current and power density at different temperature.
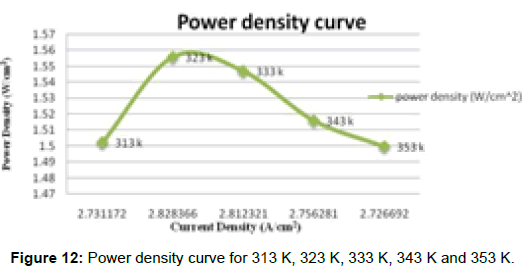
The Figure 12 shows power density’s at different temperatures. The maximum power density is 1.5546013 W/cm2 obtained at 323 K; also the power density is 1.5467766 W/cm2 was obtained at 333 K. So these two temperatures are giving equal and maximum power density. Between the temperatures of 323 K to 333 K the PEMFC produce maximum power density for this design.
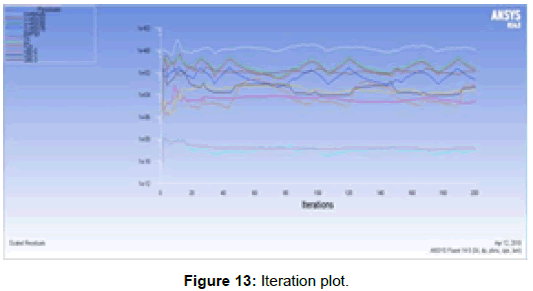
The Figure 13 shows the all residuals played in PEMFC working in ANSYS FLUENT 14.5. Working conditions are 333 K at 2 bar with same inlet conditions shows from the Table 2.
Conclusion
Fuel cell performance depends on the several parameters like design parameter, material properties, operating parameters and water management. By changing the flow channel design can change the efficiency of PEMFC. Following results shows the optimum power density at different temperature and voltage at 2 bar pressure for new flow field [8-15].
• At the temperature of 323 K and 0.55 V, the maximum power density is 1.5556 W/cm2 and current density is 2.82837 A/cm2. So the optimum voltage is 0.55 Volts.
• By changing the temperatures at 313 K, 323 K, 333 K, 343 K and 353 K, the maximum power density is 1.5556013 W/cm2 at 323 K and another power density is 1.5467766 W/cm2 at 333 K were obtained.
• From the Figure 12 temperatures of 323 K and 333 K are giving nearly same and maximum power density. Between temperatures of 323 K-333 K the PEMFC produce maximum power density for new flow field.
Future Work
The new flow field will be design and experimental result will take in future.
References
- Jaruwasupanta N, Khunatorn Y (2011) Effects of difference flow channel designs on proton exchange membrane fuel cell using 3-D model. J Energ Mat Sci 6: 326-337.
- Karthikeyan P, Muthukumar M, Vignesh S, Pravinkumar P, Suryanarayanan M, et al. (2013) Optimization of operating and design parameters on proton exchange membrane fuel cell by using Taguchi method. International Conference on Design and Manufacturing 64: 409-418.
- Muthukumar M, Karthikeyan P, Vairavel M, Loganathan C, Praveen kumar S, et al. (2014) Numerical studies on PEM fuel cell with different landing to channel width of flow channel. 12th Global Congress on Manufacturing and Management 96: 1534-1542.
- Lakshminarayanan A, Karthikeyan P, Aswin C, Charandeep Singh C (2015) Parametric analysis of proton exchange membrane fuel cell (PEMFC) performed by Taguchi method. Int J Hydrogen Energy 309: 79-88.
- Afshari E, Dehkoridi M (2016) Investigation of PEM fuel cell performance with partially restricted cathode flow channels and metal foam as a flow distributor. Int J Hydrogen Energy 118: 705-715.
- Muthukumar M, Saravanaperumal S, Lakshminarayanan V, Senthil Kumar AP (2015) Effect of multi-pass serpentine flow field designs on the performance of proton exchange membrane fuel cell. Int J Appl Eng Res 10: 22429-22435.
- Muthukumar M, Karthikeyan P, Lakshminarayanan V, Senthil Kumar AP, Vairavel M, et al. (2014) Performance studies on PEM fuel cell with 2, 3 and 4 pass serpentine flow field designs. J Appl Mech Mat 592: 1728-1732.
- Praveenkumar S, Muruganantham S, Premkumar, Muthukumar M, Vetrivel A (2015) Influence of pressure and temperature on the performance of PEM Fuel cell with taper flow channel design. Int J Appl Chem 11: 505-513.
- Karthikeyan P, Vasanth RJ, Muthukumar M (2015) Experimental investigation on uniform and zigzag positioned porous inserts on the rib surface of cathode flow channel for performance enhancement in PEM Fuel Cell. Int J Hydrogen Energy 40: 4642-4648.
- Karthikeyan P, Muthukumar M, Rajendran V (2016) Influence of porous carbon inserts on scaling up studies for performance enhancement on PEM fuel cell. Int J Hydrogen Energy 41: 2867-2874.
- Muthukumar M, Karthikeyan P, Eldho M, Nagarathinam P, Panneer Selvam EP, et al. (2017) Impact of pressure on the performance of proton exchange membrane fuel cell. J Advanced Chemistry 13: 6462-6468.
- Chen T, Xiao Y, Chen T (2012) The impact on PEM fuel cell of bionic flow field with a different branch. Fuel Cells 2012 Science and Technology 28: 134-139.
- Kiattamrong S, Sripakagorn A (2015) Effects of the geometry of the air flow field on the performance of an open cathode PEM fuel cell transient load operation. International Conference on Alternative Energy in Developing Countries and Emerging Economies 79: 612-619.
- Owejana JP, Trabolda TA, Jacobsonb DL, Arifb M, Kandlikar SG (2017) Effects of flow field and diffusion layer properties on water accumulation in a PEM fuel cell. Int J Hydrogen Energy 32: 4489-4502.
- Shrafi M, Shams M (2017) The effects of flow-field orientation on water management with serpentine channels. Appl Hydrogen Energy 208: 1083-1096.
Citation: Vivek R, Muthukumar M (2018) Performance Improvement of Proton Exchange Membrane Fuel Cell. Innov Ener Res 7: 203. DOI: 10.4172/2576-1463.1000203
Copyright: © 2018 Vivek R, et al. This is an open-access article distributed under the terms of the Creative Commons Attribution License, which permits unrestricted use, distribution, and reproduction in any medium, provided the original author and source are credited.
Share This Article
Recommended Journals
Open Access Journals
Article Tools
Article Usage
- Total views: 6945
- [From(publication date): 0-2018 - Apr 04, 2025]
- Breakdown by view type
- HTML page views: 5962
- PDF downloads: 983

