Performance Evaluation and Analysis of Omotoso Power Plant 2016 in Nigeria
Received: 15-Mar-2016 / Accepted Date: 21-Apr-2016 / Published Date: 25-Apr-2016
Abstract
The components of power system are generation, transmission, distribution and utilization of electrical energy. The importance of the generating aspect cannot be over emphasized because the inevitable being played by this component of power system. This paper evaluates and analyses the performance of Omotoso Power Plant from year 2008 to year 2012 based on performance indices such as thermal and overall efficiencies. The period of outages of the Plant was evaluated based on the data that were obtained from the outage log books. The evaluation was performed with the aid of simple mathematical equations and data collection. This showed that the average values for thermal efficiency and overall efficiency of the generating plant was calculated to be 28.39% and 29.12% respectively due to different factors such as: break down or failures, obsolete technology, instability of the national grid system, ageing of plant components and disruption of gas supply.
Keywords: Analysis; Efficiency; Generation; Performance power
18626Introduction
The components of power system are the generation, transmission, distribution and utilization of electrical energy [1]. Power plants can be broadly classified into two types: conventional and non-conventional power generation [2]. The conventional methods of power generation makes use of prime movers such as petrol engines, diesel engines, steam engines, gas turbines or hydraulic turbines for driving electrical machines (generator or alternators) which converts mechanical energy into electrical energy. The electrical machines employed for generating direct current is called ‘generators’ while those employed for generating alternating current is known as the ‘alternators’ [3] The non-conventional power generation is the alternate method of generating electrical energy without the use of prime movers such as magneto-hydro-dynamic, solar cells, fuel cells, thermo electric generation, thermionic converters, solar power generation, wind power generation, geo thermal energy generation, and tidal power generation [3]. The gas turbine power plant is a generating station which employs gas turbine as a prime mover for the generation of electrical energy. It is made up of the following main components: compressor, regenerator, combustion chamber, gas turbine, alternator and starting motor. In a gas turbine power plant air is used as a working fluid. The air is compressed by the compressor and is led to the combustion chamber where heat is added to air, thus, raising its temperature. Heat is added to the compressed air either by burning fuel in the chamber or by the use of air heaters. The hot and high pressure air from the combustion chamber is the passed to the gas turbine where it expands and does the mechanical work. The gas turbine drives the alternator which converts mechanical energy into electrical energy. Compressor, gas turbine, and alternator are mounted on the same shaft so that a part of mechanical power of the turbine can be utilized for the operation of the compressor. Gas turbine power plants are being used as standby plants for hydroelectric stations and as a starting plant for driving auxiliaries in power plants [4]. Approximately 21% of the world’s electricity production is based on natural gas [5] Gas power plant has outstanding prospects in Nigeria with a maximum crude oil production capacity of 2.5 million barrels per day. Nigeria ranks as Africa’s largest producer of oil and the sixth largest oil producing country in the world [6]. The maximum installed capacity of this type of power plant in Nigeria is Delta Power Station with 900 MW and the minimum capacity is Ibom Power Station with 60 MW as shown in Table 1. The need to evaluate the performance of Omotoso Power Plant is crucial sequel to the fact that the power supply in the Country is epileptic, and grossly inadequate to meet the demand of over 160 Million Nigerians. The optimistic and pessimistic power demand in the Country was estimated as 13,160.33 MW and 9100.23 MW respectively.
| S. No. | Power Station | Type | Capacity |
|---|---|---|---|
| 1 | Kainji | Hydro | 800 |
| 2 | Jebba | Hydro | 540 |
| 3 | Shiroro | Hydro | 600 |
| 4 | Egbin | Steam | 1320 |
| 5 | Sapele I | Steam | 1020 |
| 6 | Sapele II | Gas | 450 |
| 7 | Afam ( IV – V) | Gas | 726 |
| 8 | Afam ( VI) (IPP) | Gas | 624 |
| 9 | Delta | Gas | 900 |
| 10 | AES ( IPP) | Gas | 270 |
| 11 | Okpai (IPP) | Gas | 480 |
| 12 | Omoku (IPP) | Gas | 150 |
| 13 | Ajaokuta (IPP) | Gas | 110 |
| 14 | Ibom (IPP) | Gas | 60 |
| 15 | Geregu I | Gas | 414 |
| 16 | Geregu II | Gas | 434 |
| 17 | Omotoso I | Gas | 336 |
| 18 | Omotoso II | Gas | 375 |
| 19 | Olorunsogo I | Gas | 336 |
| 20 | Olorunsogo II | Gas/Steam | 675 |
| 21 | Alaoji | Gas/Steam | 277 |
Table 1: Installed capacity of electricity power stations in Nigeria.
The estimate was made at the time that the power generation was put at 4,000 MW [7]. It has been established that due to inadequate power generation in Nigeria, 60%-70% of the citizens do not have electricity access. Apart from countries like Libya, South Africa and Egypt, most African countries could only provide 20% direct electricity access to their people. Some cannot even provide more than 5% for their people [8].
Omotoso Power Plant (6°44’ 0” North, 4°39’ 0” East) is a gas turbine station, owned by the Federal Government of Nigeria. The station is located in Omotoso, Okikipupa Local Government Area of Ondo State. Its construction process is in two phases. Phase I has eight GE Frame 6 machines manufactured by Nanjing Turbine and Electric Machinery Group Company Limited of Nanjing, China and was installed in 2007 by China National Machinery and Equipment Import and Export Corporation CEMEC [9]. The installed capacity of each machine is 41.875 MW bringing its total installed capacity to 335 MW. However the machine capability at Nigerian atmospheric conditions is 38 MW each for a total of 304 MW.
Phase one of the station was officially commissioned on the 17th of April, 2007 [10]. Phase II has four GE Frame 8 machine with the installed capacity of 125 MW for each machine bringing its total installed capacity to 500 MW. The capability of the phase II machines at Nigerian atmospheric condition is 120 MW each, totaling 480 MW [11]. This phase one is the area of interest in this paper. The turbine and generator are the most crucial equipment required for the generation of electricity in Gas power plants. All other equipment in the station is termed auxiliaries and is needed for the smooth running of the turbine and generator of the units in the station and operating conditions of these plant components are x-rayed as follow: The Turbine is a type of internal combustion engine. It has an upstream rotating compressor coupled to a downstream turbine, and a combustion chamber inbetween, with maximum continuous rating of 42 MW, speed 3000 rpm, with 18 stages ring exhaust thermocouples [12]. The Generator is the radiant type, 3-phase,hydrogen-cooled and Air cooled with output voltage of 10.5 kV, power of 52.58 MVA (41.8 MW), speed 3000 rpm, 0.8 power factor, exciting current 6.1 A, exciting voltage 48.1 V, 50 Hz frequency, and field current of 2781 A, ambient temperature of 45°C [13]. This paper is arranged as follows: Section 4 describes the system overview, section 5 shows the evaluation, while the performance analysis and conclusion drawn are presented in sections 6 and 7 respectively.
System Overview
The study is to evaluate the performance of Omotoso Power Plant, with the intent of ascertaining those factors or conditions for good performance as might be common to all gas plants of its kind, as well as those that might be unique to Omotoso Power Plant, so as to suggest possible means of ensuring improvements. The scope of this study is to determine the following parameters and factors for a period of five (5) years (2008-2012), as key performance indices of the plant: overall Efficiency and thermal Efficiency. The performance of the plant was evaluated using the following equations 1, 2, 3, 4, 5 and 6. The numbers of failures that happened during the period under study was obtained from the Station’s faults log book. This was translated into percentages in order to ascertain the actual running periods between 2008 and 2012.
 (1)
(1)
 (2)
(2)
 (3)
(3)
SCF is standard cubic feet, net CV is net calorific value of the gas (usually between 34,000 and 36,000 KJ/m3 as supplied by NGC).
 (4)
(4)
 (5)
(5)
 (6)
(6)
Where electrical /generator efficiency is constant at 98%.
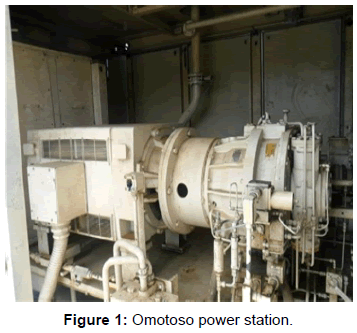
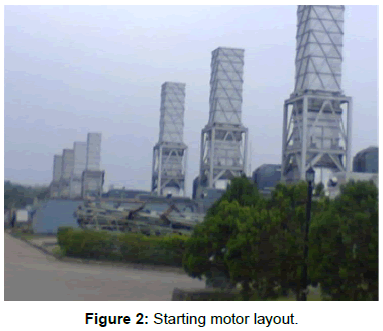
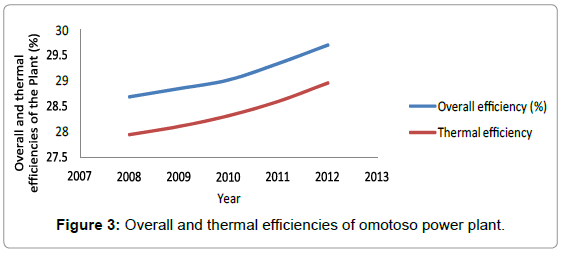
The efficiencies (thermal and overall) of Omotoso Power Plant, evaluated from plant data with equations (2) and (6), are presented in tables and figures. From these, it is obvious that, for the years under review, the overall efficiency of the plant varies between 28.69%-29.70% (with minimum in 2008 and maximum in 2012) with an average of 29.12% while the thermal efficiency ranges between 27.95%-28.96% (with minimum in 2008 and maximum in 2012) with an average of 28.36%. The layouts in Figures 1 and 2 show the overview of the Turbine and the Generator (the major components of a Gas power plant) as well as the auxiliary components making up the electricity generation process.
Evaluation
For the period ranging from 2008 to 2012 as represented in Figure 2 and Table 2, the efficiency was 29% except in 2008 when it was 27.95%. This was characterized by forced outages sequel to the fact that efficiency depends on the total output. In 2008, unit 3, 4, 5, 6, 7 and 8 were out of service due to shortage of gas from NGC. In 2009, shortage of gas was obvious, in 2010, unit 2 and 4 were on forced outage due to generator rotor of the turbine that was faulty. In 2010, only four units made of 1, 3, 7 and 8 were available for maximum load of 25 MW due to vibration problem. This led to the drastic fall in efficiency between 2008 and 2010. The efficiency of supercritical gas plant is between 35% and 40%. The shortfall from this efficiency level was due to lack of gas supply, aged equipment, lack of maintenance and inadequate skilled manpower. These are some of the problems hindering the desired output (efficiency) of the plant. The installed capacity of Electricity Power Station in Nigeria is shown in Table 1. Table 2 represents the energy and efficiency profile of the power plant from 2008 to 2012. Table 3 is the representation of the number and percentage failure that occurred within the period under study. It is important to state that the pictures in Figures 1 and 2 represent Omotoso Power Plant and starting motor layout respectively. Figure 3 represents the overall and thermal efficiencies of Omotoso Power Plant.
| Year | Energy generated (MWH) | Fuel gas consumed (MMSCF) | Net calorific value (Kj/M3) | Overall efficiency (%) | Thermal efficiency (%) |
|---|---|---|---|---|---|
| 2008 | 495,303 | 5,505,929445 | 34,508.07 | 28.69 | 27.95 |
| 2009 | 329,013 | 4,412,945360 | 34,795.54 | 28.85 | 28.11 |
| 2010 | 388,272 | 5,190,460760 | 35,827.35 | 29.02 | 28.32 |
| 2011 | 372,039 | 4,396,222309 | 34,871.21 | 29.34 | 28.60 |
| 2012 | 584,104 | 7,492,574205 | 34,748.39 | 29.70 | 28.96 |
| Average | 29.12 | 28.39 | |||
Table 2: Energy and efficiency profile of omotoso power plant.
| Year | System Fault | Plant Fault | Gas Fault | Operation Fault | Total Fault | System Fault (%) | Plant Fault (%) | Gas Fault (%) | Operation Fault (%) |
|---|---|---|---|---|---|---|---|---|---|
| 2008 | 52 | 32 | 10 | 5 | 99 | 53.53 | 32.32 | 10.10 | 5.05 |
| 2009 | 45 | 30 | 8 | 10 | 93 | 48.39 | 36.26 | 8.60 | 10.75 |
| 2010 | 78 | 33 | 15 | 4 | 130 | 60.00 | 28.38 | 11.54 | 3.08 |
| 2011 | 125 | 77 | 11 | 6 | 219 | 57.08 | 35.16 | 5.02 | 2.74 |
| 2012 | 88 | 62 | 16 | 5 | 171 | 51.46 | 32.26 | 3.36 | 2.92 |
Table 3: Number and percentage failure occurrence in the power plant.
Performance Analysis
Performance analysis of Omotoso Power Plant has been carried out with specific emphasis on the two (2) key performance indices: overall Efficiency and thermal Efficiency. For the five (5) Years under review (2008-2012), the study revealed that the average overall efficiency was 29.12% (28.69% minimum {2008}; 29.70% maximum {2012}) as against expected values of 30% - 35% while the thermal efficiency had the average of 28.39% (27.95% minimum {2008}; 28.96% maximum {2012}). The international best practice standards are 60% and above for overall efficiency and 75% and above for thermal efficiency respectively. In each of the evaluated parameters, the plant had lower performance indices than set standards (some considerably low and some others acceptable). A number of reasons were adduced to be responsible for this shortfall in performance. These include: low plant availability due to breakdowns/failures, obsolete technology relative to advancement in the field, instability of the national grid system, ageing of plant components, disruption in gas supply, among others.
Conclusion
The performance of a power plant is majorly hinged on the plant’s generated energy which is a function of the available power output and the running hours. Higher energy generation, however, demands that the units generate to maximum possible capacity and operate for higher running time and invariably break down/fail less frequently. More so, this power station’s units are long overdue for replacements, hence, to increase their capability of responding to changing circumstances, it is necessary to prolong the life of the plants by stepping up the level of regular maintenance. The following measures are therefore suggested to raise the energy output from the plant and hence improve the performance:
i. Plant equipment should be overhauled as at when due.
ii. Security of gas supply should be ensured.
iii. Failed plant equipment should be rehabilitated and restored to operation as timely as possible.
iv. Obsolete technology should be upgraded.
v. Operation and Maintenance (O&M) personnel should be periodically trained and re-trained.
vi. Failed automated systems (currently operated manually) should be restored to automation.
vii. Adequate routine maintenance should be enhanced and largescale program of repair and replacement upheld.
viii. Periodic evaluation of plant performance should be carried out and findings critically analyzed and applied.
ix. Record and data management should be keenly upheld.
References
- Adeoye OS, Ekejiuba OC (2014) Assessment of line losses and methods of reduction on selected power transmission lines in Nigeria. International Journal of Novel Research of Engineering and Applied Sciences 1: 54-63.
- Raja AK, Srivastava AP, Dwivedi M (2006) Power plants engineering. New Age International Private Ltd, New Delhi, India, pp: 1-40.
- Gupta JB (2009) A course in power systems. SK Kataria and sons, Delhi, pp: 1-2.
- Metha VK, Metha R (2005) Principles of power system. S.Chand and Company Ltd, New Delhi, pp: 13-36.
- Seebregts AJ, Giorgio S, Giancarlo T (2010) Energy technology system analysis program. IEA ETSAP Technology Brief E-02, pp: 1-5.
- Adeoye OS, Akinsanya OA (2013) Evaluation of Power Demand Capacity for Socio Economic Development in Nigeria. Research Development Journal, Federal Polytechnic, Ado Ekiti 2: 19.
- Adeoye OS, Bamisaye AJ, Akinsanya OA (2011) Renewable Energy Sources for Economic Growth andStability in Nigeria (Power Demand and Supply as Planning Scheme). 7th Engineering Forum, School of Engineering, Federal Polytechnic, Ado–Ekiti 2: 199.
- Omotoso Design Manuals (2007) China National Machinery and Equipment Import and Export Corporation CEMEC), China, pp: 6-12.
- Emeka U (2012) Omotoso chief lists impediments to operation. The Nation, p: 5.
- Omotoso Operation Manuals (2007) China National Machinery and Equipment Import and Export Corporation CEMEC, China, pp: 13-26.
- Oyedepo SO, Fagbenle RO, Adefila SS, Adavbiele SA (2014) Performance evaluation and economic analysis of a gas turbine power plant in Nigeria. Energy Conversion and Management 79: 431- 440.
Citation: Adeoye OS, Bamisaye AJ (2016) Performance Evaluation and Analysis of Omotoso Power Plant 2016 in Nigeria. Innov Ener Res 5: 134.
Copyright: ©2016 Adeoye OS, et al. This is an open-access article distributed under the terms of the Creative Commons Attribution License, which permits unrestricted use, distribution, and reproduction in any medium, provided the original author and source are credited.
Select your language of interest to view the total content in your interested language
Share This Article
Recommended Journals
Open Access Journals
Article Usage
- Total views: 15833
- [From(publication date): 6-2016 - Jul 09, 2025]
- Breakdown by view type
- HTML page views: 14442
- PDF downloads: 1391


