Parametric Study of Community Load Aggregation on Thermal Storage Efficiency
Received: 31-Mar-2013 / Accepted Date: 21-Jul-2013 / Published Date: 25-Jul-2013 DOI: 10.4172/2168-9717.1000110
Abstract
Renewable energy technologies, most notably wind, solar hot water, and solar photovoltaic are not always available to the residential sector due to financial and feasibility challenges. In this paper we investigate the potential benefit of aggregating residential loads to more closely match the renewable energy generation profiles and to have a smoother energy demand curve which can be more efficiently supplied by an energy storage system.
Four individual residential load profiles are matched against an optimized combination of wind, solar hot water, and solar photovoltaic generation. A simulation is then run to assess the percentage of the demand which must be supplied via auxiliary energy sources (i.e. the grid) with and without a thermal energy storage system. Finally, these four load profiles are randomly combined to create a 50 user community load profile. This aggregated profile is also matched against the renewable energy generation and the results are compared to individual load profile performance metrics for January, April, and July data.
In the April and July cases, the community load profile reduced the demand supplied by auxiliary energy by as much as 5% on average in a simple system without storage (An improvement over the average of the individual loads of about 11%). With storage, a community system reduces demand supplied by auxiliary energy by about 0.8%, which is an improvement over the average individual loads of also about 11%. It is concluded that community shared renewable energy systems can be beneficial not only in terms of economics and feasibility, but also in terms of thermodynamics, which is often overlooked.
Keywords: Community renewables; Thermal storage; Load aggregation; Energy simulation
73957Introduction
Community scale renewable energy generation has been increasing in popularity over the last decade. Notable projects are successfully operating in Florida, Colorado, and Arizona with more than 750 participants in the case of the Bright Tuscon Community Solar Program in Arizona. As the green movement continues to increase awareness of an interest in renewable energy use, having means of properly selecting and sizing a system becomes a must [1].
Beyond the benefits of economies of scale cost reduction and improved solar and wind resource availability, community systems allow individuals who are either unwilling or unable to install onsite solar and/or wind generation to opt in to local programs. The National Renewable Energy Laboratory has found that only 22 to 27% of residential rooftop area can feasibly be equipped with solar photovoltaics [2]. Local programs may offer economic incentives, independence from the grid, and intangible benefits stemming from environmental benefits.
Previous work has explored the potential for stored energy management and demand manipulation using user feedback and financial incentives [3]. To build upon that initial framework, we will investigate the potential benefit of implementing a community scale project over individual scale systems from a load aggregation and storage perspective. This paper will not include a study of electrical storage because the local grid network can act as an electric storage system [4].
To adequately compare individual versus community scale renewable energy generation, the various nuances between the two scales must be accounted for and modeled. The main differences between the two scales are: cost per watt (installed, maintenance, insurance, etc. for both solar and wind), land use, solar resource factors (shading, orientation options), wind resource (blockages, hub height), load profiles, storage capacity, and energy cost. The first step to creating a complete model comparing individual vs. community resource generation, on which this paper is focused, is load profile analysis. Several simplifying assumptions regarding data and system performance are made along the way, and each will be discussed as it arises. As this work develops, a complete network model detailing each household’s consumption, as was done in [5] will further validate these results and reduce the dependent assumptions. Further, generalized metrics in terms of renewable energy integration into large systems can be tested, as proposed by Tarroja et al. [6].
Methodology
Load profiles
Prior to any benefits in terms of economies of scale and shared costs, an aggregated load profile in itself can support the argument for community scale renewable energy use. An aggregated load can increase the temporal load generation and demand alignment, thereby reducing the need for storage or auxiliary energy use. Further, spikes in energy usage may be tempered given the variability of energy use between households. This reduction in overall variability of consumption also allows for more accurate load prediction. As we will discuss later, load prediction has the potential to allow for better decision making with regards to stored energy use and secondary load demands.
To simulate an aggregated load profile, we created four unique load profiles. These profiles are roughly based on typical lifestyles as follows.
• Standard workday (8-5)
• Offset standard workday (10-7)
• Retired (home most of the day)
• On vacation (rarely home)
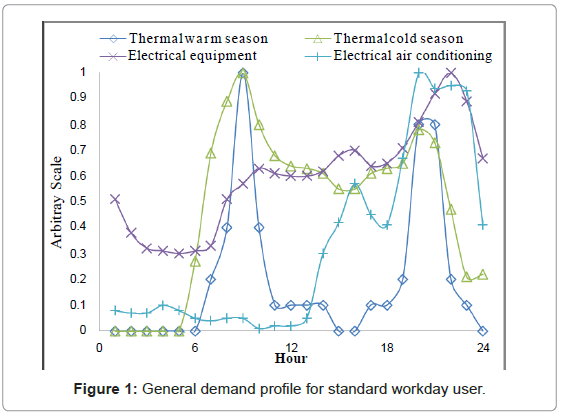
Each of these load profiles is broken down into thermal and electrical demand. Thermal demand is then further broken down to include the added demand during the cold season. Similarly, electrical demand is separated into electrical equipment, which is assumed to be constant throughout the year, and air conditioning load, which is considered from June to August. The load profile for the standard workday user is shown below in Figure 1. This profile is referenced from [4]. Each of the three other profiles is adapted from this general profile.
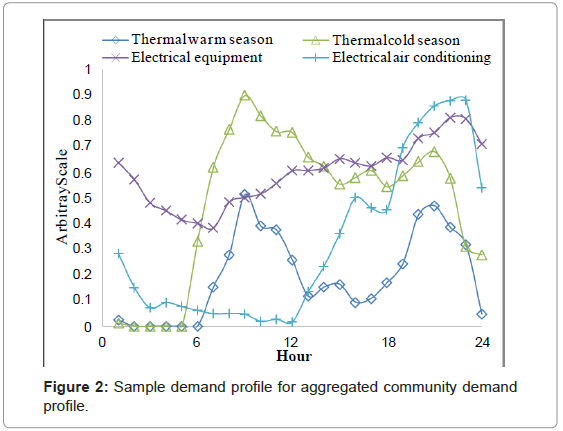
To generate the community demand profile, we must first select the number of users (households) studied. In our initial sample case study, we will assume a community of 50 households. These 50 households are then each assigned one of the different user types as well as a rudimentary usage scale. This usage scale has three simple categories, low use (0.7), average use (1), and high use (1.3). Using random numbers to assign usage scale and user type, we create a fully defined aggregate community demand profile. A sample aggregated load is shown below in Figure 2. To account for the variability of randomly generated community load profiles, 300 separate combinations are analyzed and averaged to be compared to the individual user type metrics.
Figure 2 highlights the potential for peak reduction and overall load smoothing. However, the limitation of this simulation is that load profiles are highly variable in the real world. The final shape of the community demand profile is sensitive to the original assumed profiles. In addition, these profiles are based off of hourly data, missing the detailed peaks and valleys which are typical of real-time usage data. Lastly, although the generation curves are adjusted for summer, winter, and shoulder seasons, they address only one specific climate. Nevertheless, these sensitivities can be incorporated into the final analysis to assess the robustness of the final conclusions drawn.
Energy generation
We assume three sources of energy for this paper: solar photovoltaic, solar thermal, and wind. By scaling each of these individually, we can determine the optimal sizing for the entire system using any combination of these sources. The complexity of the optimization comes from the interplay of optimal storage capacity, seasonal efficiency, and the balance of wind and solar photovoltaic scaling for load matching.
To simplify the optimization, we will consider the community project to be based in Germany, which is the same location from which the general demand profile as well as the general energy generation profiles originate.
In order to improve the analysis, the generation profiles for solar photovoltaic and solar hot water are seasonally adjusted from the common generation profile. Accounting for the variability of sunshine hours, the generation is separated into summer, shoulder, and winter seasons based on the hours of daylight received at Germany’s latitude.
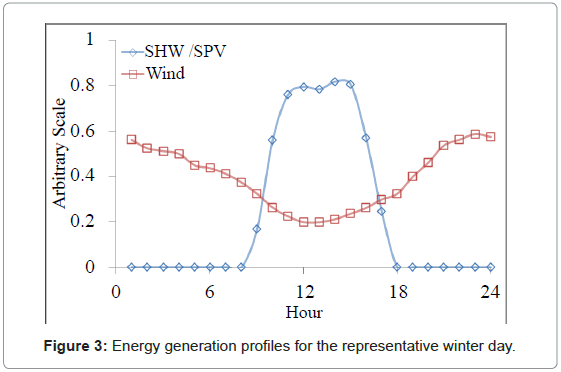
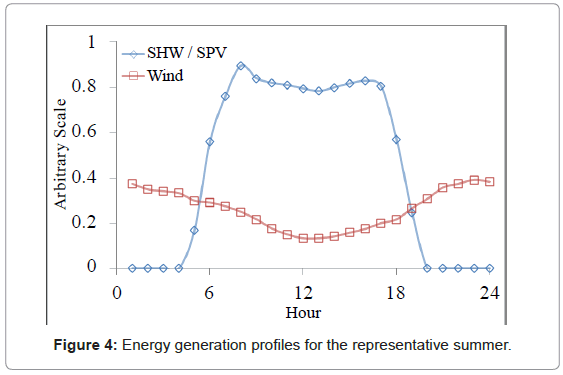
To illustrate the generation, an overlay of the various energy inputs to the system for both summer and winter seasons is shown below in Figures 3 and 4. Both solar based energy sources are given the same curves, which are correlated to the amount of available sunlight for the studied season. The wind energy generation is the greatest in the winter, and smallest in the summer. From these individual curves, each is scaled up or down as necessary in order to maximize the overlap between energy load and generation.
Load matching
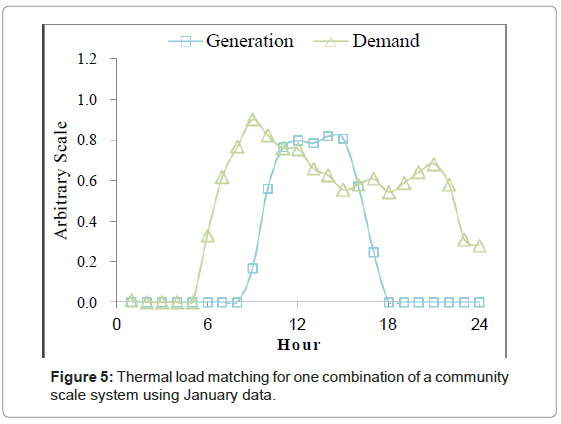
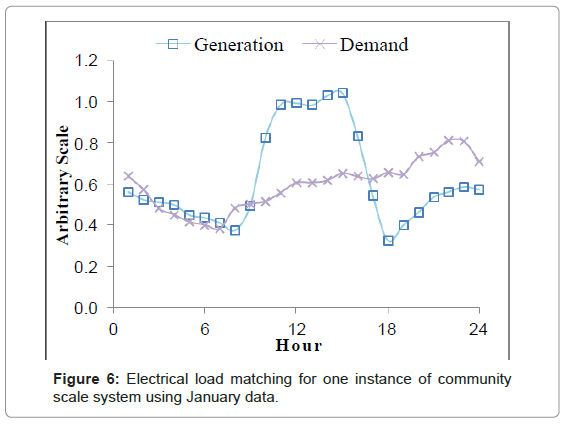
To set the baseline for our analysis, we consider the overlap of energy demand and generation for both the single user cases and the community case. The renewable energy utilization then becomes apparent as the overlapping areas under the curves. To illustrate this, the baseline load matching for the sample community load profile and energy generation in January for both thermal and electrical cases is shown below in Figures 5 and 6.
These data presented in Figures 5 and 6 represent a system sized for the average demand of the standard workday in a winter season. That is to say, with a perfect storage system, all of the demand could be supplied by the generated renewable energy. The parametric study of the impact of various combinations of load profiles on the final load matching and storage efficacy will then be conducted for a system sized to the average demand for each of the seasons, summer, winter, and shoulder.
Storage analysis
We incorporated a thermal storage system into the analysis using three losses. A separate coefficient for energy entering, idling in, and leaving the storage facility allows us to further study the effects of storage system performance on overall renewable energy utilization and therefore auxiliary energy use, which we seek to minimize. The tested loss coefficient combinations are outlined in Table 1 below.
| Scale | Low | Med | High |
|---|---|---|---|
| Loss in (%) | 0.025 | 0.05 | 0.1 |
| Loss out (%) | 0.015 | 0.03 | 0.06 |
| Loss stored (%) | 0.005 | 0.01 | 0.02 |
Table 1: Details for tested loss coefficient scales.
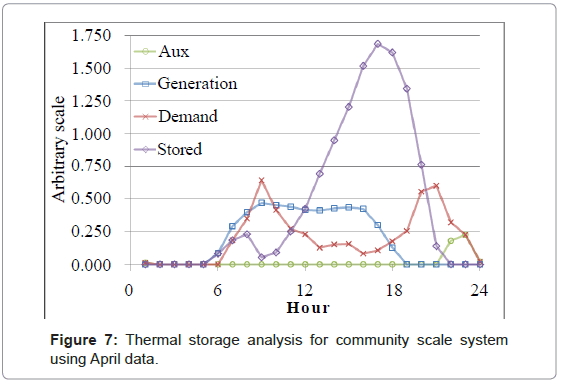
The analysis is conducted on an hourly basis. For each case, excess generation is placed into storage after accounting for a loss. Then, hour by hour, depending on the net balance of generation and demand, more energy is stored, or stored energy is used, again accounting for a loss. A sample of the thermal storage analysis is shown below in Figure 7.
The entire methodology is essentially a spreadsheet keeping track of all the energy levels and assigning losses to the thermal energy. Figure 7 above shows the results of such bookkeeping. The energy use follows a simple rule of storing when there is excess, and using stored energy when the generation does not meet the demand. Further studies aim to incorporate real-time cost data, load prediction, and even dynamic energy rates to provide an incentive for users to shift their energy consumption to times of peak generation.
As shown in Figure 7, the use of a storage system can greatly reduce the need for auxiliary power usage. The Aux. curve remains at 0 until the end of the day, when there is no more thermal energy generation due to the lack of sunlight, and when the stored energy is depleted. Without a storage system, much of the energy generated would lose due to the poor alignment of demand and generation. We will show in the following section that even with high loss coefficients the storage system can greatly reduce the auxiliary energy use, resulting in large savings in terms of costs and primary energy consumption.
Results
There are four metrics output for each studied set of loss coefficients and seasons. The first is the percent of the demand met by auxiliary energy sources (i.e. the grid) without considering any storage. Simply put, it is how well the demand and generation are matched. Next, the auxiliary energy use when storage is implemented is considered. Finally, the percentage of generated energy lost due to inefficiencies in the storage system and the reduction of auxiliary energy use are output. These various metrics are compared across different seasons, loss coefficients, and user profiles.
A total of 27 cases are simulated. January, April, and July data are simulated under low, medium, and high loss coefficients for a total of 9 simulations. These 9 simulations are then each considered for a renewable energy generation system sized to the average load of the standard workday user for January, April, and July. As expected, the system sized to the January average load results in an oversized system in April and July.
Based on the simulation results, the ideal annual system sizing is determined. This “optimal” sizing will not be completely accurate however, given that only three months of the year are considered. Optimal system sizing is not the focus of this paper, so the sizing conclusions drawn are merely to be taken as a first step towards the appropriate sizing of the system.
When the generation system is sized to the average load for each of the three months, the individual sizing of the wind, solar thermal, and solar photovoltaic system is optimized for the best thermal and electrical match between the load and generation. In this simple case study, we do not consider the effect of a storage system in the optimal system sizing methodology.
As previously mentioned, the community case represents an average of 300 random combinations of load profiles and energy usage intensities. This serves to reduce the potential for a smaller sample of community profiles yielding results which are significantly different from the mean. The results from select cases are shown below, followed by general conclusions drawn from the simulations.
The above summarized scales for the different technologies, solar photovoltaic, solar hot water, and wind show both the relative total loads between seasons and the value of each of these technologies in matching the energy demand. All of the values in the Tables 1-5 are based on the original generation and demand curves from Figures 1-4.
| Resource | SPV | SHW | Wind |
|---|---|---|---|
| January | 0.5 | 2.11 | 1.22 |
| April | 0.48 | 0.53 | 1.32 |
| July | 0.33 | 0.45 | 2.95 |
Table 2: Optimized renewable energy technology scaling for best demand/generation match.
| User | Aux (Base) | Aux (Storage) | Stor. Losses | Storage Gain | |
|---|---|---|---|---|---|
| 1 | 54.06% | 21.50% | 14.73% | 32.57% | |
| 2 | 48.90% | 16.76% | 13.21% | 32.13% | |
| 3 | 51.05% | 21.50% | 14.12% | 29.55% | |
| 4 | 51.05% | 18.48% | 14.22% | 32.57% | |
| Mean | 51.59% | 19.78% | 14.13% | 31.80% | |
| Dev. | 0.35% | 0.31% | 0.41% | 0.21% | |
| Com. | Range | 1.70% | 1.56% | 2.23% | 1.14% |
| Min | 50.71% | 18.95% | 13.06% | 31.13% | |
| Max | 52.41% | 20.50% | 15.29% | 32.28% | |
Table 3: January storage performance metrics for renewable system sized to January average load.
| User | Aux Basic | Aux Storage | Stor. Losses | Storage Gain | |
|---|---|---|---|---|---|
| 1 | 55.93% | 12.86% | 14.15% | 43.07% | |
| 2 | 56.56% | 13.44% | 15.05% | 43.11% | |
| 3 | 39.29% | 8.51% | 9.71% | 30.78% | |
| 4 | 39.80% | 10.49% | 11.35% | 29.31% | |
| Mean | 43.01% | 10.18% | 11.38% | 32.83% | |
| Dev. | 1.20% | 2.11% | 0.56% | 2.11% | |
| Com. | Range | 7.64% | 12.59% | 3.55% | 12.14% |
| Min | 40.54% | 3.47% | 9.77% | 27.35% | |
| Max | 48.18% | 16.05% | 13.32% | 39.50% | |
Table 4: April storage performance metrics for renewable system sized to April average load.
| User | Aux Basic | Aux Storage | Stor. Losses | Storage Gain | |
|---|---|---|---|---|---|
| 1 | 56.34% | 11.78% | 13.57% | 44.56% | |
| 2 | 57.57% | 13.51% | 15.05% | 44.06% | |
| 3 | 39.32% | 8.51% | 9.55% | 30.81% | |
| 4 | 35.51% | 9.92% | 10.65% | 25.59% | |
| Mean | 43.05% | 10.23% | 11.23% | 32.82% | |
| Dev. | 1.68% | 2.05% | 0.55% | 2.04% | |
| Com. | Range | 9.42% | 13.06% | 2.94% | 11.07% |
| Min | 38.83% | 2.89% | 9.67% | 27.42% | |
| Max | 48.26% | 15.95% | 12.61% | 38.49% | |
Table 5: July storage performance metrics for renewable system sized to July average load.
It is important to note that wind energy is harvested throughout the entire day, while solar photovoltaic energy is only available for part of the day. Wind energy is therefore more useful in the system studied. Having some energy available approximately all day is very important for matching the constant demand of users. In order to further optimize the balance between the technologies, an economic analysis is necessary. The solar photovoltaic generation does play the important role of increasing generation during the peak consumption times. The relationship between the two technologies can be loosely compared to a base load being catered by the wind, with the photovoltaic’s taking the role of a peaking plant.
Another observation from the scaling is the ratio of SPV to wind for the three seasons. January clearly has higher peak loads, as suggested by the higher SPV scale and lower wind scale. The reverse is true for the summer case of July. The energy use is more constant and therefore wind energy proves more useful.
This set of outputs for the January scaled system including a community of 50 users serves to illustrate the sensitivity of the storage performance to the variable aggregated profiles. With 300 random combinations of load profiles, the range of auxiliary energy use reduction was only 1.14%. This strongly suggests that no matter what the individual loads each community member has, a storage system will always save approximately 31.8% of the auxiliary energy use. It is also important to note that for this case, the community auxiliary energy use for both the storage and non-storage case is virtually identical to the weighted average of the individual users (Users 1 through 4 are weighted 30%, 20%, 20% and 20%, respectively).
The January scaled system proved to be grossly oversized for the April and July months studied, resulting in a <1% auxiliary energy usage once storage was included in the simulation. While useful for illustration purposes, a system designed to the January loads would be sub-optimal given the cost of implementing such a system.
Unlike the January case, the range of auxiliary energy use with an incorporated storage system is significant, at about 12.6%, with a mean of 10.2%. The parametric study for this case has revealed that some combinations of load profiles can results in an auxiliary energy use of only 3.5% after storage. The result is an improvement on any of the individual users alone. However, the reality is that load profiles are not constant from user to user, or even day to day. While the 3.5% figure is very strong, we must focus on the mean auxiliary energy use, as it more accurately reflects the transience of energy usage in the real world. Still, the mean auxiliary energy use with storage of 10.2% is better than the simple weighted average of 11.5% for users 1 through 4. This suggests that the combination of the load profiles does in fact cater to a better shaped usage profile for storage use. Further, the non-storage case of simple load matching is also an improvement on the simple weighted average result of 48.7%. The results for these simulations suggest that load aggregation does in fact reduce the auxiliary energy usage by at least 5% prior to any storage use. For the 50 user community, this is effectively saving the energy consumption of 2-3 households.
The July simulation has similar results. The aggregated community profile results in an improvement in both auxiliary energy uses for both storage and non-storage systems over the weighted averages. In the simple load matching, non-storage case, the community system reduces the auxiliary energy use by 5%. The improvement over the average for the storage scenario is only about 0.8% of auxiliary energy use, but it is still worth noting given that the total use after storage is only about 11%. In fact, the worst combination of load profiles and usage intensities results in an auxiliary energy use of about 48%, which is still lower than the 56% observed for a traditional, standard workday load profile user.
The performance of the system was not significantly impacted by the loss coefficients tested. We therefore conclude that these results are general for a variety of system efficiencies. That is to say, the general conclusion that community loads result in a smoother load profile that is more suited to storage holds. The optimally sized system based on this study is the one sized to the shoulder season average load. This is unsurprising at the shoulder season represents a more average annual load.
Overall, the results shown above support the idea that aggregated loads can improve auxiliary energy usage purely on the basis of energy generation and demand matching. This basic improvement is just the first benefit. Aggregated loads allow for better energy management and storage thanks to improved of load prediction and demand variability. Finally, aggregated community loads have the social benefit of providing users with access to renewable energy that are otherwise unable or unwilling to install personal scale renewable energy systems.
Conclusions
Addressing the loads of a community as a whole, rather than on an individual basis with renewable energy can lead to more efficient use of the available energy. In this paper, we simulated the hourly energy balance for four unique load profiles as well as for a community load profile made up of a random combination of the four individual profiles. The summer, winter, and shoulder seasons are studied via representative months.
In the summer and shoulder season case, the community load profile improves the generation and demand transient overlap as well as the auxiliary energy usage for a system using thermal storage. Given that net metering contracts are increasingly available with utilities, electrical storage was not considered in this paper.
References
- National Renewable Energy Laboratory (2008) Supply Curves for Rooftop Solar PV-Generated Electricity for the United States.
- Treado, Carbonnier (2012) Real-Time Optimization of Shared Resource Renewable Energy Networks. Proceedings of the Sustainability in Energy and Buildings Conference.
- Barbieri, Melino, Morini (2011) Influence of the thermal energy storage on the profitability of micro-CHP systems for residential building applications. Applied Energy: 3-4.
- Bianchi M, De Pascale A, Spina PR (2012) Guidelines for residential micro-CHP systems design. Applied Energy 97: 673-685.
- Ben Ilyes Hassine, Ursula Eicker (2013) Impact of load structure variation and solar thermal energy integration on an existing district heating network. Applied Thermal Engineering 50: 1437-1446.
- Tarroja B, Mueller F, Eichman JD, Samuelsen S (2012) Metrics for evaluating the impacts of intermittent renewable generation on utility load-balancing. Energy 42: 546-562.
Citation: Carbonnier K, Treado S (2013) Parametric Study of Community Load Aggregation on Thermal Storage Efficiency. J Archit Eng Tech 2: 110. DOI: 10.4172/2168-9717.1000110
Copyright: ©2013 Carbonnier K, et al. This is an open-access article distributed under the terms of the Creative Commons Attribution License, which permits unrestricted use, distribution, and reproduction in any medium, provided the original author and source are credited.
Share This Article
Recommended Journals
Open Access Journals
Article Tools
Article Usage
- Total views: 15421
- [From(publication date): 7-2013 - Apr 05, 2025]
- Breakdown by view type
- HTML page views: 10796
- PDF downloads: 4625

