Review Article Open Access
Outline about Biological and Chemical Coordinations of Some Sulphonyl Drugs
| MG Abd El-Wahed1, Mohamed Y El-Sayed1,2, Samy M El-Megharbel1,3, Yasmin M Zahran1, and Moamen S Refat3,4* | ||
| 1Department of Chemistry, Faculty of Science, Zagazig University, Egypt | ||
| 2Faculty of Applied Medical Science, Al Jouf University-Al Qurayate, Egypt | ||
| 3Department of Chemistry, Faculty of Science, Taif University, 888 Taif, Kingdom Saudi Arabia | ||
| 4Department of Chemistry, Faculty of Science, Port Said, Port Said University, Egypt | ||
| Corresponding Author : | Moamen S Refat Department of Chemistry Faculty of Science Port Said, Port Said University, Egypt Tel: +966 561926288 E-mail: msrefat@yahoo.com |
|
| Received January 22, 2014; Accepted February 19, 2014; Published February 25, 2014 | ||
| Citation: Abd El-Wahed MG, El-Sayed MY, El-Megharbel SM, Zahran YM, Refat MS (2014) Outline about Biological and Chemical Coordinations of Some Sulphonyl Drugs. J Infect Dis Ther 2:132. doi:10.4172/2332-0877.1000132 | ||
| Copyright: © 2014 Abd El-Wahed MG, et al. This is an open-access article distributed under the terms of the Creative Commons Attribution License, which permits unrestricted use, distribution, and reproduction in any medium, provided the original author and source are credited. | ||
Related article at Pubmed Pubmed  Scholar Google Scholar Google |
||
Visit for more related articles at Journal of Infectious Diseases & Therapy
Abstract
During the past two decades, considerable attention has been paid to the chemistry of the metal-drug interactions. It has been suggested that the presence of transition or non-transition metal ions in biological fluids could have a significant effect on therapeutic action of drugs. The successful synthesis, interpretations and application of novel metal complexes can have a great impact on all areas of chemistry and biology. It’s worthwhile to study the synthesis and characterizations of some complexes containing nucleus of sulfonylurea’s which have a widely known concerning the biological application in our life. As yet from the literature survey, little information is available about the metal complexation of sulfonylureas compounds, which are effective as coordinating ligands with the functional sites like sulfon-amide group. In view of the biological, physico-chemical properties and industrial importance of these ligands and their metal complexes, the aim of the present work is to shed light on the understanding about the nature of interaction and chelation between metal ions and these moieties, investigation of the physico-chemical properties of the ligand and their metal complexes and screening of the ligands and their metal complexes for their biological activity. Sulfonylureas are the most commonly prescribed diabetes medicines. They are inexpensive and have few side effects. These medicines help your body make insulin. They can be taken alone or with metformin, an alpha-glucosidase inhibitor, pioglitazone or insulin. If you’re allergic to sulfa, you can’t take a sulfonylurea.
| Sulfonylureas | |
| Diabetes is a deceptive disease and if not detected in early stage may cause even death. It is considered hereditary but actual genetic disorder is still a mystery several million people are suffering from this disease all over the world [1]. In recent years, much attention is given to the use of sulphonylureas because of their high complexing nature with essential metals. Sulfonylureas are used primarily for the treatment of diabetes mellitus type 2. They are completely absorbed on oral administration. They are metabolized by liver; they are effective in the absence of functioning B-cell [2]. Currently the most commonly prescribed medications for Type2 diabetes were metformin and the second generation sulfonylureas which included glipizide, GLZ, glibenclamide and glimperide. | |
| Gliclazide | |
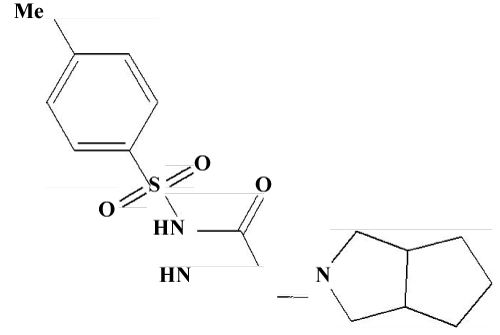
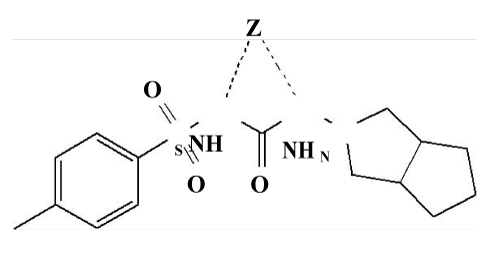
| Structure of Gliclazide | |
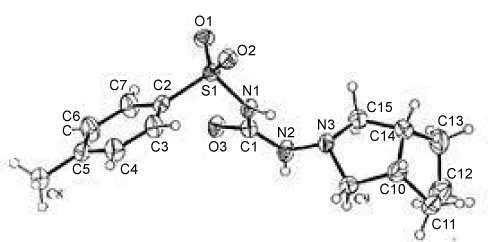
| The crystal structure of Gliclazide, [3] N-[(perhydrocyclopenta [c] pyrrol-2-yl) aminocarbonyl] p-toluenesulfon-amide, C15H21N3O3S, a second-generation oral hypo-glycemic agent, contains discrete molecules with normal molecular dimensions. Both of the fivemembered fused rings adopt envelope confirmations. The molecules are linked into chains by intermolecular hydrogen bonds involving amino-H atoms, with N---O separations of 2.967 and 2.949oA. | |
| The structure of Figures 1 and 2 is composed of discrete molecules, with molecular dimensions within the expected ranges. Similar corresponding bond distances and angles have been reported in the related hypoglycemic agents 1-(4-chlorophenylsulfonyl)3-(hexahydro- 1H-azepin-1-yl) urea and 1-(4-methylphenyl sulphonyl)-3-(hexahydro- 1H-azepin-1-yl) urea. In the perhydrocyclo-penta [c] pyrrol moiety in Figure 1, the mean values of the bond distances are Csp3-Csp3 = 1.52(2) and Csp3-N =1.469 (4)°A, and the fused five-membered cyclopentane (C10-C14) and pyrrol (N3, C9, C10, C14, C15) rings adopt C12- and N3- envelope confirmations, respectively, with C12 0.574(4) and N3 0.523(7) οA out of the planes of the remaining atoms of the corresponding rings. The mean bond distances in the p-toluenesulfonylmoiety are C-Caromatic = 1.374(3), S-O = 1.423(4), Csp3- Csp3 =1.497(4) and S- Csp2 = 1.758(3) οA, the aromatic ring being essentially planar. There are short intermolecularhydrogen bonds involving both of the amino-H atoms and the carbonyl and one of the sulfonyl-O atoms; the other sulfonyl-O atom is not involved in such interactions. Molecules are linked by N-H…O hydrogen bonds to give chains extending in the c direction. | |
| Coordination mode of metal Gliclazide complexes | |
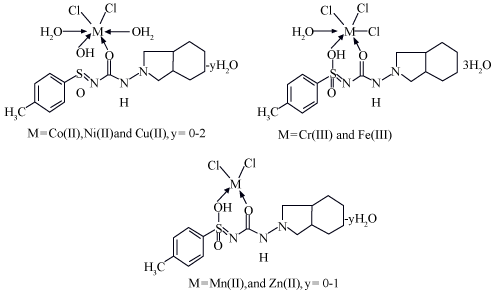
| The IR spectra [4] of the complexes are compared with those of the free GLZ ligand in order to determine the coordination sites that may be involved in chelation. The tautomeric equilibrium depends on the extent of conjugation, nature and position of the substituents, polarity of the solvent. This phenomenon has drawn considerable attention by several investigators and characteristic spectral bands have been assigned to the individual tautomers. The sharp band at 1640 cm-1 can be assigned to the amide carbonyl of the saturated side chain moiety. A broad band spreading over the region 3400–3100 cm-1 can be ascribed to NH groups. The stretching vibration band; v(NH), of the sulfonamide group in the free ligand is hidden under the peak of water molecules or due to the enolization. The presence of co-ordinated water molecules renders it difficult to confirm the enolization of the sulfonamide group. The SO2 group modes of the GLZ drug appear as sharp bands at 1375 and1100 cm-1 due to vasym (SO2) and vsym (-SO2), respectively. In the complexes, the asymmetric and symmetric modes are shifted to 1399– 1410 and 1125–1160 cm-1, respectively, upon coordination to the metal ions [5,6]. The shift of the SO2 stretching vibration to higher frequencies may be attributed to the transformation of the sulphonamide (SO2NH) to give the enol form (SO(OH)N) as a result of complex formation to give more stable six-membered ring [5-7]. The IR bands at 815–855 and 752–770cm-1, t (H2O) of coordinated water, is an indication of the binding of the water molecules to the metal ions. New bands are found in the spectra of the complexes in the regions 552–537 and 425–500 cm-1, which are assigned to t (M–O) stretching vibrations of the amide and sulfonamide-O atoms [6]. Therefore, GLZ drug behaves as a neutral bidentate ligand coordinating to the metal ions via amide-O and enolic sulphonamide-OH (Figure 3). | |
| Solubility of Gliclazide | |
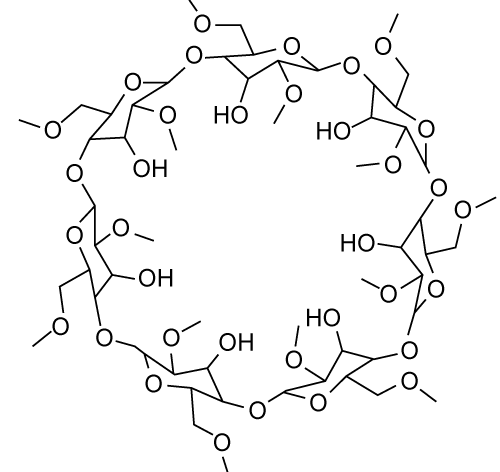
| Gliclazide is a second generation hypoglycemic sulfonylurea which is useful in the treatment of type 2 diabetes mellitus [8]. Gliclazide exhibits slow rate of absorption and inter individual variation in bioavailability. Stated problems of gliclazide might be due to its poor water solubility and slow dissolution rate [9]. Few attempts have been made for improvement of solubility and bioavailability of gliclazide including complexation with cyclodextrin or cyclodextrin–hydroxyl propyl methyl cellulose [10]. Figure 4, it is having higher water solubility, easy complexation property. They can be used to increase drug solubility, to increase drug dissolution speed, to increase drug bioavailability and to stabilize the drugs. | |
| Biological properties of Gliclazide derivatives | |
| Gliclazide is one of second-generation sulfonylureas. It is commonly used in type II diabetes, previously known as non-insulin-dependent diabetes mellitus (NIDDM), it shows good general tolerability, low incidence of hypoglycaemia, low rate of secondary failure and may represent a better choice in long-term sulphonylurea therapy. Besides reducing blood sugar, gliclazide can improve the cruor function and further delay the occurring of blood vessel neopathy. It is also suggested that due to its short-term acting, gliclazide may be suit-able for use in diabetic patients with renal impairment and elderly patients whose reduced renal function may increase the risk of hypoglycemia following some sulphonylureas [11] for these advantages; gliclazide is widely regarded as one of the best persral medicines for diabetics. | |
| Glimepiride | |
| Structure of Glimepiride | |
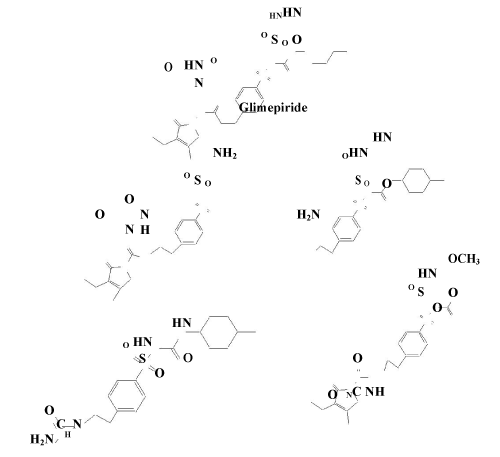
| Glimepiride is a third generation sulfonylurea type oral hypoglycemic agent, which is widely used in treatment of type 2 diabetes [12]. Chemically, it is 1-[[4-[2-(3-ethyl-4-methyl-2-oxo-3-pyrroline-1- carboxamido)-ethyl] phenyl] sulfonyl]-3-trans-(4- methyl cyclo hexyl) urea (Figure 5). The presence of a sulfonylurea bridge, a carbox-amide linkage, a constrained lactam ring and an α, B- unsaturated carbonyl system in chemical structure of glimepiride makes the drug susceptible to degradeation, due to labiality of these linkages and functional groups to hydrolysis and photolysis [13] As a result, several degradation products are anticipated to be formed during formal stability testing of the drug. | |
| Coordination mode of Glimepiride metal complexes | |
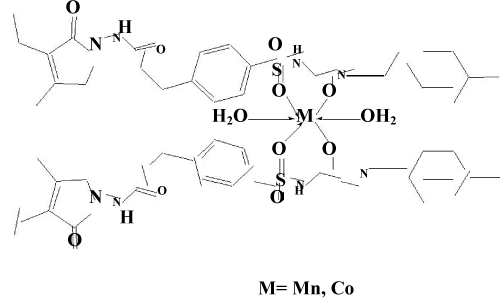
| The IR spectra [14] of the ligand and the isolated complex were recorded in the range 4000-450 cm-1. The proposed structure (Figure 6), for the isolated complex is also supported by IR absorption bands and characterized by the absorption of carbonyl (C=O) group at 1701 cm-1 and 1703cm-1 in Mn(II) and Co(II) ligand complex respectively. Also the NH group observed at 3288 cm-1 in the ligand glimepiride shifted to 3286 cm-1 in cobalt glimepiride complex. While in the case of manganese glimepiride complex the band frequency is just disappear. The next IR band of structural significance of the ligand appears at1394 cm-1 which may be assigned to νS=O which got shifted downward at 1353 cm-1 in manganese glimepride complex while in cobalt ligand complex it just appears at 1357 cm-1 respectively, The shift of the νC=0 and νS=0 by decreased frequencies in the complex indicates that these groups are involved in the complexation. The linkage through amide -O- and sulphone –O- atom was further supported by the appearance of a band in the far IR region at 670 cm-1 and 672 cm-1, in the Mn(II) and Co(II) complex that may be assign-nable to M-O frequency [15]. Additional band in the complex region of Mn(II) and Co(II) at 1447 cm-1 and 1430 cm-1 compared with IR spectra of free ligand has tentatively been assigned to six membered enolic ring structure modified to chelate ring formation in complex. A strong band in the region of 3379 cm-1 and 3687 cm-1 indicates the presence of coordinated water for Mn-glime complex and Co-glime complex respectively. | |
| Solubility of Gliclazide | |
| Glimepiride (GMP) [16] is a third generation sulfonyl-ureas used for treatment of type 2 diabetes. Poor water solubility is the main constraint for its oral bioavailability. To increase the solubility and dissolution of the drug by preparing complexes with B-cyclodextrin and Hydroxy propyl cyclodextrin. | |
| Biological properties of Glimepiride derivatives | |
| Glimepiride is one of the third generation sulfonylurea drugs useful for control of diabetes mellitus, type 2. Preclinical investigations of glimepiride suggested anumber of potential benefits over sulfonylureas currently available including lower dosage, rabid onset, longer duration of action and lower insulin C-peptide levels, possibly due to less stimulation of insulin secretion and more pronounced extra pancreatic effects [17]. | |
| Sulfa Drugs | |
| Sulfa drugs [18] have attracted special attention for their therapeutic importance as they were used against a wide spectrum of bacterial ailments. Also, some sulfa drugs were used in the treatment of cancer, malaria , leprosy and tuberculosis. The importance of the very interesting features of metal coordinated systems is the concerted spatial arrangement of the ligands around the metal ions [19]. Although the complexes of the sulfa drugs have been investigated in the solid state, relatively was known about their solution chemistry in particular their mixed-ligand complexes [20]. The formation and characterization of binary and mixed-ligand complexes, involving iminodiacetic acid and sulfa drugs as sulfadiazine and sulfadiamidine, were investigated. | |
| Sulfasalazine | |
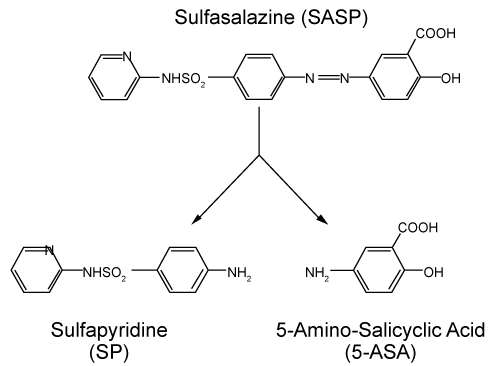
| Structure of Sulfasalazine: Sulfasalazine is sulfadrug, a derivative of Mesalazine is composed by sulfapyridine (SP) and 5-aminosalicylic acid (5-ASA) with a diazo bond linkage (Figure 7). 5-ASA is considered to be the active component. It is an anti-inflammatory drugs used to treat of the digestive tract ulcerative colitis and mild to moderate crohns diseases [21]. The chemical formula of sulfasalazine is 2-hydroxy-5-[[4- [(2-pyridinylamino) sulfonyl]azo]benzoic acid. | |
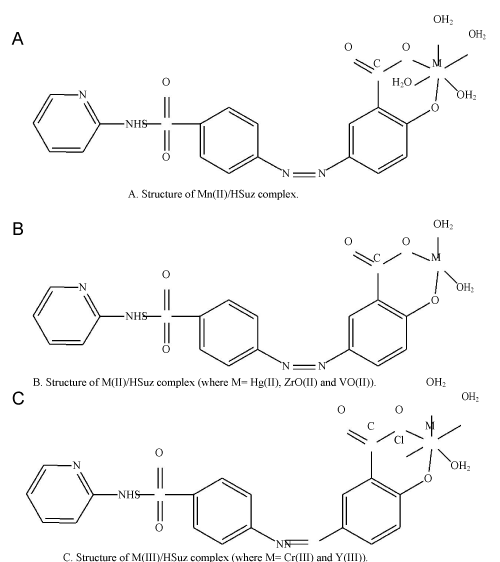
| Coordination mode of Sulfasalazine complexes: The infrared spectra of sulfasalazine [22] and its com-plexes exhibited with the main coordination bands which reveal the mode of bonding. Concerning the sulfasalazine com-plex, the most important region in the infrared spectra of allcomplexes and the H3Suz free ligand (~1700–1300 cm-1) as follow: In contrast to the assignments data of Mn(II), Hg(II), Cr(III), ZrO(II), VO(II) and Y(III) complexes show no absorption band at 1677 cm-1, characteristic of the ν(C=O) vibration of the carboxylic group (in case of free H3Suz ligand), that is indicative of the involvement of the carboxylic group in the co-ordination with metal ion. The peaks at 1598 cm-1 (vs) for Mn(II)/HSuz, 1594 cm-1 (s) for Hg(II)/HSuz, 1598 cm-1 (vs) for Cr(III), 1595cm-1(vs) for ZrO(II)/HSuz, 1588 cm-1 (s) for VO(II)/ HSuz and 1594 cm-1 (s) for Y(III)/ HSuz complexes, respectively are absent in the spectrum data of the free H3Suz and can be assigned to the asymmetric stretching vibration of the carboxylate group,νas(COO–). The spectra of [Mn(HSuz)–2(H2O)4].2H2O, [M(HSuz)–2(H2O)2]. | |
| xH2O (M=Hg(II), ZrO(II) and VO(II), x=4, 8 and 6, respectively) and[M(HSuz)– 2(Cl)(H2O)3].xH2O (M = Cr(III) and Y(III), x=5 and 6, respectively) complexes also have medium to strong intensity band in the range of 1309–1327 cm-1. This band is absent in spectrum of Suz and interpretive to the symmetric vibration of the νs(COO–) group. Deacon and Phillips (1980) [23] studied the criteria that can be used to distinguish between the three binding states of the carboxylate complexes. These criteria are: (i) Δν>200 cm-1 (where Δν=[νas(COO–)– νs(COO–)]), this relation is found in case of unidentatecarboxylato complexes, (ii) bidentate or chelating carboxylato complexes exhibit Δν significantly smaller than ionic values (Δν< 100 cm-1), and finally (iii) bridging complexes show Δν comparable to ionic values (Δν ~ 150 cm-1). The observed Δν for all the sulfasalazine complexes is >200 cm-1 which confirms a unidentate interaction of the carboxylate group. A broad diffuse band of strong to medium strong intensity in the 3500– 3350 cm-1 region may be assigned to the OH stretching vibration for the coordinated and uncoordinated water molecules in the H3Suz complexes. It is noteworthy to say that when the media of precipitation is sodium hydroxide, this means that the sodium salt of sulfasalazine is formed, so, the stretching vibration band of ν(OH) of carboxylic group. As is also difficult distinction between the ν (OH) of phenolic group of sulfasalazine and the stretching Vibrational bands of water molecules because of the overlapping values, and appear in one place. To ascertain the involvement of ν (OH) of phenolic group of sulfasalazine in the coordination process to be followed by the stretching vibration bands of ν (C–O) in all sulfasalazine complexes, examination of the H3Suz complexes found that the ν (C–O) shifted to lower wave number from 1278 cm-1 in case of free ligand to 1230 to 1260 cm-1 in case of their complexes. This result indicates that the phenolic group participated in the complexation and the H3Suz ligand acted as bidentate. The lower shift of δ (OH) from 1393 cm-1 in the free H3Suz ligand to1360–1350 cm-1 in their complexes is another factor confirming the involvement of OH phenolic group in the coordination process. The presence of M–O stretching vibrations at two bands: 516 and 454 cm-1 for Mn(II)/HSuz, 512 and 486 cm-1 for Hg(II)/HSuz, 524 and 435 cm-1 for Cr(III)/HSuz, 525 and 492 cm-1 for ZrO(II)/HSuz, 452 and 422 cm-1 for VO(II)/ HSuz and (524 and 439) for Y(III)/HSuz, respectively supports coordination by H3Suz ligand as a bidentate monoanionic chelating agent via OH of carboxylic and phenolic groups (Figure 8). | |
| Biological Properties of Sulfasalazine derivatives: Sulfasalazine ia a sulfa drug, used primarily as an anti-inflammatory agent in the treatment of inflammatory bowel disease as well as rheumatoid arthritis [24] and ulcerative colitis and crohns disease. In addition, sulfasalazine (SASP) has been reported to be effective in the treatment of ankylosing spondylitis chronic lupus erythematosus and in improving lung histopathologyin chronic, asthma. | |
| Spectroscopic Studies | |
| Infrared spectroscopy | |
| Gliclazide complexes: The infrared spectrum of gliclazide and its metal complexes were recorded as a potassium bromide disc method on a Shimadzu Model IR 470 infrared spectrophotometer [25]. The prominent IR absorption bands of gliclazide were in the range of 3100- 3300 cm-1 due to urea NH stretching. A very sharp peak observed at 2900 cm-1 due to CH stretching. At 1700 cm-1, a strong absorption due to C=O stretching. Strong absorption bands appeared in the range of 1350 –1590 due to C=C, at 1160 cm-1 peaks were due to SO2, while C-O peak was at 1080 cm-1. The carbonyl band appeared at 1700 cm-1 in reference standard, but in transition metal complexes this stretching frequency increased towards 1720–1760cm-1. For magnesium complex the band was observed at 1720 cm-1 in the form of sharp peak. In case of calcium complex this band appears at 1710 cm-1 in the form of sharpdoublet, whereas in chromium complex it occurs at 1730 cm-1 as a weak band. In case of manganese complex the frequency of the carbonyl is observed at 1710 cm-1 as a sharp-doublet band. In addition, iron complex it occurs at 1730 cm-1 as a sharp band. Nickel complex shows a weak band in the region of 1730cm-1. In case of copper complex the carbonyl band appears at 1730 cm-1 as a sharp doublet, whereas in zinc complex it is observed at 1760 cm-1 as a sharp band. In case of cadmium complex the carbonyl peak appears at 1730 cm-1 in the form of a sharp band. All these shifting of bands clearly indicate that coordination is possible at the site through the –NH-CO- group. | |
| The absorption peak between 600-800 cm-1 are due to the deformation of adjacent hydrogen, in metal complexes this is also present with slight changes, but these changes are negligible. Gliclazide shows band in the region 3100-3300 cm-1 as sharp triplet, which is due to the urea NH stretch. In metal complexes such as magnesium, this occurs at 3100-3300 cm-1 as a sharp doublet, in calcium complex it occurs in the region 3100-3200 cm-1 as a weak band in the form of doublet. In case of chromium complex amide appears at3250 cm-1 as a weak band, whereas in case of manganese complex this occurs at 3210 cm-1 as a smallest band. In iron complex it exists at 3250 cm-1 as a medium peak, in case of nickel complex it appears at 3240 cm-1 as a sharp band. In case of copper complex it is present at 3230 cm-1 as a smallest band. Urea NH stretch appears in zinc complex at 3200 cm-1 as a weak band and in case of cadmium it exists at 3225 cm-1 in the form of a medium band. | |
| The IR spectra of SDs and PMs were compared with the standard spectrum of gliclazide [8]. The IR spectrum of gliclazide is characterized by the absorption of carbonyl(C=O) sulfonylurea group at 1,706 cm-1. In the spectra of SDs and PMs, this band was shifted towards higher wavenumber at 1711 and 1709 cm-1, respectively [26]. Also, the NH group which is located at 3265 cm-1 from the IR spectrum ofgliclazide was shifted to s 3630 cm-1 in SDs. The sulfonyl group bands are located at 1349 and 1162 cm-1 in pure gliclazide. In SDs, the asymmetrical vibration peak ofS=O band was shifted from 1,349 to 1,342 cm-1 with decreased frequencies. In SDs, the symmetrical stretching vibration band of S=O was shifted from 1,162 to 1,113 cm-1 with decreased frequencies. The spectrum of PVP K90 exhibited important bands at 2953 cm-1 (C–H stretch) and1652 cm-1 (C=O). A very broad band was also visible at 3446 cm-1 which was attributed to the presence of water, confirming the appearance of broad endotherm in DSC run due to the presence of water [27]. The IRspectra of ligand and isolated complexes were scanned within the range 4000-400 cm-1[1]. IR spectrum shows important bands due to n(M-O) 400-600 cm-1, v(Ar-S) 700-800cm-1, v(-S-N) 1085 ± 20 cm-1, v(SO2-N) 1140 ± 20 cm-1, v(C-N) 12320 ± 20cm-1, v(S=O) 1340 ± 20 cm-1, v(C=O)1710 cm-1 (present only in pure drug and absent in complex),160 0cm-1vs (coordinate H2O molecule present only complex), v(NH-stretch) 3274 ± 20 cm-1. The proposed structure for the isolated complexes is also supported by IR absorption. To confirm the complexation of Gliclazide with HPβ-CD in the solid state [28], IR spectroscopy was employed to compare pure drug, HPβ- CD, physical mixture and inclusion complexes formed by kneading and solvent evaporation methods The infrared spectrum of pure Gliclazide showed principal peaks at 1164 cm-1 (S=O asymmetrical vibration band), 1347 cm-1 (S=O symmetrical vibration band), 1596 cm-1 (NH deformation band), 1710 cm-1 (C=O stretching band) (C=O deformation), 3273 cm-1 (NH stretching band). The FT-IR spectra of HPβ-CD showed prominent absorption bands at 3418 cm-1 (for O–H st retching vibration), 2931 cm-1 (for C–H stretching vibration) and 1157 cm-1, 1082 cm-1 (C–H, C–O stretching vibration). In IR spectrum of physical mixture corresponds simply to the superposition of the IR spectra of the pure Gliclazide and pure HPβ-CD. Absence of additional peaks indicated that there were no interaction between Gliclazide and HPβ-CD. | |
| The IR spectra of the sample prepared by kneading method showed small differences when compared with pure drug like decreased intensity of the NH deformation band at 1596 cm-1 and carbonyl stretching band at 1710 cm-1, narrowing of the peak at 3273 cm-1 (NH stretching band), broadening of peak at 1164 cm-1 (S = O asymmetrical vibration bands) and 1348 cm-1 (S=O symmetrical vibration bands). Absence of additional peaks indicated that there were no interaction between Gliclazide and HPβ-CD. The IR spectra of the sample prepared by solvent evaporation method showed small differences when compared with pure drug like broadening of peaks at 1164 cm-1 (S=O asymmetrical vibration band) and 1348 cm-1(S=O symmetrical vibration band), decreased intensity of the NH deformation band at 1596 cm-1 and carbonyl stretching band at 1710 cm-1, narrowing of the peak at 3273 cm-1. Absence of additional peaks indicated that there were no interaction between Gliclazide and HPβ-CD. | |
| Glimepiride complexes: The IR spectrum of glimepiride [17] reveals the presence of peaks at 3369 and 3288 cm-1 due to N–H stretch for urea, peaks at 1345 and 1153 cm-1 corresponding to the sulphonamide group and peaks at 1708 and 1674 cm-1 corresponding to the carbonyl group. The IR spectrum of the investigated CyDs is characterized by intense bands at 3300–3500 cm-1 due to O-H stretching vibrations. The vibration of the CH and CH2 groups appears in the 2800–3000 cm-1 region. The spectrum patterns of the physical mixtures corres-pond simply to superposition of the IR spectra of the two components. The IR spectra of glimepiride–CyD complexes show considerable differences when compared with those of their corresponding constituents. A decrease in frequency of a specific peak is generally seen on complexation, which indicates an ordering of the molecule [29]. The vibrations of sulphonylurea groups were shifted towards higher frequencies, suggesting that after the formation of the inclusion complexes, existing bonds were broken and also reduced in their intensities [30]. Similarly the N–H stretching modes of the amide exhibited a broadening when the inclusion complexes were formed. These modifications clearly indicate the presence of host– guest interactions and suggest the formation of stable hydrogen bonds between glimepiride and CyDs [31,32]. The most elegant way to study the interactions between the polymer and the drug by infrared light is the application of ATR technique [33]. Since the light penetration depth was reproducible and comparable for all studied samples, the ATR spectra were suitable to study the spectral changes caused by polymer–drug interactions. The interactions between glimepiride and HB polymers in solid dispersions were studied using difference spectroscopy. The ATR spectra of pure HB polymers were subtracted from the spectra of solid dispersions containing glimepiride and HB polymer in weight ratio of 5/95% (w/w). The most prominent changes in the infrared spectrum due to interactions between Hybrane HA1690 and glimepirideare the appearance of abroad absorption with the Centre at ~2450 cm-1 and red shifts of v(O)–C=O and (N)–C=O bands. The appearance of the negative band at 1725 cm-1 and positive at 1691 cm-1 is the result of frequency down shift of the(O)–C=O stretching band of Hybrane HA1690. Similar frequency shift is observed for (N)–C=O stretching, which shifts from 1636 cm-1 to 1598 cm-1. Such frequency shifts are characteristic for hydrogen bond formation. Further evidence for hydrogen bond formation caused by complexation between the drug and HB polymer is a broad absorption of the NH stretching band near 2450 cm-1. Significant broadening and shifting of the NH stretching band to lower wave numbers (~2450 cm-1) announce the presence of relatively strong hydrogen bonds in glimepiride/Hybrane HA 1690 complex. Similar difference spectrum was obtained by subtracting the pure spectrum of Hybrane S1200 from its complex with glimepiride. The red shift of the (O)–C=O and (N)–C=O stretching band and the appearance of the broad absorption due to hydrogen bonded NH groups are also present in this type of difference spectrum. In the regions characteristic for vibrations of hydroxyl groups of Hybrane S1200 functional groups no noticeable changes were observed, meaning that hydroxyl groups do not participate in H-bonding. The observed changes in both infrared difference spectra imply the existence of hydrogen bonds between the NH groups of glimepiride and carbonyls of ester (O)–C=O and amide (N)–C=O groups of Hybrane polymers. The type of hydrogen bond formation between the drug and HB polymer is similar in both Hybrane polymers. From the presented results we can conclude that HB polymers serve mainly as a source of proton acceptor groups to which NH groups of glimepiride establish hydrogen bonds. The loading capacity for both hyper branched polymers was estimated to be around 5% (w/w) of glimepiride. Solid dispersions containing higher amounts of glimepiride appear to be oversaturated, so that noncomplexed glimepiride crystallizes as a separate solid phase during the solvent evaporation. The results of X-ray diffraction study suggest that glimepiride is in amorphous form within solid dispersions containing HB polymer. IR results indicated that glimepiride form complex with hyper branched poly(esteramide)s through hydrogen bonds between the NH groups of glimepiride and carbonyls of ester (O)– C=O and amide (N)–C=O groups of hyper branched polymers. Therefore, the improved glimepiride solubility was ascribed to complex formation between glimepiride and poly (esteramide)s hyper branched polymers. | |
| Sulfasalazine complexes: The IR spectra of the free ligand and its metal complexes were carried out in the range of 4000–400 cm-1 [34]. The IR spectrum of H2SSZ showed a medium broad band at 3439 cm-1 which attributed to OH of the phenolic and carboxylic OH groups. The carboxylic OH group is not considered in the spectra of complexes since ammonical solution of sulfasalazine was used in which the carboxylic was used as the ammonium salt. The existence of water of hydration and/or water of coordination in the spectra of the complexes render it difficult to get conclusion from the phenolic OH group of the sulfasalazine, which would be overlapped by those of the water molecules. The participation of the phenolic group is further confirmed by clearifing the effect of chelation on the ν(C-O) stretching vibration. The shift of the ν(C-O) of phenolic group, from 1281 cm-1 in the free H2SSZ [35,36] ligand to 1271–1256 cm-1 in the complexes indicated the participation of the phenolic group in complex formation [37]. Also the participation of the OH group is apparent from the shift in position of the δ (OH) in-plane bending from1394 cm-1 in the free H2SSZ ligand to 1388–1374 cm-1 in the complexes. The presence of water molecules in the above mentioned complexes is assisted by the appearance of a broad band within the range 3450–3300 cm-1, which is attributed to ν (OH2) of the water molecules associated with the complex formation. Also a bending vibration of the water molecules; δ(OH2), is found in the range 965–914 cm-1. The other bending vibration of the water molecules; δ (OH2), is usually around1600 cm-1 which always interferes with the skeleton Vibration of the benzene ring (C=C vibration). The participation of the carboxylic group in chelation can be indicated from the changes of the bands of the asymmetric and symmetric stretching vibrations of the carboxylate group upon complex formation. The spectrum of H2SSZ ligand shows sharp bands at 1618 and 1427 cm-1 assigned for asymmetric and symmetric stretching vibrations of the carboxylate moiety, respectively. These two bands are either slightly shifted to lower frequencies or remained decreased markedly in intensity. This indicates that the carboxylate group participated in complex formation with the metal ions. Participation of the phenolic and carboxylic OH groups is also confirmed by the appearance of new bands in the complexes in the 472–439 cm-1 regions which may be assigned to the ν (M-O) stretching vibration [35,38]. Coordination of the nitrate anion to the Ce(IV) and Th(IV) ions were also supported by the IR spectra of the nitrate complexes. The nitrato complexes of Ce (IV) and Th(IV) ions displayed three strong bands due to the nitrate group ν asym. (NO2) at 1500cm-1,νsym. (NO2) at 1270 cm-1 and ν (NO) at 987 cm-1 assigned to monodentate nitrate group. | |
| The interpretation data of Mg(II), Ca(II), Sr (II), and Ba(II) H3Suz complexes are not recorded absorption band at 1676 cm-1 which distinguished to the v(C=O) vibration of the carboxylic group in the free H3Suz ligand, that is meaning the involvement of the carboxylic group in the chelation with metal(II) ion [39]. The asymmetric stretching vibration of the carboxylate group, vas(COO−), which appears at 1600, 1596, 1589 and 1591 cm-1 for Mg(II), Ca(II), Sr(II), and Ba(II) H3Suz complexes, respectively, are absent in the spectrum data of the free H3Suz ligand. The infrared spectra of [Mg(HSuz)(H2O)4], [Ca(HSuz) (H2O)4], [Sr(HSuz)(H2O)4], and [Ba(HSuz)2(H2O)4] complexes have a weak intensity band in the 1354–1356 cm-1 range due to vs(COO−). This band was strong and appears at 1360 cm −1 in the spectrum of free H3Suz. The medium intensity band of v(C–O) appears at 1260, 1266, 1261 and 1269 cm-1 for the Mg (II), Ca(II), Sr(II), and Ba(II) H3Suz complexes, respectively, existed at 1272 cm-1 in the spectrum data of the free ligand with strong intensity. Deacon and Phillips [23] studied the criteria used to distinguish between the three chelating states of the carboxylate complexes. These criteria are summarized as: | |
| (i) v>200 cm-1 (where v=[vas(COO−vs(COO−)]), this relation applied in case of uni-dentate carboxylato complexes, (ii) bi-dentate or chelating carboxylato complexes, exhibit significantly smaller than ionic values (< 100 cm-1), and the third behavior is bridging carboxylato complexes show that comparable to ionic values v= ca. 150 cm-1. The observed Δv for all H3Suz complexes is >200 cm-1 which confirms a unidentate situation for the carboxylate group. A broad diffuse band with strong-to-medium strong intensity in the 3400–3450 cm-1region may be assigned to the OH stretching vibration for the coordinated water molecules in the H3Suz complexes. It is difficult to distinguish between the v(OH) of phenolic group of H3Suz and the stretching vibrational bands of water molecules because of the overlapping values and having located in one place. To ascertain the involvement of phenolic group in the coordination process, this requests to make a follow up of the stretching vibration bands of v(C–O) in all H3Suz complexes. This check shows that the v(C–O) was shifted to lower intensity and wavenumber from 1272 cm-1 in case of free ligand to 1260–1268 cm-1 in case of their complexes. This fact indicates that the phenolic group was existed in the complexation and the H3Suz ligand acts as bi-dentate. The lower shift of (OH) from 1392 cm-1 in the free H3Suz ligand to 1390–1388 cm-1 in their complexes is another factor interpretative that the involvement of OH phenolic group in the coordination process. | |
| UV/Vis Spectra | |
| Gliclazide complexes: The diffused reflectance spectrum of the Cr (III) chelate shows three absorption bands at 18,770 (v1), 27,450 (v2), and 28,360 cm-1 (v3) which are in reasonable agreement with those in the literature for octahedral Cr (III) complexes [40]. From the diffused reflectance spectrum it is observed that, the Fe (III) chelate exhibits a band at 22,090 cm-1, which may be assigned to the 6A1g → T2g(G) transition in octahedral geometry of the complexes [41]. The 6A1g →5T1g transition appears to be split into two bands at 16,960 and 15,450 cm-1. The spectrum shows also a band at 27,780 cm-1 which may be attributed to ligand to metal charge transfer. The diffused reflectance spectrum of the Mn(II) complex shows three bands at 15,675, 21,900 and 26,915 cm-1 assignable to 6A1g →4T1g, 6A1g -4T2g(G) and 6A1g →4T2g(D) transitions, respectively, which indicates the presence of Mn (II) complex in tetrahedral structure. | |
| The electronic spectrum of the Co (II) complex with the formula [Co(HL)Cl2(H2O)2] gives three bands at 14,990, 17,420 and 22,250 cm-1. The bands observed are assignedto the transitions 4T1g(F) →4T2g(F) (v1), 4T1g(F) →4A2g(F) (v2) and 4T1g(F) →4T2g(P) (v3), respectively, suggesting the presence of Co(II) complex in octahedral geometry. | |
| The region at 25,660 cm-1 refers to the charge transfer band. For Ni(II) complex; [Ni(HL)Cl2(H2O)2].2H2O, the electronic spectrum displays three bands at m1: 15,790 cm-1: 3A2g →3T2g; v2: 18,750 cm-1: 3A2g →3T1g(F) and v3: 22,245 cm-1: 3A2g →3T1g (P). The spectrum shows also a band at 25,047 cm-1 which may be attributedto ligand to metal charge transfer [42]. The reflectance spectrum of the Cu(II) chelate shows low intensity shoulder bands centered at 15,790 and 21,870 cm-1. Under the influence of the tetragonal distortion, the 3Eg and 3T2g states of the octahedral Cu (II) ion(d9) split such as to cause the three transitions 2B1g →2B2g; 2B1g →2Eg and 2B1g →2A1g remain unresolved in the spectra [43]. An intense peak observed at 25490 cm-1 is due to ligand to metal charge transfer transition. The Zn (II) complex is diamagnetic and tetrahedral geometry is proposed for this complex. | |
| Glimiperide complexes: The diffused reflectance spectrum of the Mn (II) complex [14] shows three bands at 24, 390, 22, 220 and 16,666 cm-1 which can be assignable to 4Eg(G) ←6A1g, 4T2g(G) ←6A1g and 4T1g(G) ←6A1g transitions, respectively suggesting an octahedral environment around the manganese ion. The electronic spectrum of the Co (II) complex with the formula (glim)2CO2H2O gives three bands at 14, 990, 17,420 and 22,250 cm-1. The bands observed are assigned to the transitions 4T1g(F) →4T2g(F) and 4T1g(F) →4A2g(F) fand 4T1g (F) →4T2g(P) respectively, suggesting the presence of Co(II) complex in octahedral geometry [44,45] The region at 25,660 cm-1 refers to the change transfer band. | |
| Sulfasalazine complexes: The UV-Vis spectra of sulfasalazine and their complexes in DMSO exhibit and detect peaks [22]. There are two absorption maxima peaks at ranges from 215– 340 nm and 350–500 nm, assigned to π–π* and n–π* transitions within the organic moiety of sulfasalazine ligand. The electronic absorption spectra of all H3Suz complexes show a bathchromic shift rather than free ligand within n–π* transition region. This shift is attributed to the place of complexation and the change in the electronic configuration for the H3Suz complexes formed. The electronic spectrum with respect to the Mn(II)/HSuz complex shows a weak absorption peak in the visible region probably due to spin-orbit forbidden transitions. | |
| HNMR Spectra | |
| Gliclazide complexes: The 1H–NMR of Gliclazide-metal complex [25] displayed nitrogen– metal signals in the range of δ 3.29–3.72 due to the deshielding of N-bearing protons. The 1H–NMR of gliclazide- Mg(II) complex displayed nitrogen – Mg signal at δ3.29,gliclazide- Ca(II) complex at δ3.32,gliclazide-Cr(II) complex at δ3.72, gliclazide- Mn(II) complex at δ3.50, gliclazide-Fe(II) complex at δ3.66,gliclazide- Ni(II) complex at δ3.70, gliclazide-Cu(II) complex at δ3.69, gliclazide- Zn (II) complex at δ3.68 and gliclazide-Cd(II) complex at δ 3.64 due to deshielding of N-bearing protons. In all these cases both the nitrogens of the amide took part in bonding to metals (Figure 9). | |
| Sulfasalazine complexes: The 1H-NMR spectra [22] presented the persuasive confirmation of the coordination modes. Thus, the 1H-NMR spectra of both VO(II)/HSuz and Y(III)/HSuz complexes on comparing with those of spectrum of the free sulfasalazine indicate that, H3Suz ligand acts as bidentate ligand through the phenolic OH group and carboxylic OH group. 1HNMR spectra of vanadyl(II) and yttrium(III) complexes were carried out in DMSO-d6 as a solvent, the data obtained are in agreement with the suggested coordination through the carboxylic and phenolic groups by absence of the signals of two protons which exist in the free ligand at about δ= 11.00 and 5.00 ppm, respectively and due to different chemical environments the signals of aromatic protons at 6.00–8.00 ppm are present with decreasing intensities. | |
| Thermal analysis | |
| Gliclazide complexes: In the present investigation [4], the weight losses for each chelate are calculated within the corresponding temperature ranges. [Cr(HL)Cl3(H2O)].3H2O complex is thermally decomposed in three decomposition steps within the temperature range of 50–700°C. The first decomposition step with an estimated mass loss of 9.38% (calc. 9.75%) within the temperature range 50–120°C may be attributed to the liberation of three water molecules of hydration. The activation energy of this dehydration step is found to be 32.90 kJ mol-1. The remaining decomposition steps were found within the temperature range 120–700°C with an estimated mass loss of 77.85% (calc. 76.46%) can be reasonably accounted for the removal of coordinated water, HCl, Cl2 and GLZ molecules as gases. The thermogram of [Fe(HL) | |
| Cl3(H2O)2].3H2O chelate shows that the first step of decomposition within the temperature range 30–2500C corresponds to the loss of hydrated and coordinated water molecules, Cl2 and HCl gases with a mass loss of 32.34% (calc. 32.17%). The subsequent steps (250–10000C) correspond to the removal of the GLZ ligand leaving metal oxide as a residue. The overall weight loss amounts to85.56% (calc. 85.84%). The TG curves of the Mn(II) and Ni(II)-chelates show four stages of decomposition within the temperature range of 30–1000 and 30–6000C, respectively. The stages at 30–2500C correspond to the loss of water molecules of hydration and coordination and anions. The energy of activation for these steps is calculated using Coats–Redfern method. The subsequent stages involve the loss of ligand molecules with an overall weight loss amounts to 84.45% (calc. 84.79%) and 85.88% (calc. 86.11%) for Mn(II) and Ni(II) complexes, respectively. The TG curves of the Co(II), Cu(II) and Zn(II) chelates represent two decomposition steps. The two decomposition steps occur within the temperature range from 100–800, 100–900 and 150–7000C and can be attributed to the loss of coordinated water, Cl3 and GLZ molecules with an estimated mass losses of 85.76% (84.59), 84.49% (calc. 83.90%) and 82.25% (calc. 82.36%) for Co(II), Cu(II) and Zn(II) complexes, respectively. The energy of activation for these decomposition steps. CoO, CuO and ZnO are the residues of decomposition. | |
| Glimepiride complexes: The TGA thermogram of the drug [17] showed 65.87% weight loss at 190.000C corresponding to its melting point these values were changed to 40.48% at 200.00°C, 63.57% at 266.18°C and 40.28% at 262.21°C, for B-CyD, HP-B-CyD and SBE-BCyD, respectively. This would indicate formation of more stable Complexes between glimepiride and each of these cyclodextrins compared to the drug as evidenced by the obvious decrease in percentage of weight loss and the elevation of the melting point of the drug. TGA shows that the complexes of glimepiride with the investigated cyclodextrins contained less water, in the range of 70– 1300C, compared to that of the corresponding physical mixtures. Water is present within the cavity of the cyclodextrin molecule to stabilize the ring structure. The decomposition temperature of the cyclodextrin was found to remain unchanged on complexation indicating that the integrity of the cyclodextrin ring is maintained. Hence, the decrease in water content of the complex, compared to the physical mixture, may result from glimepiride occupying the position of some of the water molecules associated with torus of the cyclodextrin [30]. | |
| Sulfasalazine complexes: It seemed of interest to evaluate the effect of heating on the thermal stability of the prepared complexes [22]. The results showed that the complexes lost its hydration water below 573 K. Within the temperature range 573–653 K the coordinated water molecules were liberated. The anhydrous complexes displayed the decomposition of the organic ligand within the temperature range673–1073 K leading to metal oxide. The metal contents were calculated from the residual contents and were found to be in good agreement with the results of elemental analysis. The sulfasalazine ligand melts at 552 K with simultaneous decomposition .The thermal decomposition of (H3SuZ) occurs completely in two steps which were observed at 552 and 1025 K corresponding to loss of C4H6N4SO3 and C2H8O2 (organic moiety) representing a weight loss (obs = 47.20%, calc=47.69) and (obs =16.50%, calc = 16.00), respectively, then leaving residual carbon as final fragment. [Mn(SuzH)(H2O)4]2H2O complex was thermally decomposed in four successive decomposition steps within the temperature range 313–1073 K. The first decomposition step (obs=6.69%, calc=6.44) within the temperature range 313–403 K, may be attributed to the liberation of the two hydrated water molecules. The second and third decomposition steps found within the temperature range 423–703 K (obs=12.43%, calc=12.88), (obs=13.82%, calc=13.77), | |
| which are reasonably accounted for by the removal of 4H2O and C2H7NO2 (organic moiety), respectively. The rest of sulfasalazine molecule was removed on the fourth step within the temperature range 713–1073 K (obs=39.60%, calc=39.18). The decomposition of the ligand molecule ended with a final oxide residue of MnO and contaminated with residual carbon (27.23%, mass=154.93). The TG curve of [Hg(SuzH)(H2O)2]4H2O complex indicates that the mass change begins at 367 K and continues up to 1053 K. The first mass loss corresponds to the liberation of the four hydrated water molecules (obs=10.80%, calc=10.21). The second decomposition step occurs in the range 463–653 K and corresponds to the loss of 2H2O + C6H8N2SO2 (organic moiety) (obs=29.12%, calc=29.50). The final decomposition step occurs in the range 673–1073 K and corresponds to the loss of C4H4N2O2 (organic moiety) (obs=29.12%, calc=29.50). DTG profile shows three endothermic peaks. The first at 367 K corresponds to the melting of the complex, while the second at 527 K corresponds to the dehydration and decomposition of the complex. The third broad endothermic peak corresponds to the final decomposition of the organic ligand to the HgO + residual carbon atoms. [Cr(SuzH)(Cl)(H2O)3]5H2O was thermally decomposed in five successive decomposition steps within the temperature range 323–1073 K. The first decomposition step (obs= 7.39%, calc=7.17) within the temperature range, 323–423 K, may be attributed to the liberation oftwo and half hydrated water molecules. The second and third decomposition steps found within the temperature range443–813 K (obs = 15.69%, calc=15.77), (obs=6.45%, calc=6.85), are reasonably accounted for by the removal of 5.5H2O and C2H5N (organic moiety), respectively. The rest of sulfasalazine molecule was removed on the fourth and fifth steps within the temperature range833–1073 K and corresponds to the loss of C2H4N and C5H3N2SO3.5Cl (organic moiety) (obs=6.56%, calc=6.69), (obs=33.86%, calc=34.18), respectively. The decomposition of the ligand molecule ended with a final oxide residue of CrO1.5 + contaminated carbon atoms. [ZrO(SuzH)(H2O)2]8H2O complex is thermally stable up to323 K and decomposition beyond this temperature is indicated by the first loss step in the TG curve. The mass loss at 323 K corresponds to the loss of 2H2O (obs=5.67%, calc=5.26). Continuous mass loss in the TG curve beyond 333 K, 373 K, 433 K and 616 K, corresponds to the loss of 8H2O + NO. The rest of sulfasalazine molecule was removed on the six and seven steps within the temperature range723–1073 K corresponding to the loss of N2 + 3H2 and 0.5N2 + 3H2 (obs=4.39%, calc=4.97), (obs=2.29%, calc=2.92), respectively. The DTG profile shows four endothermic peaks. The first and second peaks at 318, 373 K corresponds to the dehydration of the complex, while the third and fourth at 755, 1028 K corresponds to the final decomposition of the organic ligand to the ZrOSO4+carbon atoms residue. The complex [VO(SuzH)(H2O)2]6H2O is thermally stable up to 306 K and undergoes decomposition beyond this temperature, as indicated by the first mass loss step in the TG curve. The mass loss at 383 K corresponds to elimination of H2O molecule (obs=2.50%, calc=2.96). Beyond 383 K continuous mass loss in the TG curve has been observed up to 563 K which corresponds to elimination of the remaining H2O molecules and C2H2O (organic moiety) (obs=27.49%, calc=27.66). After this decomposition, the mass loss at 563–1073 K corresponds to removal of the rest of sulfasalazine molecule. The DTG profile shows two endothermic and two broad exothermic peaks at 534, 560, 709 and 812 K. The first and the second endothermic peaks appear at 534 and 560 K corresponding to the dehydration of the complex, while the third and fourth exothermic peaks appear at 709 and 812 K corresponding to the decomposition of the organic ligand to the VO2(obs=13.78%, calc=13.66). The complex [Y(SuzH)(Cl)(H2O)3]6H2O is thermally stable up to 306 K and undergoes decomposition beyond this temperature, as indicated by the first mass loss step in the TG curve. The mass loss at 368 K corresponds to elimination of 2.5 H2O molecules (obs=6.40%, calc=6.59). Beyond 368 K continuous mass loss in the TG curve has been observed up to 563 K which corresponds to removal of the remaining H2O molecules and C2H2 (organic moiety) (obs=21.59%, calc=20.94). After this decomposition, the mass loss at 593–1073 K corresponds to decomposition of the rest of sulfasalazine molecule. The DTG profile shows two exothermic peaks at 616 and 716 K. The first exothermic peak appears at 616 K correspond-ing to the elimination of C5H4N2SCl (organic moiety) (obs=23.85%, calc=23.37), while the second peak appears at 716 K corresponding to the decomposition of the organic ligand to the YO1.5 (obs=16.57%, calc=16.54). | |
References
- Bal Krishan Sharma, Vibha Agrawal and S.A. Iqbal (2012) International Journal of Theoretical & Applied Science 4: 164-169.
- Bloomgarden, Z.N (1999) American Diabetes Association Consensus Statement on Pharmacologic treatment, Diabetes Care, 22 SIS 117.
- Parvez M1, Arayne MS, Zaman MK, Sultana N (1999) Gliclazide. Acta Crystallogr C 55 : 74-75.
- Gehad G. Mohamed, Sayed M. Abdallah, M.M.I. Nassar, M.A. Zayed, (2009) Arabian Journal of Cemistry 2: 109-117.
- Mohamed G.G, Abd El-Wahab, Z.H (2003) J. Therm. Anal. And Cal. 73: 347.
- Raman, N., Kulandaisamy, A.,Jeyasubramanian, K (2001) Synt. React. Inorg. Met. Org. Chem . 31: 1249.
- Kolwalkar, S.D, Mehta B.H (1996) Asian J. Chem. 8: 406.
- Biswal S1, Sahoo J, Murthy PN (2009) Physicochemical properties of solid dispersions of gliclazide in polyvinylpyrrolidone K90. AAPS PharmSciTech 10: 329-334.
- Desai KHG, Kulkarni AR, Aminabhavi TM (2003) Solubility of rofecoxib in presence of methanol, ethanol and sodium lauryl sulfate at (298,15, 303,15, and 308. 15) K . J Chem Eng Data. 48: 942-945.
- Aggarwal S1, Singh PN, Mishra B (2002) Studies on solubility and hypoglycemic activity of gliclazide beta-cyclodextrin-hydroxypropylmethylcellulose complexes. Pharmazie 57: 191-193.
- Palmer KJ1, Brogden RN (1993) Gliclazide. An update of its pharmacological properties and therapeutic efficacy in non-insulin-dependent diabetes mellitus. Drugs 46: 92-125.
- Luna B1, Feinglos MN (2001) Oral agents in the management of type 2 diabetes mellitus. Am Fam Physician 63: 1747-1756.
- G. Bansal, M. Singh , K.C. Jindal, S, Singh, (2008) J.Liq. Chromatogr. Rel. Tech. 31: 2174-2193.
- S.A. Iqbal, Sibi Jose and George Jacob (2011) Oriental Journal of Chemistry 27 : 731-735.
- Salil Sharma, S.A. Iqbal and Mamta Bhattacharya (2009), Orient. J. Chem; 25: 1101-1104.
- Shirse Prabhakar, (2012), IJRAP, 3(3); 465-470.
- Ammar HO1, Salama HA, Ghorab M, Mahmoud AA (2006) Formulation and biological evaluation of glimepiride-cyclodextrin-polymer systems. Int J Pharm 309: 129-138.
- Soliman AA (2006) Spectral and thermal study of the ternary complexes of nickel with sulfasalazine and some amino acids. Spectrochim Acta A Mol Biomol Spectrosc 65: 1180-1185.
- C. Sharaby, (2005), Synth, React, Inorg. Met. Org. Chem. 35; 133.
- W.M. Hosny, (1999), Synth, React, Inorg. Met. -Org. Chem. 29; 361.
- Soliman MH1, Mohamed GG (2013) Cr(III), Mn(II), Fe(III), Co(II), Ni(II), Cu(II) and Zn(II) new complexes of 5-aminosalicylic acid: spectroscopic, thermal characterization and biological activity studies. Spectrochim Acta A Mol Biomol Spectrosc 107: 8-15.
- M G Abd El-Wahed, M S Refat and S M El-Megharbel, (2009), Bull Mater Sci, Indian Academy of sciences, 32: 205-214.
- Dacon G B and Philips R J 1980 Coord, Chem, Rev, 33, 227.
- Bell CM1, Habal FM (1997) Safety of topical 5-aminosalicylic acid in pregnancy. Am J Gastroenterol 92: 2201-2202.
- Arayne MS1, Sultana N, Zaman MK, Farooq A (2005) Synthesis and characterization of gliclazide complexes of magnesium, calcium, chromium, manganese, iron, nickel, copper, zinc and cadmium salts. Pak J Pharm Sci 18: 35-40.
- Ozkan Y1, Atay T, Dikmen N, IÅŸimer A, Aboul-Enein HY (2000) Improvement of water solubility and in vitro dissolution rate of gliclazide by complexation with beta-cyclodextrin. Pharm Acta Helv 74: 365-370.
- Van den Mooter G, Augustijns P, Blaton N, Kinget R. Physicochemical characterization of solid dispersions of temazepam with polyethylene glycol 6000 and PVP K30. (1998) Int J Pharm 164: 67–80.
- Sharma GS, Srikanth MV, Sunil SA, Sreenivasa Rao N, Ramana Murthy KV, (2011) RJPBCS ; 2: 814-823.
- Winters CS, York P, Timmins P, Solid state examination of a gliclazide:beta-cyclodextrin complex. (1997). Eur. J. Pharm. Sci. 5: 209–214.
- Ozkan Y1, Atay T, Dikmen N, IÅŸimer A, Aboul-Enein HY (2000) Improvement of water solubility and in vitro dissolution rate of gliclazide by complexation with beta-cyclodextrin. Pharm Acta Helv 74: 365-370.
- Fernandes CM1, Teresa Vieira M, Veiga FJ (2002) Physicochemical characterization and in vitro dissolution behavior of nicardipine-cyclodextrins inclusion compounds. Eur J Pharm Sci 15: 79-88.
- Jug M1, Bećirević-Laćan M (2004) Influence of hydroxypropyl-beta-cyclodextrin complexation on piroxicam release from buccoadhesive tablets. Eur J Pharm Sci 21: 251-260.
- Reven S1, Grdadolnik J, Kristl J, Zagar E (2010) Hyperbranched poly(esteramides) as solubility enhancers for poorly water-soluble drug glimepiride. Int J Pharm 396: 119-126.
- Mohamed GG1, Soliman AA, El-Mawgood MA (2005) Structural and thermal characterization of cerium, thorium and uranyl complexes of sulfasalazine. Spectrochim Acta A Mol Biomol Spectrosc 62: 1095-1101.
- Zayed MA1, Nour El-Dien FA, Mohamed GG, El-Gamel NE (2004) Structure investigation, spectral, thermal, X-ray and mass characterization of piroxicam and its metal complexes. Spectrochim Acta A Mol Biomol Spectrosc 60: 2843-2852.
- Mohamed GG1, El-Gamel NE (2004) Synthesis, investigation and spectroscopic characterization of piroxicam ternary complexes of Fe(II), Fe(III), Co(II), Ni(II), Cu(II) and Zn(II) with glycine and DL-phenylalanine. Spectrochim Acta A Mol Biomol Spectrosc 60: 3141-3154.
- Mohamed GG, Zayed MA, El-Dien FA, El-Nahas RG (2004) IR, UV-Vis, magnetic and thermal characterization of chelates of some catecholamines and 4-aminoantipyrine with Fe(III) and Cu(II). Spectrochim Acta A Mol Biomol Spectrosc 60: 1775-1781.
- E. Santi, M.H. Torre, E. Kremer, S.B. Etcheverry, E. Baran, (1993) Vib. Spectrosc. 5: 285.
- Refat MS1, Mohamed SF (2011) Spectroscopic, thermal and antitumor investigations of sulfasalazine drug in situ complexation with alkaline earth metal ions. Spectrochim Acta A Mol Biomol Spectrosc 82: 108-117.
- Cotton FA, Wilkinson G, Murillo CA, Bochmann M, (1999) Advanced Inorganic Chemistry, sixth ed. Wiley, New York.
- Rosenberg B, Lippert B, Cisplatin (1999) Chemistry and Biochemistry of a Leading Anticancer Drug. Verlag Chemie VCH, Basel 3.
- Zayed, MA, Nour El-Dien FA, Mohamed, Gehad G, El-Gamel, Nadia EA (2007) J. Mol. Struct 41: 841.
- Manonmani J, Thirumurugan R, Kandaswamy M, Kuppayee M, Raj S S S, Ponnuswamy M N, Shanmugam G, Fun H K, 2000. Polyhedron 19, 2011.
- R.K. Agrawal, I. Chakraborti and N.K. Sharma (2003) Orient. J. Chem., 19, 95.
- M.C. Patel and A.D. Shah (2001) Orient. J. Chem., 40: 1166.
Figures at a glance
 |
 |
 |
 |
 |
||||
| Figure 1 | Figure 2 | Figure 3 | Figure 4 | Figure 5 |
 |
 |
 |
 |
|||
| Figure 6 | Figure 7 | Figure 8 | Figure 9 |
Relevant Topics
- Advanced Therapies
- Chicken Pox
- Ciprofloxacin
- Colon Infection
- Conjunctivitis
- Herpes Virus
- HIV and AIDS Research
- Human Papilloma Virus
- Infection
- Infection in Blood
- Infections Prevention
- Infectious Diseases in Children
- Influenza
- Liver Diseases
- Respiratory Tract Infections
- T Cell Lymphomatic Virus
- Treatment for Infectious Diseases
- Viral Encephalitis
- Yeast Infection
Recommended Journals
Article Tools
Article Usage
- Total views: 14368
- [From(publication date):
April-2014 - Apr 26, 2025] - Breakdown by view type
- HTML page views : 9775
- PDF downloads : 4593
