Research Article Open Access
Organised Surfactants Assemblies and Spectrophotometry: Application to The Analysis of Palladium (II) in Different Matrices
Mostafa MM, Akl MA* and Elbadrawy ZDepartment of Chemistry, Faculty of Science, Mansoura University, Mansoura Egypt
- *Corresponding Author:
- Prof. Magda Akl
Department of Chemistry
Faculty of Science
Mansoura University,
Mansoura Egypt
Tel: 002 0502217833
E-mail: magdaakl@yahoo.com
Received date: August 19, 2014; Accepted date: September 25, 2014; Published date: September 29, 2014
Citation: Mostafa MM, Akl MA, Elbadrawy Z (2014) Organised Surfactants Assemblies and Spectrophotometry: Application to The Analysis of Palladium (II) in Different Matrices. J Anal Bioanal Tech 5:208 doi: 10.4172/2155-9872.1000208
Copyright: © 2014 Mostafa MM, et al. This is an open-access article distributed under the terms of the Creative Commons Attribution License, which permits unrestricted use, distribution, and reproduction in any medium, provided the original author and source are credited.
Visit for more related articles at Journal of Analytical & Bioanalytical Techniques
Abstract
In this study, the use of organised surfactants assemblies to enhance the spectrophtometric determination of palladium in environmental samples is thoroughly investigated. Phenanthraquinone monophenyl thiosemicarbazone (PPT), an exceptional color-forming chelating agent, combines to Pd (II) to form a slightly soluble complex in aqueous solution. To determine this metal ion, a tedious and inefficient separation technique, such as liquid–liquid extraction, has to be achieved. However, the Pd (II)-PPT complex could be determined suitably by ultraviolet-visible (UVVis) spectrophotometry at 520 nm in a Tween 80 micellar medium that has polyoxyethylene groups. After conditions, such as the pH, the concentration of PPT and the stability, were adjusted to their ideal values, the sensitivities of the Pd (II) ions in the Tween 80 micellar medium and in chloroform were compared. The sensitivity of Pd (II) in the Tween 80 micellar medium was higher than in chloroform. The interferences from different cations and anions were studied. Beer’s law was obeyed over a concentration range of 0.1-1.0 mg L–1. The detection limit of Pd (II) is 0.01 mg L–1. The recovery yields of palladium (II) in the synthetic mixtures and water samples ranged from 98 to 100% with a relative standard deviation (RSD%) less than 1.0%. The proposed method was successfully applied to the determination of palladium in certified reference samples, synthetic mixtures and in environmental water samples. This proposed technique is simple, convenient and speedy.
Keywords
Palladium; Spectrophotometry; Tween 80; Natural waters; Micellization
Introduction
Amphiphilic molecules (i.e. molecules possessing both hydrophobic and hydrophilic regions) such as surfactants exhibit some fascinating features because of their tendency to self-association in water and / or apolar solvents. The final structure of the microscopically-ordered molecular aggregates formed (aqueous and reverse micelles, bilayers, microemulsions and vesicles) is determined by the nature of the surfactant monomer, the nature of the solvent and also by other possible surrounding ions. These surfactant aggregates constitute ‘ordered’ media because they mimic the organisational ability of membranes by bringing reactants together in highly structured specific microenvironments [1-3].
Among the existing surfactant-based organised assemblies micelles and vesicles are possibly the most interesting and investigated organised media in analytical chemistry. Micelles are microscopically organised chemical assemblies formed by self-aggregation of individual surfactant molecules. These molecules exist as monomers in very dilute solutions, but when their concentration exceeds a certain minimum the so-called “Critical Micellar Concentration”, CMC, of the surfactant), the monomers associate spontaneously forming aggregates of colloidal dimensions termed micelles. As the surfactant concentration increases above the CMC, the addition of fresh monomer results in the formation of new micelles in such a way that the monomer concentration in solution remains essentially constant and approximately equal to the CMC. That is, the micelles are in a dynamic equilibrium with the dissolved monomers of the surfactant which remain at an approximately constant concentration after the CMC has been reached.
Micellar systems are convenient to use because they are optically transparent, readily available, and stable [4]. Generally, micelles have non-polar tail groups directed inward to form the non-polar core and polar head groups lain on the outside of the structure. So, non-polar compounds, such as organic molecules or non-ionic complexes as well as weak polar molecules that are slightly dissolvable in water are very soluble in the non-polar core of micellar medium. The micelle has nonpolar and polar environments in microscopic scale and is heterogeneous. But, in macroscopic scale it appears to be homogeneous [5].
Surfactant micelles are capable of solubilizing species of various sizes and polarities. With the solubilization property of non-polar compound in micelles, many analytical techniques have been developed and modified [6-11]. Although there are several methods by UV-Vis spectrophotometry [12-16], micelle has been mainly used to enhance the sensitivities of molecular fluorescence and room temperature phosphorescence [17-20].
Palladium has extensive use in alloys, catalysts and in low voltage electrical contacts. It is an efficient catalyst that is commonly used for hydrogenation and dehydrogenation reactions. The palladium content of earth crust is 0.01-0.021 g mL–1 owing to corrosion resistance nature and it exists in various natural minerals, soil and rocks. Palladium and its alloys have wide range of application in both the chemical industries and instrument making. It is used in jewelry, dentistry applications, fine instruments, such as watches and some surgical tools for the purification of hydrogen gas [21]. The direct determination of palladium in various environmental samples with different instrumental methods is not so easy because of the low concentration levels of trace amounts in different environmental samples. The Azo dyes with the heterocyclic diazo-component form colored complexes with many metal ions in solution [22]. Several analytical techniques have reported for the determination of trace elements in natural water like ICP-AES, ICPMS, ETAAS, GFAAS, NAA, and CE which are very expensive and in addition to that direct determination of trace metal ions by following methods is not sufficiently sensitive. So, many spectrophotometric methods have been developed for the determination of palladium [23].
Phenanthraquinone monophenyl thiosemicarbazone (PPT) combines with numerous metal ions [24] such as nickel, zinc, copper, cadmium, lead and so forth, to form colored metal complexes. While this chelating agent has been used to determine some metal ions by ultraviolet-visible (UV-Vis) spectrophotometry, [25-28] these metal- PPT complexes do not dissolve in aqueous solution. So it is needed to realize a solvent extraction. These complexes can be extracted with chloroform, which was found to be carcinogenic [29] and was later banned by Food and Drug Management from use in drug, cosmetic, and food packaging products [30].
Phenanthraquinone monophenyl thiosemicarbazone (PPT) has been rarely used for the spectrophotometric determination of palladium (II) in the presence of non-ionic surfactants.
In the present study, a non-ionic surfactant, polyoxyethylene sorbitan monooleate (Tween 80), is used to determine the Pd (II)- PPT complex spectrophotometrically since Pd(II) was chelated with PPT. The method is based on the reaction of PPT in Tween 80 micellar solution with palladium (II) to produce a highly absorbent brownish-violet chelate product, followed by direct measurement of the absorbance in the Tween 80 solution. With suitable masking, the reaction can be made highly selective for palladium. Tween-series surfactants are more soluble in aqueous solution than any other nonionic surfactants and have polyoxyethylene chains in which the metal complex can be well solubilized. Among Tween-series surfactants, it was empirically noticed for Tween 80 to be less foamed.
The proposed method keeps different advantages over present methods with respect to sensitivity, selectivity, range of determination, simplicity, stability, accuracy, precision, and ease of process.
Experimental
Reagents and solutions
All chemicals used were of analytical-reagent grade. Doubly distilled water (DDW) was used through. Palladium stock solutions were prepared by dissolving 1 g PdCl2 (Merck) in 3 ml HCl followed by dilution to 250 ml using doubly distilled water or ethanol. For the analysis of simulated ores, a Pd stock solution was prepared by dissolving 1 g of Pd wire in few milliliters of conc. HNO3 followed by dilution with doubly distilled water to 250 ml. The final concentration of Pd(II) was standardized using an atomic-absorption spectrometer.
A three percent (w:v) Tween 80 solution was made in which Tween 80 weighing 3.0 g was dissolved in a 100-ml volumetric flask and diluted to the mark with DDW.
The ionic strength of sample solutions was kept constant at 0.1 mol l–1 using 1 M KNO3.
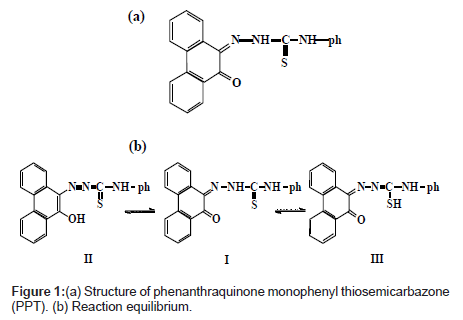
Phenanthraquinone monophonyl thiosemicarbazone, PPT (Figure 1a) was synthesized as previously reported [24]. Its stock solution was prepared in acetone.
Instrumentation
The concentration of Pd(II) was determined using a Unicam UV 2100 UV/Vis spectrophotometer and was confirmed by atomic absorption spectrometric (AAS) measurements at 247.6 nm with a Perkin-Elmer 2380 atomic absorption spectrometer. The pH values of solutions were adjusted using a Hanna Instrument 8519 digital pH meter with 3.0 M - 0.5 M HCl in the acidic range and with 0.5 M NaOH in the basic range.
Analytical procedures
Solubility of PPT in Tween 80 medium: PPT weighing 75 mg was transferred to each of nine 50 ml volumetric flasks and dissolved to saturation in a 2.0-10.0% Tween 80 solution by stirring it vigorously. Then, 0.2 ml aliquots of these saturated PPT solutions were transferred to 10 ml volumetric flasks, and 1 ml of acetone was added to each flask; each flask was then filled to the mark with an appropriate concentration of Tween 80 solution. The absorbance of these solutions was measured and from these data, the solubility of PPT in Tween 80 medium was studied.
Spectrophotometric determination of Pd(II)-PPT in Tween 80 medium: After 0.5 ppm of palladium(II) was transferred into a 25 ml calibrated flask and adjusted to pH 3.5, 2 ml of 4% Tween 80 solution and 3 ml of 5 μg ml–1 PPT, were added. The solution was diluted to the mark with DDW and mixed well. The absorbance of the colored solution was measured at 520 nm in a 1 cm cell against a reagent blank.
Results and Discussion
Solubility and absorption spectra of PPT in a Tween 80 solution
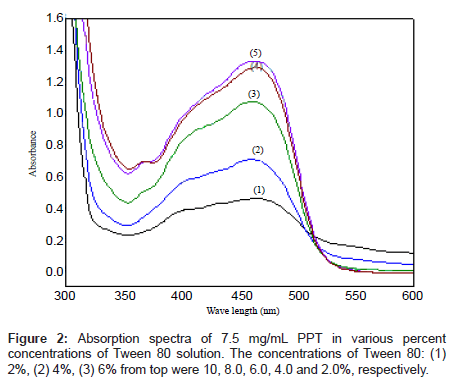
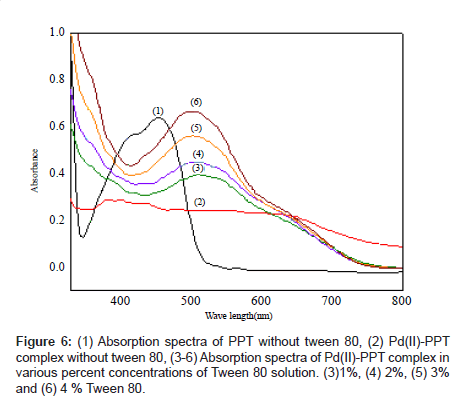
The absorption spectra of PPT saturated in different percent concentrations of Tween 80 solution are shown in Figures 1b and 2. As it can be observed, the absorption spectrum of the reagent PPT in Tween 80 is characterized by the presence of two maxima at 410 and 450 nm (Figure 2), which may be attributed to the presence of keto-enol or thioenol equilibria [24], Figure 1b [25]. It was found that PPT was quantitatively dissolved in Tween 80 micellar solution. Commonly, the solubilizate is not, or little, dissolved in micelle until the critical micelle concentration (cmc) is obtained. The micelle of a non-ionic surfactant with a polyoxyethylene group includes two parts. One is the hydrocarbon tail directed to the interior core of the micelle and the other part is the hydrated polyoxyethylene group located at the outside sphere. Organic compounds and metal chelates that have large attraction power to the polyoxy ethylene group may be combined into this area [31]. PPT could be dissolved by this phenomenon, because this species has a hydroxyl group that interacts with the ether oxygen of polyoxyethylene group by hydrogen bonding. It appears that micelle in solution was formed because 5% Tween 80 solution was above the CMC (0.0013%, w:v) [32]. It is, also, shown from Figure 2, that the solubility of PPT increased in proportion to the percent concentration of the Tween 80 solution.
Effect of experimental variables
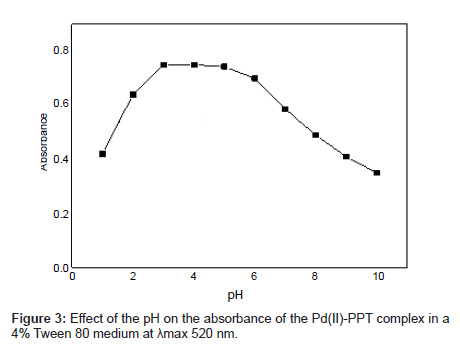
Effect of the pH: The effect of the pH on the absorbance of the Pd(II)-PPT complex in a 4% Tween 80 medium was considered over the range 2 – 9. The optimum pH value was determined by comparing the absorbances at various pH values. The pH range where Pd(II)-PPT complex had its maximum absorbance in the 4% Tween 80 solution is shown in Figure 3. The Pd(II)-PPT complex had the maximum and constant absorbance through the pH range of 3-5. The data in Figure 3 shows that a maximum and constant absorbance of the analyte is achieved over a wide range of pH. The direct addition of the reactants acquires the solution pH=3.5. Accordingly, pH 3.5 is selected as a suitable value to facilitate the proposed afford due to the progress in this experimental investigation. Subsequent experiments were performed at pH 3.5.
Effect of the concentration of PPT
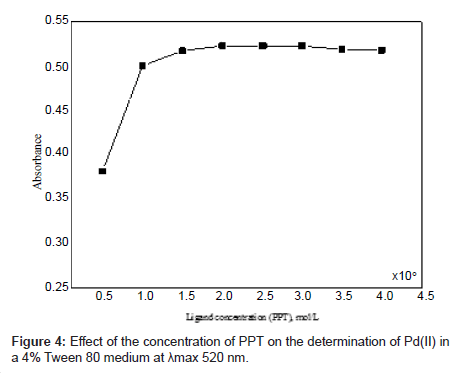
Different molar excesses of PPT were added to a fixed Pd(II) concentration, and the absorbance was measured according to the standard procedure. It was observed that at 1 × 10⁻⁵ mol l–1 of Pd(II), the reagent molar ratio of [Pd]: [PPT] ≈ 1:2 produced a constant absorbance of the Pd(II)-PPT chelate (Figure 4). Addition of excess ligand has no deleterious effects on the analysis of Pd(II).
Effect of temperature
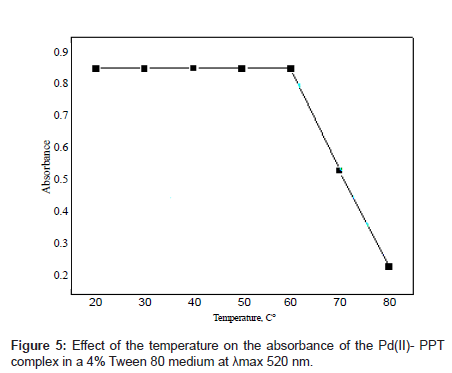
The effect of temperature on the absorbance of the Pd(II)-PPT complex in the Tween 80 medium is shown in Figure 5. As it can be seen that the Pd(II)-PPT complex had its maximum absorbance in the temperature range of 25-60°C, but released slowly with an increase in temperature above 60°C. This behavior can be explained as follows: the present technique is based on a property of most non-ionic surfactants this temperature, the micellar solution loses its homogenous nature and separates in a surfactant-rich phase in which the surfactant concentration is closed to the critical micellar concentration. This phenomenon, which is mainly observable with polyoxyethylene surfactants, can be attributed to the ethyl oxide segments in the micelle, which resist each other at low temperature and attract each other at high temperatures [33].
Effect of foreign ions: The interfering effects of some diverse ions on the determination of 0.5 μg/ml Palladium (II) were studied. The results are shown in Table 1. An ion was considered to interfere in the determination if the absorbance observed differed by more than ± 2% from that of Palladium (II) alone. The results presented in Table 1 indicate that many metal ions and anions do not interfere in the determination of Palladium (II). However, Cu (II), Fe (III), Mo (VI) interferes seriously as they readily form coloured species with PPT. The tolerance limit of Cu (II), Fe (III), and Mo (VI) were enhanced by using masking agents of fluoride, phosphate and tartarate.
| Ion Added | Tolerance Limit (µg/ml) | R% | Ion Added | Tolerance Limit (µg/ml) | R% |
|---|---|---|---|---|---|
| Sulphate | 576 | 100 | Zr+4 | 200.69 | 100 |
| Urea | 600 | 100 | Zn+2 | 19.61 | 100 |
| Thiocyanide | 2.3 | 99 | Bi+3 | 41.79 | 100 |
| Bromide | 800 | 99.8 | Ni+2 | 20 | 69.7 |
| Thiourea | 0.2 | 100 | Ce+4 | 2.80 | 9.5 |
| Nitrate | 1550 | 100 | Fe+3 | 1.11 | 100 |
| Tetra borate | 98 | 100 | Cu+2 | 1.27 | 99.8 |
| Acetate | 118 | 100 | Ru+3 | 1.01 | 100 |
| Phosphate | 189.94 | 99.5 | Ag+ | 2.15 | 80 |
| Chlorides | 213 | 99.2 | Pt+4 | 2.85 | 100 |
| Tartarate | 500 | 98.8 | Sb+2 | 390 | 100 |
| Citrate | 189.22 | 100 | Sr2+ | 26.28 | 100 |
| Fluoride | 475 | 100 | Se+4 | 23.66 | 100 |
| Oxalate | 264 | 100 | V+5 | 5.09 | 100 |
| Thiosulphate | 224 | 99.6 | Os+8 | 19.02 | 100 |
| U+6 | 142.84 | 100 | Cd+2 | 202.3 | 100 |
| Sn+2 | 3.56 | 100 | Sr+2 | 219.05 | 100 |
| La+3 | 138.9 | 100 | Mn+2 | 82.39 | 100 |
| Pb+2 | 41.44 | 100 | Mg+2 | 53.46 | 99.8 |
| Na+ | 23 | 100 | Se+4 | 78.96 | 100 |
| Hg+2 | 20.09 | 100 | Co+2 | 70.071 | 100 |
| Ba+2 | 205.99 | 99.8 | Al +3 | 40.47 | 100 |
| W+6 | 9.19 | 99.8 | Mo+6 | 0.954 | 100 |
Table 1: Tolerance limits of diverse ions in the determination of 0.5 μg/ml Palladium (II).
Characterization of Pd (II)-PPT complex
Absorption spectra of Pd(II)-PPT complex in 2.5% Tween 80 solution and chloroform: The absorption spectra of Pd(II)-PPT complexes in 2.5% Tween 80 and in chloroform were compared. After 5 ml of 2 × 10⁻⁵ mol l-1 buffered palladium solution was transferred to a 10 ml volumetric flask and 5 ml of 5% Tween 80 solution saturated with complexing agent was added, the absorption spectrum of Pd(II)-PPT complex was obtained. After 5 μg of PPT dissolved in 10 ml chloroform was added to 100 ml of 0.5 μg ml-1 palladium solution in a 250 ml separatory funnel, the Pd (II)-PPT complex was extracted and was extracted again by 10 ml chloroform. Then the absorption spectrum in chloroform was obtained. The maximum absorption wavelengths and the molar absorptivities of absorption spectra of PPT complexes of Pd(II) in 2.5% Tween 80 solution and in chloroform are presented in Table 2. It was also shown that the sensitivity of Pd(II) in Tween 80 medium was higher than in chloroform
| pH | λmax (nm) | emax, (mol–1 cm–1) | |
|---|---|---|---|
| In Tween 80 micelles | 3.5 | 520 | 720 × 104 |
| In chloroform | 3.5 | 520 | 6.4 × 10⁴ |
Table 2: Characteristics of absorption spectra of Pd(II)-PPT complex in 2.5% Tween 80 micelle and in chloroform.
Absorption spectra of Pd (II)-PPT complex in a 4% Tween 80 solution: The absorption spectra of the ligand PPT and its complex with Pd(II) in Tween 80 are shown in Figure 6 (curves b, f). It is evident that the maximum absorption of the free ligand is at 450 nm and that of the complex is at 520 nm with a difference of 70 nm.
Stability of PPT and Pd (II)-PPT complex in a 4% Tween 80 solution: To study the stability of PPT in Tween 80 solution, right after the concentration of PPT in a 4% Tween 80 solution was made to 0.5 mg l–1, the absorbance was measured as a function of time. Then, to measure the stability of the Pd(II)-PPT complex in Tween 80, the 5 ml of PPT saturated in 5% Tween 80 was added to 5 ml of 0.5 mg l–1 metal solution buffered at optimum pH. At once, the absorbance was measured as a function of time. The obtained results indicated that PPT and Pd(II)-PPT were observed to be stable in the Tween 80 medium for more than 24 h.
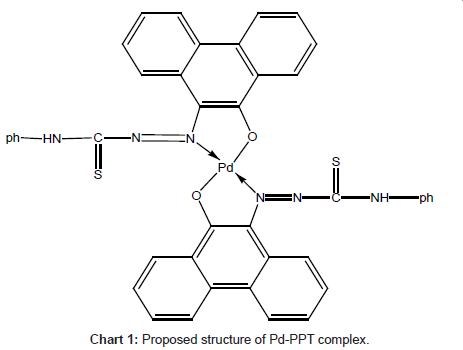
Infra-red spectral studies: Palladium (II) reacts with the PPT to form 1:2 complex in aqueous solution (Chart 2).
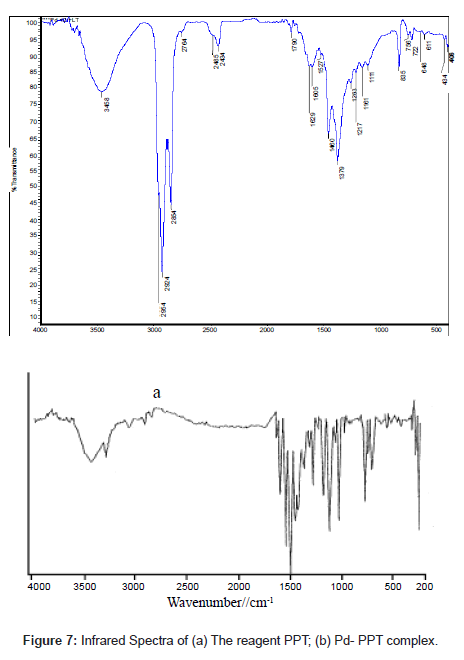
The infrared spectrum of PPT (Figure 7a) had bands at1680 and 1630 cm-1 that were assigned to �?(C=O) and �?(C=N), bands at 790 and 1240 cm-1 assigned to �?(C=S) and the combination of �?(C=S) with (C=N) [34], bands at 3290 and 3080 assigned to �?(N=N) stretching vibrations and bands at 3450-3500 cm-1 (such bands indicate the enolization of C=O group in the phenanthraquinone moiety to C-OH group)
Careful comparison of the infrared spectra of PPT and Pd(II)- PPT complex (Figures 7a and 7b) revealed that PPT acts as a bidentate ligand in the thione form coordinating via N=N and enolic carbonyl oxygen with the displacement of hydrogen atom from the latter group. This mode of chelation is supported by the following findings: i) the disappearance of ν(C-OH), ν(C=O) and ν(C=N) bands; ii) the appearance of new bands at 1527 cm-1 and 1250 cm-1 assignable to ν(N=N) [35] and ν(C-O) [36], respectively, iii) the appearance of new bands at 531 cm-1 and 434 cm-1 assignable to the (Pd-O) and (Pd-N), respectively [37], iv) the bands assigned to ν(C=S) remain more or less at the same position at 835 cm-1. From these results, the following structure is proposed for the Pd-(PPT-H)2 complex [Chart 1].
Analytical figures of merit
A calibration curve was constructed according to the general procedure. Beer’s law was obeyed in the range of 0.1 – 1.0 mg L–1 of palladium solution at 520 nm. The detection limit were found to and 0.01mg L–1. Five repeated analyses of a 1.0 mg L–1 palladium solution following the general procedure gave a relative standard deviation (RSD) of 0.64%. The absorption spectra of Pd(II)-PPT complexes in 4% Tween 80 and in chloroform were compared. The molar absorptivities of the Pd(II)-PPT complex, at λmax 520 nm, in a 4% Tween 80 solution and in chloroform were 720 × 104 and 6.4 × 10⁴ l mol–1 cm–1, respectively. As it can be noticed, the sensitivity of Pd(II) in Tween 80 medium is higher than that in chloroform. The composition ratio of the Pd(II)- PPT complex obtained using Job’s method was 1:2.
Mechanism of formation of Pd(II)-PPT complex in Tween 80
The expected formation mechanism of Pd(II)-PPT complex in Tween 80 medium could be explained by considering the fact that the dissolution process is dynamic. It seems that PPT dissolved in micelle, combines with Pd(II) ions to form non-polar complex that was instantaneously extracted into the local non-polar environment of micelle. This is the advantage of this method over liquid–liquid extraction that needs more time.
Analytical applications
The present method was applied successfully to the determination of palladium in a series of synthetic mixtures (Table 3) and in a simulated silver alloy sample (Table 4). The method was also extended to the determination of palladium in natural water samples (Table 5).
| Synthetic mixtures, (µg ml-1) | Palladium(II) (µg ml-1) | Recovery, (R %) | |
|---|---|---|---|
| Expected | Found | ||
| MoVI (10), Ni (10), Ag(10), Zn (25) | 10 | 9.9 ± 0.2 | 99.00 |
| Co (12), Mg (80) Ca (20), MoVI(10), Ni (10), Zn (25), K ( 25), Cu (10) |
10 | 9.85 ± 0.4 | 98.50 |
| Co (12), Mg (80), Ca (20), MoVI(10), Ag (10) | 10 | 9.92 ± 0.6 | 99.20 |
*Relative standard deviation (RSD) < 4.0
Table 3: Analysis of palladium(II) in synthetic mixtures (n = 5).
| Composition | Palladium, % | |
|---|---|---|
| Certified | Found | |
| Ag, 99.90, Cu: 0.049 | 0.048 | 0.047 |
Table 4: Comparative results for the analysis of palladium in simulated alloy sample (n=5).
| Pd(II), µg l-1 added | Recovery, % | |
|---|---|---|
| Tap water (Mansoura city) | 0.0 | - |
| 5.00 | 98.6 ± 0.4 | |
| 10.0 | 99.7 ± 0.3 | |
| Nile water (Talkha fertilizer plant) | 0.0 | - |
| 5.0 | 99.5 ± 0.6 | |
| Nile water (Mansoura City) | 10.0 | 98.8 ± 0.2 |
| 0.00 | - | |
| 5.0 | 97.9 ± 0.1 | |
| Seawater (Ras El-Bar) | 10.0 | 99.8 ± 0.5 |
| 0.00 | - | |
| 5.00 | 99.6 | |
| Lake water (Manzala Lake) | 10.0 | 98.9 |
| 0.00 | - |
*Relative standard deviation (RSD, %) < 3
Table 5: Determination of palladium in different water samples (n = 5).
In synthetic mixtures: Several synthetic mixtures of varying compositions containing palladium and diverse ions of known concentrations were determined by the present method using tartrate or KCN as masking agents and the results were found to be highly reproducible. The results are shown in Table 3. Accurate recoveries were achieved in all solutions.
In simulated ore samples: It is well established in the literature [38] that the spectrophotometric determination of Pd after solvent extraction is hampered by the presence of silver. Thus, the applicability of this procedure was extended to the determination of Pd(II) in a simulated silver alloy (Table 4).
In water samples: In order to investigate the applicability to a natural-water sample, the recoveries of known amounts of Pd(II) added to bi-distilled, domestic and river water samples were examined by such a procedure. The results are presented in Table 5.
Conclusion
In this paper, a new, simple, sensitive, selective and inexpensive micelle mediated method was developed for the analysis of palladium in environmental and certified samples, for continuous monitoring to establish the trace levels of palladium in different sample matrices. Although many sophisticated techniques such as pulse polarography, HPLC, AAS, ICP-AES, and ICP-MS are available for the determination of palladium at trace levels in numerous complex materials, factors such as the low cost of the instrument, easy handling, lack of requirement for consumables, and almost no maintenance have caused spectrophotometry to remain a popular technique, particularly in laboratories of developing countries with limited budgets. The sensitivity in terms of molar absorptivity and precision in terms of relative standard deviation of the present method are very reliable for the determination of palladium in real samples down to 10 ng ml-1 levels in aqueous media at room temperature (25 ± 5°C).
PPT is one of the most sensitive reagents for palladium(II) and the proposed method compares favorably with existing methods [39].
References
- Fendler JH (1982) Membrane Mimetic Chemistry. John Willey Sons, New York.
- Fuhrhop JH, Koning J (1994) Membrane and Molecule Assemblies: The Synthetic Approach. Royal Society of Chemistry, Cambridge.
- Fendler JH (1987) Atomic and Molecular Clusters in Membrane Mimetic Chemistry. Chem Rev 87: 877-899.
- Hinze WL (1979) Use of Surfactant and Micellar Systems in Analytical Chemistry. Solution Chemistry of Surfactants 1: 79-127.
- Menger FM (1979) The structure of micelles. Acc Chem Res 12: 111-117.
- Garcia AL, Gonzalez EB, Alonso JLG, Medel AS (1992) Potential of micelle-mediate procedures in the sample preparation steps for the determination of polynuclear aromatic hydrocarbons in waters. Anal Chim Acta 264: 241-248.
- Okada T (1992) Temperature-induced phase separation of nonionic polyoxyethylated surfactant and application to extraction of metal thiocyanates. Anal Chem 64: 2138-2142.
- Paramauro E, Prevot AB, Pelizzetti E, Marchelli R, Dossena A, et al. (1992) Quantitative removal of uranyl ions from aqueous solutions using micellar-enhanced ultrafiltration. Anal Chim Acta 264: 303-310.
- Cline-Love LJ, Habarta JG, Dorsey JG (1984) The micelle-analytical chemistery interface. Anal Chem 56: 1132-1148.
- Jin X, Zhu M, Conte ED (1999) Surfactant-Mediated Extraction Technique Using Alkyltrimethylammonium Surfactants: Extraction of Selected Chlorophenols from River Water. Anal Chem 71: 514-517.
- Tani H, Kamidate T, Watanabe H (1998) Aqueous micellar two-phase systems for protein separation. Anal Sci 14: 875-888.
- San Andres MP, Marina ML, Vera S (1995) Spectrophotometric determination of copper(II), nickel(II), and cobalt(II) as complexes with sodium diethyldithiocarbamate in the anionic micellar media of dodecylsulfate salts. Analyst 120: 255-259.
- Esteve-Romero JS, Monferrer-Pons L, Ramis-Ramos G, Garcia-Alvarez-Coque MC (1995) Enhanced spectrophotometric determination of nicotinic acid in a sodium dodecyl sulphate micellar medium. Talanta 42: 737-745.
- Paradkar RP, Williams RR (1994) Micellar Colorimetric Determination of Dithizone Metal Chelates. Anal Chem 66: 2752-2756.
- Bagheri Gh A, Yosefi rad A, Rezvani M, Roshanzamir S (2012) Spectrophotometric complexation of cephalosporins with palladium (II) chloride in aqueous and non-aqueous solvents. Spectrochim Acta A Mol Biomol Spectrosc 89: 317-321.
- Tagashira S, Onoue K, Murakami Y, Sasaki Y (1992) Micellar effect on the Formation Rate of Ni(II) and Co(II) Complexes with 8-Quinolinol and its 5-alkyloxymethyl-8-quinolinol Derivatives in a Nonionic Surfactant Micellar System. Bull Chem Soc Jpn 65: 286-288.
- Cline-Love LJ, Skrilec M, Habarta JG (1980) Analysis of micelle-stabilized room temperature phosphorescence in solution. Anal Chem 52: 754-759.
- Skrilec M, Cline-Love LJ (1980) Room temperature phosphorescence characteristics of substituted arenes in aqueous thallium lauryl sulfate micelles. Anal Chem 52: 1559-1564.
- Taketatsu T, Sato A (1979) Spectrofluorimetric determination of europium and samarium with mixtures of 2-thenoyltrifluoroacetone and tri-n-octylphosphine oxide in aqueous solutions containing triton x-100. Anal. Chim. Acta 108: 429-432.
- Medina-Escriche J, De la Guardia-Cirusede M, Hernandez-Hernandez F (1983) Increase in the sensitivity of the fluorescent reaction of the complexing of aluminium with morin using surfactant agents. Analyst 108: 1386-1391.
- Bruzzoniti MC, Mucchino C, Tarasco E, Sarzanini C (2003) On-line preconcentration, ion chromatographic separation and spectrophotometric determination of palladium at trace level. J Chromatogr A 1007: 93-100.
- Savvin SB, Dedkova VP, Shvoeva OP (2000) Sorption-spectroscopic and test methods for the determination of metal ions on the solid-phase of ion-exchange materials. Russ Chem Rev 69: 187-200.
- More PS, Sawant AD (1994) Isonitroso-4-Methyl-2-Pentanone for Solvent Extraction and Spectrophotometric Determination of Palladium (II) at Trace Level. Anal Lett 27: 1737-1748.
- Akl MA (2006) An improved colorimetric determination of lead(II) in the presence of nonionic surfactant. Anal Sci 22: 1227-1231.
- Khalifa ME, El-Nader HM A (1996) Spectrophotometric and kinetic studies on the complexation of Ni(II) with phenanthraquinone mono-phenylthiosemicarbazone. Rev Chim 47: 360.
- Akl MA (2001) Spectrophotometric and AAS determinations of trace zinc(II) in natural waters and human blood after preconcentration with phenanthraquinone monophenylthiosemicarbazone. Anal Sci 17: 561-564.
- Khalifa ME, Akl MA, Ghazy SE (2001) Selective flotation spectrophoto metric determination of trace copper(II) in natural water, human blood and drug samples using phenanthraquinone monophenyl thiosemi carbazone. Chem Pharm Bull 49: 664-668.
- Akl MA, Khalifa ME, Ghazy SE, Hassanien MM (2002) Selective flotation-separation and spectrophotometric determination of cadmium using phenanthraquinone monophenythiosemicarbazone. Anal Sci 18: 1235-1240.
- (1976) Pesticides face uncertain future. Chem Eng News 54: 6.
- (1976) Concentrates. Chem Eng News 54: 7.
- Becher P (1966) Surfactant Science Series. Volume 1, Marcel Dekker, New York, 481.
- Rosen MJ, Kunjappu JT (1987) Surfactants and Interfacial Phenomena. 4th edition, Wiley, New York.
- Corti M, Minera C, Degiorgia V (1984) Cloud point transition in nonionic micellar solutions. J Phys Chem 88: 309-317.
- Rao CNR, Vankataraghavan R (1962) The C=S stretching frequency and the -N-C=S bands in the infrared. Spectrochim Acta A 18: 541-547.
- Ferraro JR, Walter WR (1965) Infrared Spectra of Hydroxy-Bridged Copper(II) Compounds. Inorg Chem 10: 1382-1386.
- Biradar NS, Patil BR, Kalkarmi VH (1975) Transformation of square-planar dsp2 configuration of Ni(II) aldoximates into octahedral sp3d2 configuration by reaction with tin(IV) chloride. J Inorg Nucl Chem 37: 1901-1904.
- Ferraro JR (1971) Low Frequency Vibration of Inorganic and Coordination Compound. Plenum press, New York.
- Marczenko Z, Jarosz J M (1981) Flotation-spectrophotometric determination of palladium with thiocyanate and Methylene Blue. Analyst 106: 751-756.
- Gopala Krishna D, Devanna N, Chandrasekhar KB (2010) Comparative study of Palladium (II) using 4-Hydroxy 3, 5 dimethoxy benzaldehyde 4-hydroxy benzoyl hydrazone and Cinnamaldehyde 4-hydroxy benzoylhydrazone in presence of micellar medium by Spectrophotometry. IJPSR 1: 301-311.
Relevant Topics
Recommended Journals
Article Tools
Article Usage
- Total views: 15820
- [From(publication date):
November-2014 - Apr 10, 2025] - Breakdown by view type
- HTML page views : 11146
- PDF downloads : 4674

