Research Article Open Access
Optimization of Libyan Crude Oil Biodegradation by Using Solid Waste Date as a Natural Low-Cost Material
| Abdullah M Elmahdi1, Hamidi Abdul Aziz1*, Nour Sh El-Gendy2, Salem S Abu Amr1 and Hussein N Nassar2 | |
| 1School of Civil Engineering, Engineering Campus, UniversitiSains Malaysia, Malaysia | |
| 2Egyptian Petroleum Research Institute, Nasr City, Egypt | |
| Corresponding Author : | Hamidi Abdul Aziz School of Civil Engineering Engineering Campus UniversitiSains Malaysia, Malaysia Tel: +60-45996215 Fax: +60-45941009 E-mail: cehamidi@usm.my, cehamidi@yahoo.com |
| Received July 23, 2014; Accepted October 17, 2014; Published October 20, 2014 | |
| Citation: Elmahdi AM, Aziz HA, El-Gendy NS, Amr SSA, Nassar HN (2014) Optimization of Libyan Crude Oil Biodegradation by Using Solid Waste Date as a Natural Low-Cost Material. J Bioremed Biodeg 5:252. doi:10.4172/2155-6199.1000252 | |
| Copyright: © 2014 Elmahdi AM, et al. This is an open-a ccess article distributed under the terms of the Creative Commons Attribution License, which permits unrestricted use, distribution, and reproduction in any medium, provided the original author and source are credited. | |
Related article at Pubmed Pubmed  Scholar Google Scholar Google |
|
Visit for more related articles at Journal of Bioremediation & Biodegradation
Abstract
The objective of this research was to evaluate the effectiveness of the use of solid waste date (SWD) as a lowcost natural agro-industrial materials, in improving crude oil biodegradation in contaminated sea water. Two types of Libyan crude oil (heavy crude oil (HCO) and light crude oil (LCO)) were used in this study. Batch reactors with sea water were used as bioreactors. A central composite design (CCD) with response surface methodology (RSM) was applied to evaluate the relationship between operating variables, including HCO and LCO initial concentrations, SWD dosage, and incubation time, to determine the optimum operating conditions. Quadratic models of both CO biodegradation (%) were significant with very low probability values (<0.0001). The results indicated that under optimum operational conditions (i.e, SWD dosage of 0.21g/L in 11dayes for HCO and 0.20 g/L in 14 days for LCO), the best biodegradation efficiency of HCO and LCO were 79.49% and 94.15%, respectively. The predicted results of 82.10% and 95.45% fitted well with experimental results (HCO and LCO removal rates of 97.05% and 99.10%, respectively). Based on removal rates of 5.5% and 14.7% for both HCO and LCO without SWD, respectively, in 28 days, the obtained results revealed that SWD was very efficient in improving the biodegradation of high-concentration crude oils that contaminate sea water.
| Keywords |
| Bioremediation; RSM; Crude oil concentration; Solid waste date; Total petroleum hydrocarbons |
| Abbreviations |
| ANOVA: Analysis of Variance Average; CCD: Central Composite Design; CO: Crude Oil; HCO: Heavy Crude Oil; HEM: Hexane Extractable Material; LCO: Light Crude Oil; RSM: Response Surface Methodology; SWD: Solid Waste Date; TGY: TryptonGlcouse Yeast |
| Introduction |
| The pollution of marine environment by crude oil hydrocarbon has been regarded as an increasingly serious public concern for environmental and health reasons [1-3]. The exploitation of offshore oil resources, the use and transportation of petroleum products, wastes emission, and frequently occurring oil spill accidents have negative impacts to marine ecosystems [4]. Methods involving physical skimming and the use of chemical dispersants to solve this problem are both expensive and limited in effectiveness [5]. Thus, innovative and inclusive technologies have been developed for the removal of petroleum contaminants [6]. |
| Approaches for cleaning up an oil spill are greatly affected by a variety of factors, such as the type of oil, the characteristics of the spill site, and, to a particular extent, political considerations [7,8]. As such, understanding the quantity and characteristics of oil spill, age of oil, weather conditions, surrounding environment, ocean behavior, and impact on marine life is necessary to determine the best oil spill cleanup technique [9]. Numerous studies have reported that bioremediation methods are alternatives and or enhancements to these methods because of the limitations of the above mentioned physicochemical technologies [10]. The major constituents of most crude oils are biodegradable; thus, bioremediation has been proven to be a cheap and efficient technique than others. Bioremediation is simpler, less laborintensive, and public attitude toward bioremediation are generally more encouraging. The lack of knowledge about microorganisms and their natural role in the environment could affect the suitability of their use [11]. By contrast, bioremediation is an effective treatment in terms of efficacy, safety in long-terms use, cost, and simplicity of administration [12]. The interaction between microbial population and hydrocarbon has been researched for years by a number of researchers [13-17]. The present study shows that the biological treatment technology of crude oil is a complex process in the marine environment [18,19]. The successful application of bioremediation technology to contaminated marine environment requires knowledge of the characteristics of the site and the parameters that affect the microbial biodegradation of pollutants [20]. Biodegradation depends on abiotic or physico-chemical factors, comprising those related to the structure of the pollutant and environmental conditions as well as biotic factors, which are dependent on the specific microorganism [21]. One dynamic factor that affects the environmental cycling processes of petroleum is the addition of nutrients. In marine ecosystems, nutrient limitation is generally related with low background levels of nitrogen and phosphorus in seawater [22]. Some of the nutrients, depending on the source and concentration, may have direct toxic impact on indigenous microorganisms or may not be bioavailable. The use of cheap alternative sources such as solid waste date (SWD) might help avoid these problems. Encouraging results from such study would present SWD as a potent bioremediation tool for the clean-up of PAH-contaminated environments because the goal of any bioremediation protocol is the destruction of the pollutant by using cheap and available nutrient sources [23]. Waste dates are an attractive raw carbon source for the microbial production of a variety of biochemicals [24]. Pseudomonas BOP 100 can produce rhamnolipid and phenazine when grown on waste dates as the sole carbon source and great potential for industrial bioremediation applications [25-27]. Currently, bioremediation is thought to be as a cost- and performanceeffective technology to solve environmental pollution problems [28]. Thus, cheaper and environmentally friendly options of enhancing petroleum hydrocarbon degradation are needed. One such option is the use of crop- derived organic wastes (crop residue) and animalderived organic wastes (animal dung) that function as bulking agents and also as bacterial biomass suppliers. The use of such wastes improves the aeration condition in the bioremediation process [29]. Response surface methodology (RSM) is typically used to explore the relationships between numerous explanatory variables and one or more response variables [30-33]. The objective of the present study is to introduce the effectiveness of employing natural, low-cost materials to improve the biodegradation of highly crude oil-contaminated sea water. Consequently, SWD applications in different dosage for the removal of different crude oil concentration were not well-documented. In this study, statistical relationships among independent factors, including SWD dosages, reaction time, and initial concentration of CO, to improve CO biodegradation were assessed through response surface methodology (RSM). RSM, a mathematical and statistical technique used in the optimization of chemical reactions and industrial processes, is commonly used for experimental designs. |
| Materials and Methods |
| Sampling |
| Samples used in this work were collected from the oily sand pit for waste disposal at Nafoora oilfield and Tobruck oil terminal tank and placed in 1 liter sterilized plastic continers. The samples were immediately transported to the laboratory, characterized, and cooled to 4°C to minimize the biological and chemical reactions. Samples collection and preservation were performed in accordance with the Standard Methods for the Examination of Water and Wastewater [34]. |
| Microorganisms and culture isolation |
| Bacteria in the samples were isolated from Nafoora oilfield crude oil-contaminated water (water-in-oil emulsion 70% water content [wt/ wt]), designed as NAF1 and idintified according to microscopically and morphological characteristics. Moleqular identification of isolate was performed by implification and sequencing the 16SrDNA gene sequenceing and maching it to the database of known 16SrDNA sequence. The compared strain showed more than 97% 16S r RNA gene sequence similarity and it was concluded that they were similar or the same at the species level. The Pseudomonas aeurgonis strain (PAO1) was isolated via a standard culture enrichment technique by using a basal salt medium, namely, Basal Salt Mineral (BSM). The BSM medium (pH 7.0) was prepared according to Ruberto et al. [35]. 2.44 g of KH2PO4, 5.57 g of NaHPO4, 2.0 g of NH4Cl, 0.2 g of MgCl2 .6H2O, 0.001 g of FeCl3 .6H2O, and 0.001 g of CaCl2 .2H2O dissolved in 1 L of sea water and autoclaved. The strain was stored in 50% (v/v) glycerol at -80°C. For isolation and enumeration of total viable cells, Basal Salt Mineral (BSM) and Trypton Glucose Yeast (TGY) were solidified by 2% agar, and plates were used. Each medium was sterilized for 20 min at 121°C. Microorganisms were tested using spred pate technique and counted as CFU/100 mL. |
| Bioreactor experimental procedure |
| To investigate the effectiveness of SWD in improving the biodegradation efficiency of crude oil, all experiments were carried out using 30 mL batch bioreactors volume with respect to operational conditions (different initial concentration of crude oil, and SWD dosage and different reaction time. SWD was purchased from a local market in Benghazi, Libya, and its compositions as reported by the manufacturer were as follows, for each 100 mL: moisture, 13%–16%; protein, 1.0%– 2.3%; ash, 1.4%–1.8%; total sugar, 75%–76% (glucose: 38%; fructose: 36%); pectin, 0.1%–0.2%; tannin, 0.2%–0.3%; pH, 4.5–5.3; Total Disolved Solids (TDS), 74%–75%. Fat and fiber were undetectable. The incubation period was 28 d. All experiments were performed in duplicate, and the average results were reported [36-38]. |
| Isolated strain was heavily inoculated in the TGY medium at pH 7 and then incubated at 30°C for 24 h in a shaking incubator at 150 rpm. The strain was harvested via centrifugation at 5000 rpm for 15 min, washed twice with sterilized saline (8.5 g NaCl/L distilled H2O), and then re-suspended in fresh, sterilized BSM. The inoculum was adjusted to about 3.3 x 10⁷ Colony Forming Unit (CFU/mL). A total of 10 bioremediation trial and 1 natural attenuation were carried out in Erlenmeyer flasks bioreactors (replicate culture all containing 30 mL of BSM and different concentrations of SWD). SWD was used individually at different initial concentrations of 0.2%, 0.5%, and 0.8% (w/v). SWD was added individually with different concentrations into 30 mL of BSM then sterilized by autoclaving for 20 min at 121°C [39]. 3 mL of inoculums containing 3.3 x 10⁷ cell/mL was added to each bioreactor. The pH was adjusted to 7.0 [31,35]. |
| Washed cells were inoculated to produce an initial inoculum size of 107 CFU/mL into 30 mL of sterilized BSM. Non-inoculated and without SWD reactors were performed in parallel with the inoculated at the same conditions as a control samples to calculate the biotic loss. |
| In a biotic control, a bioreactor was treated with the biocide HgCl2 to show the effect of evaporation, photo-oxidation, and other physical reactions in the absence of microbial activity. The reactors were continuously shaken by using an orbital shaker, and the samples were removed for assay at 7, 18, and 28 d. |
| Undegraded oil (residual oil) was extracted, and its concentration was gravimetrically determined. The control flasks were also extracted similarly, and degradation was determined by weight difference. |
| Experimental design and analysis |
| Design Expert software (version 6.0.7) was used for the statistical design of experiments and data analyses. In this study, CCD and RSM were applied to optimize and assess the relationship among three significant independent variables, as presented in Table 1: (1) crude oil concentration (heavy and light% (w/v), (2) solid waste date concentration% (w/v), and (3) incubation period (d). The biodegradation of HCO and LCO was considered as dependent factors (response), and performance was evaluated by analyzing the CO removal efficiencies. Each independent variable was varied over three levels between −1 and +1 at determined ranges based on a set of preliminary experiments. The total number of experiments obtained for the three factors was 20 (=2k+2k+6), where k is the number of factors (k=3). Fourtten experiments were enhanced with six replications to assess the pure error. The appropriate model followed a quadratic pattern because only three levels were used for each factor, as shown in Equation (1): |
 (1) (1) |
| where Y is the response, Xi and Xj are the variables, β is the regression coefficient, k is the number of factors studied and optimized in the experiment, and e is the random error. |
| Analysis of variance (ANOVA) was performed for graphical analyses of the data to determine the interaction between the process variables and the responses. The quality of the fit of the polynomial model was expressed by the value of the correlation coefficient (R2), and its statistical significance was checked by the F-test in the same program. Model terms were evaluated based on the p-value (probability) at 95% confidence level. pH was maintained at 7 for all runs |
| Optimization study |
| Based on the results obtained from first part of the study, two sequences of experiments were selected, namely, light and heavy crude oil concentrations of 10000 ppm to simulate light and heavy oil spills, respectively. SWD demonstrated good removal and was effective in the bioremediation of crude oil compounds. All bioremediation tests in the second part of the study were conducted using SWD. This study was done to confirm the optimum concentration of SWD as a commercial and readily available co-substrate and nutrient to obtain the maximum biodegrading activity of an indigenous microbial population. |
| In each sequence, the experiments were designed via CCD. Two bioremediation trials and one natural attenuation were carried out in Erlenmeyer flasks bioreactors (replicate culture all containing 100 mL of BSM- crude oil and final concentration of SWD), about 0.2% and 0.21% (w/v) were incubated in a shaking incubator at 30°C and 150 rpm for 11 and 14 d. Flasks without nutrients were used at the same conditions to evaluate the effect of natural weathering sources. About 3 mL of bacteria inoculums containing 3.3×10⁷ cell/mL were added to all bioremediation test reactors. The reactors were continuously shaken using an orbital shaker, and the samples were taken on days 11 and 14. Growth was monitored in terms of total viable count (cells/mL) on TGY plates. |
| Undegraded oil (residual oil) was extracted, and its concentration was gravimetrically determined. The control flasks were also extracted in a similar manner, and degradation was determined by weight difference. |
| Analytical study |
| Total petroleum hydrocarbons (TPH) were measured by the Environmental Protection Agency, EPA Method-1664 [40]. The samples were acidified to pH<2 and serially extracted three times with analytical grade n-hexane (Merck, Darmstadt, Germany) in separator funnels. The extracts were dried over granular anhydrous sodium sulfate (Merck, Darmstadt, Germany). The solvent was distilled from the extract, and the n-Hexane Extractable Material (HEM) was desiccated and weighed. The HEM was re-dissolved in n-hexane, and silica gel was added to the solution containing the re-dissolved HEM to remove polar materials. The solution was filtered to remove the silica gel, the solvent was distilled, and the Silica Gel-Treated n-hexane extractable material (SGT-HEM) was desiccated and weighed. Quality assurance and control were carried out according to same procedure. Calibration verification and analysis of blanks were performed daily. Percent recovery (S) was calculated using Eq. (2): |
 (2) (2) |
| Where n is the number of samples and x is the percent of recovery in each sample. Moreover, matrix spike (MS) was tested to ensure the accuracy of the analysis. |
| The Relative Percent Difference (RPD) between the matrix spike and Matrix Spike Duplicated (MSD) was computed using Eq. (3): |
 (3) (3) |
| Where D1 is the concentration of the hexane-extractable material in the sample, and D2 is the concentration of hexane-extractable material in the duplicate sample. |
| Analyses were verified via GC (US-EPA) [41] by using a GC 2000 Series equipped with a flame ionization detector (Fisons Instruments, Milan, Italy). A DB-5 capillary column (J&W Scientific, Folsom, CA, USA) (60 m × 0.25 mm ID, film thickness 0.25 μm) was used. The operating conditions were as follows: injector temperature, 300°C; detector temperature, 300°C; carrier gas, helium 99.999% (35 mL/s); air flow, 350 mL/s; make-up gas nitrogen, 30 mL/s; and oven temperature program, 1 min at 60°C, followed by a temperature increase of 10°C/min up to 160°C, followed by 10 min at 160°C, followed by a temperature increase of 4°C/min up to 300°C, and finally 10 min at 300°C. Splitless mode injections were carried out with the splitless time at 0.8 min. The chromatographic data were analyzed using Chrom-Card data system version 2.1 software (Thermo Electron, Rodano, Italy). |
| Results and Discussion |
| Compared with other biodegradation methods, bioremediation that involves the use of microorganisms is more efficient, but the low solubility and adsorption of high-molecular weight hydrocarbons limits their availability to microorganisms. |
| The microbes present in the water first recognize the oil and its constituent by biosurfactants and bioemulsifiers and they then attach themselves and use the hydrocarbon present in the petroleum as a source of energy and carbon [42]. |
| In recent years, many studies have been carried out towards the efficient utilization of agro-industrial residues such as cassava wastewater [43], ground nut oil refinery residue and corn steep liquor [44], molasses [45,46], and potato peels [47]. deGusmão et al. [48] studied the biosurfactant production of Candida glabrata by using vegetable fat waste as the substrate and applied a factorial design and RSM to investigate the effects and interactions of waste, yeast extract, and glucose on the surface tension after 144 h of cultivation. |
| Biodegradation enhancement |
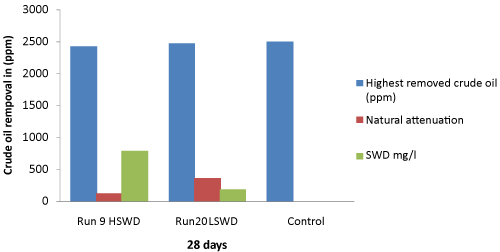
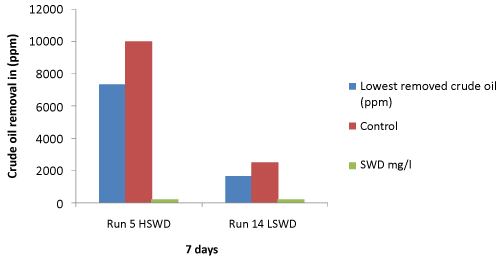
| A total of 20 runs were executed for each HCO and LCO via the CCD experimental design. Interactions between the three independent variables were considered for each run to investigate the performance of CO biodegradation. SWD was used to improve the biodegradation efficiencies for both HCO and LCO in sea water batch bioreactors. The results are presented in Table 2. The removal efficiencies ranged from 73.38 to 97.05% for HCO and 65.46.7 to 99.10% for LCO (Figure 1a and 1b). |
| Based on the results, the highest removal at unoptimized conditions for HCO (97.05%) was obtained at 0.25 g/L initial concentration of HCO, 0.8 g/L SWD dosage, and 28 d of incubation time, whereas the lowest removal (73.38%) was obtained at 1.0 HCO initial concentration, 0.2 SWD dosage, and minimum incubation period (7 d). For LCO, the highest removal value (99.10%) was observed by using 0.2 g/L SWD for 0.25 g/L LCO initial concentration during 28 d of incubation, whereas the minimum removal was observed (65.46%) at 0.25 g/L LCO, 0.2 g/L SWD, at 7 d of incubation. The results reveal that the incubation time was the most limiting factor for both CO biodegradation. Microorganisms capable of utilizing petroleum hydrocarbons are ubiquitous in marine, freshwater, and soil ecosystems, and those environments with hydrocarbon contamination will have a higher percentage of oil degraders than in unpolluted areas [49]. In the present study, the bacterial strain was identified as species of Pseudomonas aeruginosa. The performance of the strain was detailed in Rashedi et al. [23]. Our results suggest that the addition of SWD could facilitate the biodegradation of crude oil by Pseudomonas aeruginosa. In the production of rhamnolipids, Pseudomonas aeruginosa can convert crude oil into cell mass. The potential biodegradation of crude oil was assessed based on the development of a visible fermentative process with a strain of Pseudomonas aeruginosa, which produced rhamnolipids when cultured in a basal salt medium by using SWD as a substrate [50]. |
| Analysis of variance (ANOVA) |
| Tables 3a and 3b present the ANOVA of regression parameters of the predicted response surface quadratic models and other statistical parameters for removal (%) of HCO and LCO. The data given in these tables demonstrate that all the models were significant at 5% confidence level given that p values were less than 0.05. The values of the correlation coefficient obtained in this study for both types of CO removal (R2 = 0.9375 and 0.8455, respectively) were greater than 0.80. For a model with good fit, the minimum correlation coefficient must be 0.80 [51- 53]. The “adequate precision” ratio of the models varied between 14.23 and 9.23, which is an adequate signal for the model. p values higher than 4 are desirable and confirm that the predicted models can be used to navigate the space defined by CCD. |
| The regression equation shows that the degradation rate was an empirical function of the test variables in coded units. Equations 4 and 5 provide the model for HCO and LCO removal in this research: |
| HCO removal (%) = 92.73-0.81A+4.45B+5.27C-1.89A2-1.95B2- 2.25C2-1.35A |
| B+1.32AC-1.08BC (4) |
| LCO removal (%) = 92.91+1.27A+0.13B+2.86C+1.68A2+2.36B2- 2.82C2+0.48AB-0.72AC-1.30BC (5) |
| where A is CO concentration (mg/L), B is the concentration (mg/L), and C is time (day). |
| In this model, the two-level interaction between terms A and B and the second-order effect of terms A and C were insignificant, whereas the other terms were significant (insignificant terms were removed in the final equation). The coefficients with one factor show the effect of the particular factor, whereas the coefficients with two factors and those with second-order terms demonstrate the interaction between the two factors and quadratic effect, respectively. The positive sign in front of the terms indicates a synergistic effect, whereas a negative sign indicates an antagonistic effect [49]. |
| The quality of the fit of the polynomial model (HCO) is expressed by the coefficient of determination R2, adjusted coefficient (R2Adj), and predicted coefficient (R2Pred). In this study, the predicted R-squared of 0.6511 is in reasonable agreement with the adjusted R-squared of 0.8812. The coefficient of determination (R2) and the Predicted Residual Sum of Squares (PRESS) were 0.9375 and 244.33, respectively. The coefficient of variation (CV) was 2.33. |
| The quality of the fit of the polynomial model (LCO) is expressed by the coefficient of determination R2, adjusted coefficient (R2Adj), and predicted coefficient (R2Pred). In this study, the predicted R-squared of 0.095 is in reasonable agreement with the adjusted R2 of 0.706. The coefficient of determination (R2) and predicted residual sum of squares (PRESS) were 0.8455 and 200.53, respectively. The coefficient of variation (CV) was 1.8. |
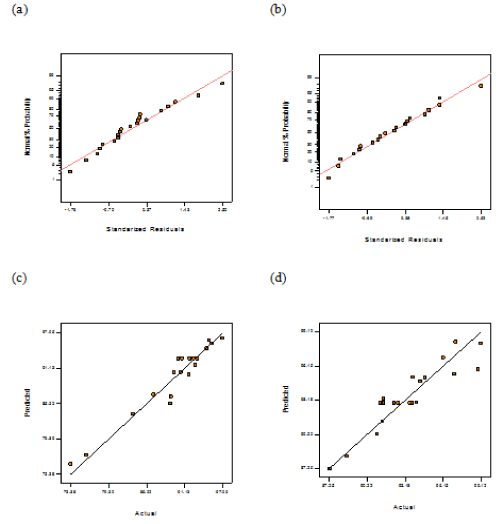
| The normal probability plots of the standardized residuals and diagnostics were obtained using the Design Expert 6.0.7 software to confirm that the selected models provided an adequate approximation of the real system. The normal probability plots aided in evaluating the models. Figure 2a and 2b demonstrates the normal probability plots for the standardized residuals for HCO and LCO removal of CO. The normal probability plots predict that if the residuals follow a normal distribution, as shown in Figure 2, then the points will fall along a straight line for each case. However, some scattering is expected even with normal data; thus, the data can be considered to be normally distributed in the responses of specific models. Figure 2c and 2d indicates that the predicted values of HCO and LCO removal efficiency obtained from the model and the actual experimental data were in good agreement. |
| Treatment efficiency |
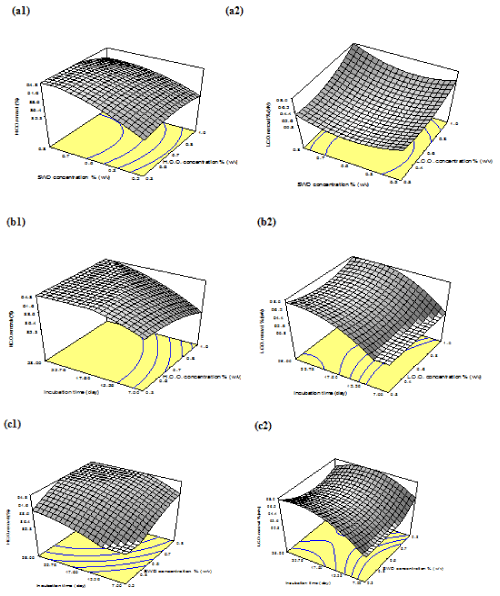
| To assess the interactive relationships between independent variables and the responses of certain models, 3D surface response plots were obtained using Design Expert 6.0.7 software Figure 3a- 3c. The maximum levels of HCO and LCO were 97.05% and 99.10%, respectively. |
| Figure 3a1 and a2 present the effects of interaction between initial concentration for both HCO and LCO and SWD dosage in CO removal at 17.5 d of incubation. The HCO removal (%) increased with increasing SWD dosage, and the maximum removal was obtained at a high SWD dosage of 0.8 g/L and an initial concentration of HCO of 0.25 g/L, whereas no significant effects were observed for the variation of both factors on LCO removal. Figure 3b1 and 3b2 presents the effects of initial CO concentrations and incubation time on both HCO and LCO removals at an SWD dosage of 0.28 g/L. For both COs, the removal efficiencies improved with increasing incubation time. Figure 3c1 and c2 illustrates that the cooperation effects vary with SWD dosage and incubation time at a CO initial concentration of 1.0 g/L. |
| Optimization and verification |
| Optimization was carried out to determine the optimum values of HCO and LCO removal efficiency by using the Design Expert 6.0.7. Based on the software optimization step, the desired goal for each operational condition (initial HCO and LCO concentrations, SWD dosage, incubation time, and reaction time) was chosen “minimum” in the range. The responses (HCO and LCO removal) were defined as the maximum to achieve the highest performance. |
| The most cost-efficient and environmental-friendly conditions for the bioremediation of crude oil would use the lowest amounts of SWD in the shortest time. Hence, a set of approximate reaction conditions based on the required criteria for maximum oil degradation and minimum nutrient consumption is predicted by the software via numerical optimization with the highest desirability. |
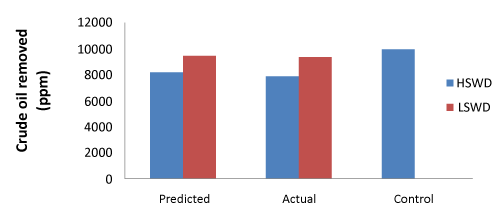
| The numerical optimization criteria for maximum (CO) removal were set in a range for variables. At SWD concetrations of 0.21 and 0.20 g/L in 11 and 14 d, the software predicted 82.01% and 95.45% removal for HCO and LCO, respectively, with desirability of 1.00, Figure 4. Confirmatory experiments at the optimum conditions were carried out, and removal rates of 79.49% and 94.15% were observed for HCO and LCO, respectively, which is in reasonable agreement with the model with removal rates of 5.5% and 14.7% for both HCO and LCO without SWD. |
| Residual and present between predicted and actual values error were evaluated to validate the experiments. Errors were calculated using Eq. (6): |
 (6) (6) |
| Where XObs are the observed values and XPre are the predicted values. |
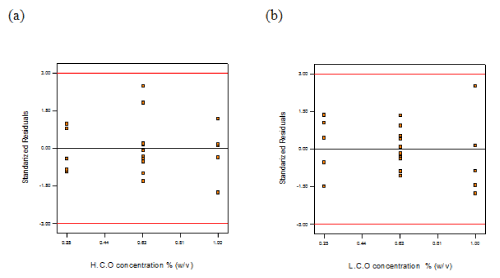
| Residual ranged between -3 and 3 (Figure 5). The residual indicates that the process optimization via CCD was reliable. |
| Conclusions |
| The effectiveness of nutrients as SWD supplements in increasing the biodegradation rate of crude oil was investigated via RSM. A secondorder polynomial mathematical model was generated with multiple regression analysis to describe heavy and light CO Bioremediation in artificially contaminated sea water samples. The highest crude oil removal rates by natural attenuation and by unoptimized bioremediation were 5.5% and 14.7% and 97.05% and 99.10%, respectively. Numerical optimization was achieved based on desirability functions. At SWD concentrations of 0.21 and 0.20 g/L, the software predicted removal rates of 84.42% and 95.70%. |
| Removal rates of 79.49% and 94.15% were observed experimentally, which are in reasonable agreement with the predicted values. The study shows that process variables can be optimized to improve the biodegradation rate. |
| The use of SWD is presented as an attractive option because of its versatility, biodegradability, ecological safety, and environmental suitability. However, their low production cost enhances their use in bioremediation processes. As such, great emphasis is being given on the procurement of various cheap agro-industrial substrates including vegetable oils, distillery and dairy wastes, soya molasses, animal fat, and waste and starchy waste as raw materials. These wastes can be used as substrates for the large-scale production of biosurfactants with advanced technology, which will be discussed in future research. |
| Acknowledgements |
| The authors acknowledge the staff and team of technicians at the Egyptian Petroleum Research Institute for their valuable help by facilitating and supporting the current work and to Mr. YousefImrimi, Arabian Gulf Oil Co. (AGOCO), Libya for his support and encouragement to conduct this work. |
References
|
Tables and Figures at a glance
| Table 1 | Table 2 | Table 3a | Table 3b |
Figures at a glance
 |
 |
 |
| Figure 1a | Figure 1b | Figure 2 |
 |
 |
 |
| Figure 3 | Figure 4 | Figure 5 |
Relevant Topics
- Anaerobic Biodegradation
- Biodegradable Balloons
- Biodegradable Confetti
- Biodegradable Diapers
- Biodegradable Plastics
- Biodegradable Sunscreen
- Biodegradation
- Bioremediation Bacteria
- Bioremediation Oil Spills
- Bioremediation Plants
- Bioremediation Products
- Ex Situ Bioremediation
- Heavy Metal Bioremediation
- In Situ Bioremediation
- Mycoremediation
- Non Biodegradable
- Phytoremediation
- Sewage Water Treatment
- Soil Bioremediation
- Types of Upwelling
- Waste Degredation
- Xenobiotics
Recommended Journals
Article Tools
Article Usage
- Total views: 14810
- [From(publication date):
December-2014 - Apr 03, 2025] - Breakdown by view type
- HTML page views : 10154
- PDF downloads : 4656
