Research Article Open Access
OPG Expression on Endothelial Cells and Modulation by IL-1B, PDGF, Insulin, and Glucose
| Carmen Pérez de Ciriza1, Allan Lawrie2 and Nerea Varo1* | |
| 1Clinical Chemistry Department, Clínica Universidad de Navarra, Pamplona, Spain | |
| 2Cardiovascular Sciences, Royal Hallamshire Hospital, Sheffield, UK | |
| Corresponding Author : | Nerea Varo Servicio de Bioquímica, Clínica Universidad de Navarra Avda Pío XII 36, 31008 Pamplona, Spain Tel: 948 296 395 Fax: 948 296 500 E-mail: nvaro@unav.es |
| Received: September 11, 2015; Accepted: September 30, 2015; Published: October 07, 2015 | |
| Citation: de Ciriza CP, Lawrie A, Varo N (2015) OPG Expression on Endothelial Cells and Modulation by IL-1B, PDGF, Insulin, and Glucose. Biochem Physiol 4:179. doi:10.4172/2168-9652.1000179 | |
| Copyright: © 2015 de Ciriza CP, et al. This is an open-access article distributed under the terms of the Creative Commons Attribution License, which permits unrestricted use, distribution, and reproduction in any medium, provided the original author and source are credited. | |
| Related article at Pubmed, Scholar Google | |
Visit for more related articles at Biochemistry & Physiology: Open Access
Abstract
Introduction: Osteoprotegerin (OPG), an osteoclastogenesis inhibitor implicated in bone remodelling, has emerged as a potential biomarker for cardiovascular diseases. However, OPG circulating sources or the stimuli that increase its release and effects have not been established.
Objective: The aim of the present study are to establish whether endothelial cells may be a potential source of OPG, different mediators and OPG effects on endothelial cells.
Aim: The aim of the present study were: 1) to establish whether endothelial cells may be a potential source of circulating OPG, 2) to study induced OPG expression and release stimulated by different factors and 3) to explore proatherogenic effects of OPG on endothelial cells.
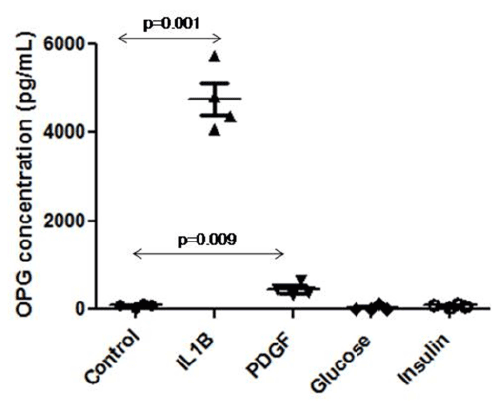
Results: OPG protein and mRNA expression was highly and significantly increased by IL-1β, insulin and glucose. OPG secretion to the supernatant was increased by IL-1β (4758 ± 727 vs. 88 ± 33 pg/mL, p=0.001) and PDGF (451 ± 151 vs. 88 ± 33 pg/mL, p=0.009). Glucose and insulin did not elevate OPG concentration in the supernatant. Endothelial cells stimulated with OPG significantly increased the release of IL-6 to the supernatant (247 ± 60 vs. 148 ± 30, p=0.008) and IL-8 was also increased by OPG (1444 ± 70 vs. 1538 ± 28, p=0.09).
Conclusion: Endothelial cells are a source of OPG in circulation and IL-1β, glucose and insulin stimulate its expression.
| Keywords |
| OPG; Endothelial cells; Expression; Secretion; Inflammation |
| Abbreviations |
| ΔCt: Delta Threshold Value; AU: Arbitrary Units; Ct: Threshold Value; ECs: Endothelial cells; ELISA: Enzyme-linked Immunosorbent Assay; FACS: Fluoresce-Activated Cell Sorting; FBS: Fetal Bovine Serum; hPAECS: Human Pulmonary Arterial Endothelial Cells; HMVEC: Human Microvascular Endothelial Cells; HUVECs: Human Umbilical Vein Endothelial Cells; ICAM-1: Intracellular Adhesion Molecule 1; IHQ: Immunohistochemistry; IL: Interleukin; IMT: Intima Media Thickness; MS: Metabolic Syndrome; OPG: Osteoprotegerin; PBS: Phosphate Buffered Saline; PDGF: Platelet- Derived Growth Factor; RANK: Receptor Activator of NF-κβ; RANKL: Receptor Activator of NF-κβ Ligand; RT-PCR: Real Time Polymerase Chain Reaction; SD: Standard Deviation; TNF: Tumour Necrosis Factor; VCAM-1: Vascular Cell Adhesion Molecule-1; WB: Western Blotting |
| Introduction |
| OPG is a cytokine of the tumor necrosis factor (TNF) receptor superfamily implicated in bone metabolism as an inhibitor of osteoclastogenesis. Biochemically, OPG is a basic secretory glycoprotein composed of 380 aminoacids and seven structural domains which gives a monomeric weight of around 60 Kilo Daltons. In addition to its monomeric structure, OPG can be assembled at the cysteine 400 residue in the heparin binding domain to form a disulphide-linked dimmer [1]. |
| OPG is part of the OPG/receptor activator of NF-кB ligand (RANKL)/receptor activator of NF-кB (RANK) pathway [2]. Classically, this network is involved in bone remodelling, regulates the differentiation and activation of osteoclasts and hence the critical balance between bone formation and bone resorption. Initially, OPG acts as a soluble decoy receptor, negatively regulating the interaction between RANK and RANKL [1,3,4]. Since its discovery, OPG has been studied and increasing interest has risen in different areas such as vascular, tumor and immune biology [5]. Furthermore, several studies suggest that there is a potential role of OPG in mediating cardiovascular damage [1,6-8]. |
| Moreover, OPG levels are associated with different cardiovascular risk factors such as type 1 [9] and type 2 diabetes mellitus [10-13], obesity [14], hypertension [15] or metabolic syndrome [14,16]. |
| In several studies in general population, increased OPG associated with greater risk of myocardial infarction, ischaemic stroke, total mortality and death due to ischemic heart disease, stroke and nonvascular causes after adjustment for traditional cardiovascular risk factors [17]. Besides, increased intima media thickness (IMT) and the presence of carotid plaques also correlated with OPG in healthy individuals [14,18-20]. Moreover, OPG was associated with the risk of future coronary artery disease independent of established cardiovascular risk factors [21] subclinical atherosclerosis, cerebrovascular [22] and cardiovascular disease [23]. |
| Several conditions, linked to increased cardiovascular risk, are known to associate with enhanced OPG. However, there is still no evidence of the potential circulating sources of OPG and in this study the endothelium is studied as a potential source of OPG in circulation. |
| The endothelium plays a pivotal role in the regulation of vascular tone, controlling tissue blood flow and inflammatory responses and maintaining blood fluidity [24]. Both hematopoietic cells and vascular cells are derived from a common ancestor, the hemangioblast. Osteoblasts, ECs and bone marrow stromal cells are also derived from this niche [1]. Taking into consideration that osteoblasts express OPG and that both ECs and osteoblasts share a common origin, OPG expression in both cell types may be expected. |
| Taking all these into consideration, the main aims of the present study was 1) to establish whether endothelial cells may be a potential source of circulating OPG, 2) to study induced OPG expression and release stimulated by different factors and 3) to explore proatherogenic effects of OPG on endothelial cells. |
| Materials and Methods |
| Cell culture and stimulation |
| Human pulmonary arterial endothelial cells (hPAECS) were purchased from Cascade Biologics. Endothelial cells (ECs) were cultured in Medium 200 (Gibco life technologies) supplemented with 10% fetal bovine serum (FBS), 2% penicillin/streptomycin, 0.25 μg/mL amphotericin B and EGM-2 single quots (CloneticsLonza. Hydrocortisone 0.2 mL, hFGF-B 2 mL, VEGF 0.5 mL, R3-IGF-1 0.5 mL, ascorbic acid 0.5 mL, hEGF 0.5 mL, GA-1000 0.5 mL, heparin 0.5 mL). Cells were cultured at 37ºC in humidified air and 5% CO2 in T75 flask until 90% confluence and all experiments were performed between passage 5 and 8. |
| Before the experiments cells were kept in starving media for around 12 hours (1:5 dilution of the supplemented media). For the experiments, cells were trypsinized and transferred to 24 well plates. All conditions were assayed in triplicates and cells were grown until confluence. |
| For proliferation and in-cell western blotting, ECs were stimulated using: IL-1β (a proinflammatory stimuli that contributes to the lowgrade vascular inflammation and to the proinflammatory state that characterizes all cardiovascular diseases), platelet derived growth factor (PDGF) (stored and released by platelets upon activation that is overexpressed in diseases such as atherosclerosis, fibrotic disorders and malignancies), glucose and insulin (because insulin resistance is characterized by hyperglycemia and consequently hyperinsulinemia). All the stimuli are summarized in Table 1. |
| Human recombinant OPG was purchased from Peprotech. IL-1β was purchased from R and D, insulin and glucose from Sigma, and PDGF from Invitrogen. |
| According to the in-cell western blotting results, a single concentration of each stimulus was selected to stimulate cells as follows: OPG 50 ng/mL, IL-1β 10 ng/mL, PDGF 20 ng/mL, insulin 500 nM and glucose 300 mg/dL. Instead of using 500 mg/dL of glucose as stimulus, the concentration was reduced to 300 mg/dL due to the more physiological condition than the highest concentration assayed. After stimulation, cells were incubated for 6 hours for RNA isolation and 24 hours for protein assays and supernatant release. |
| Cell proliferation assay |
| The proliferation assay was followed by a counting procedure using fixation (3.7% formaldehyde in PBS), permeabilization (0.1% Triton X-100 in PBS), blocking (5% milk in PBS) and different nuclear dyes (Sapphire 700 and DRAQ 5, Licor Biosciences). The plate was scanned in a LICOR equipment and provided an integrated intensity that corresponded to the cellular counts (Data not shown). |
| In-cell western blotting |
| Cells were fixed (3.7% formaldehyde in PBS) and permeabilized (0.1% Triton X-100 in PBS). Then, cells were blocked (5% milk in PBS) and the primary antibody (anti-OPG antibody, 1:1000, R and D) was added except for the background wells and cells were incubated overnight at 4 ºC. After incubation, the plate was washed (0.1% Tween in PBS). The secondary antibody was diluted (1:10000, Odyssey) and the normalizing stainings were added to the secondary antibody dilution (Sapphire 700, 1:1,000 and DRAQ5 Stain. 1:10,000). Only secondary antibody was added to the background wells. The plate was scanned in a LICOR equipment using an in-cell western blot analysis. This equipment provided an integrated intensity for each of condition assayed that corresponded to the cellular counts and to the OPG expression inside de cells. |
| RNA extraction |
| Cells were cultured in 6-well plates and 1 mL Trizol was added to isolate RNA according to the trizol method. After solubilisation, chloroform was added for phase separation and after centrifugation (12,000 g for 10 minutes) RNA remains in the colourless upper aqueous phase that was transferred to a new tube. Then, isopropyl alcohol was added, incubated for 10 minutes and centrifuged (12,000 g for 10 minutes) and the supernatant was removed by inversion. The pellet was washed twice (75% ethanol) and centrifuged at 7,500 g for 5 minutes. All the leftover ethanol was removed. RNA was dissolved in DEPCtreated water and its concentration was quantified using a Nanodrop 2000 Spectrophotometer (Thermo Scientific). |
| Retrotranscription |
| The retrotranscription was performed using Superscript III Reverse Transcriptase (Life technologies) in a Veriti 96 well Thermal Cycler (Applied Biosystems) according to the manufacturer´s instructions. In short, RNA samples (diluted to a final volume of 8 μL) were mixed with 4 μL of Master Mix 1 (10 mM dNTPsand 50 ng/ μL hexamers). The mixture was incubated for 5 minutes at 65ºC to denaturalize the RNA and then samples were taken to ice to avoid renaturalization. Then, 8 μL of Master Mix 2 were added (Buffer 5x, 0.1 M dithiothreitol (DTT), 20 U/μL Superase inhibitor and Superscript III-Retrotranscriptase). The thermocycler program was as follows: 25ºC – 5 minutes, 50ºC – 60 minutes, 70ºC – 15 minutes. cDNA samples were quantified using the Nanodrop 2000 Spectrophotometer (Thermo Scientific). |
| Real time- Polymerase chain reaction (RT-PCR) |
| The Applied Biosystems assays used for the analyses were all Taqman-Type probes for the following genes: OPG, RANK, RANKL, VCAM-1, ICAM-1 and IL-6 (Assay on demand, Applied Biosystems). ß-actin was used as an endogenous control to normalize the amount of sample. The analyses were performed in a 7700 AbiReal-Time PCR for 384-well plates. The final volume of reaction was 10 μL: 0.5 μL of the correspondent probe, 5 μL of the Master Mix (Applied Biosystems) and 4.5 μL of each diluted DNA sample in DEPC-water. Each sample was assayed in triplicates for each gene. The PCR conditions were as follows: The first step included 10 minutes at 95ºC to activate the polymerase followed by 45 cycles of amplification. The amplification cycles consisted in 15 seconds of denaturation at 95ºC and then, annealingextension at 60ºC for 1 minute. |
| Western blotting analysis |
| Cell samples for western blotting were obtained in 0.5 mL of icecold lysis buffer (PBS, 0.1% Triton X-100 and protease inhibitor cocktail (Boehringer Mannheim)). Protein concentration was measured by the Bradford method (Bio-Rad). Samples with 25 μg protein were suspended in reducing loading buffer (20% β-mercaptoethanol, 8% SDS, 40% glycerol, 0.05% bromophenol blue and 0.25 mM Tris (pH 6.4)). Samples were boiled for 5 minutes at 95ºC and size fractioned in 10% polyacrilamide gels by electrophoresis. Then, proteins were transferred to nitrocellulose membranes and blocked in 10% milk in TBS-Tween 0.05% overnight. After a three-step washing procedure, membranes were incubated with mouse anti-OPG antibody (1:1000, Santa Cruz Technologies) or anti-β-actin (1:5000, Abcam) for 1 hour at room temperature followed by another washing step and 30 minuteincubation with the secondary antibody anti-mouse Ig G Horseradish peroxidise (1:5000, GE Healthcare). The detection was performed in a Gel Logic 2200 Pro (Carestream) and visualized using ECL-Plus chemiluminiscence detection system (Amersham Biosciences). The resulting bands were analyzed in duplicate by densitometry using the Quantity One 4.5.0 program (Biorad). |
| Enzyme-linked immunosorbent assay |
| OPG, IL-6 and IL-8 were measured by Enzyme-Linked Immunosorbent Assay (ELISA) from R and D systems according to the manufacturer´s instructions. |
| Statistical analysis |
| Statistical analysis was performed using the Statistical Package for Social Sciences (SPSS 15.0 Chicago, IL, USA). Normal distribution of samples was assessed by the Shapiro-Wilks test. Results are presented as mean ± standard deviation (SD), if normally distributed and as median and percentiles 25 and 75, if not normally distributed. |
| Differences between groups were assessed by unpaired Student’s t-test and Mann-Whitney test for normally and non-normally distributed variables, respectively. Comparisons between three or more groups were performed by repeated measurements analysis of variance (ANOVA), followed by a post-hoc Tukey test for pairwise comparison of the means. |
| In the RT-PCR analysis, the threshold cycle (Ct value) was obtained for each amplification curve and a ΔCt value was first calculated by subtracting the Ct value for human β-actin (reference gene) from the Ct value for each probe in each sample. Fold changes compared with the endogenous control were then determined by calculating 2−ΔCt. |
| All p values were two-tailed and p<0.05 was considered statistically significant. |
| Results |
| OPG mRNA and protein expression |
| In-cell WB analysis was performed using different ranges of concentration to select the most appropriate concentrations of the stimuli. Proliferation studies showed that at the assayed concentrations, the viability of ECs was preserved (Data not shown). |
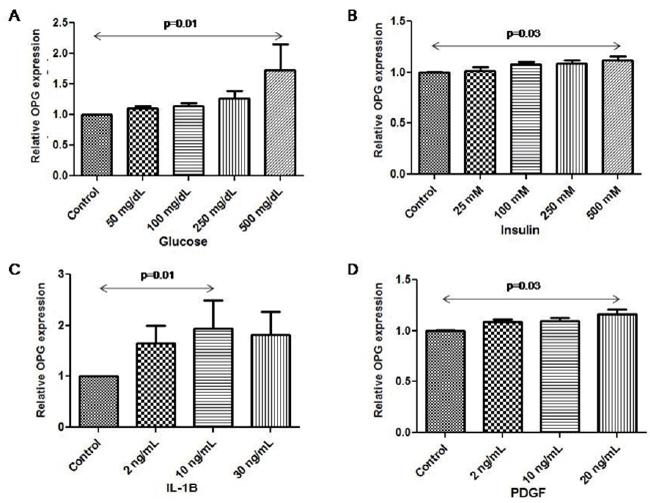
| OPG expression increased after stimulation with glucose, reaching a maximum at 500 mg/dL of glucose (1.0 vs. 1.2 (1.08, 2.6, p=0.01) (Figure 1A). |
| OPG expression increased after stimulation with increasing concentrations of insulin. The maximum concentration of the stimulus lead to the highest OPG expression (insulin 500 mM) (1.0 vs. 1.1 (1.05, 1.2, p=0.03) (Figure 1B). |
| OPG expression highly increased after stimulation with IL-1β. The maximum OPG expression was reached after stimulation with 10 ng/ mL of IL-1β (1.0 vs. 1.5 (1.2, 2.6), p= 0.01) (Figure 1C). |
| OPG expression increased after stimulation with PDGF. The maximum OPG expression was obtained after stimulation with 20 ng/ mL of PDGF (1.0 vs. 1.2 (1.1, 1.24), p=0.03) (Figure 1D). |
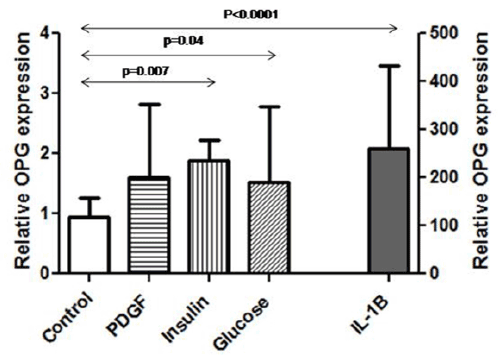
| OPG expression in endothelial cells was confirmed by RT-PCR and WB. Interestingly, OPG mRNA expression significantly increased by IL-1β stimulation (1.0 ± 0.1 vs. 272 ± 66, p=0.006). Furthermore, OPG was also higher when cells were stimulated with insulin (1.0 ± 0.1 vs. 1.8 ± 0.4, p=0.007) and glucose (1.0 ± 0.1 vs. 1.8 ± 0.4, p=0.05) (Figure 2). |
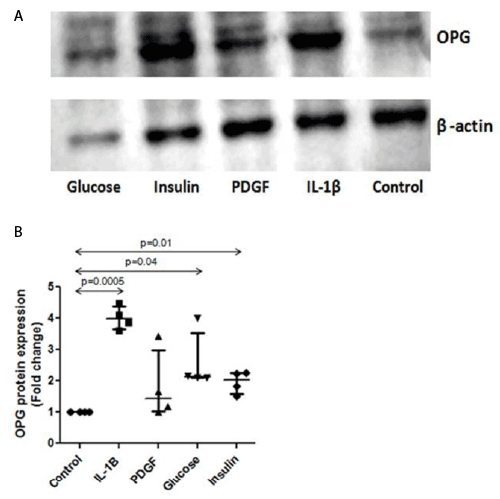
| OPG expression by WB (Figure 3A) was quantified by densitometry and normalized to β-actin expression. OPG expression significantly increased by stimulation with IL-1β (1.0 vs. 4.0 (3.7, 4.4) AU, p=0.0005). A significant increase was also observed when cells were stimulated with insulin (1.0 vs. 2.0 (1.6, 2.2) AU, p=0.01) and glucose (1.0 vs. 2.1 (2.1, 3.5) AU, p=0.04). OPG expression was higher in PDGF stimulated cells but the increase did not reach statistical significance (1.0 vs. 1.4 (1.1, 3.0) AU, p=0.24) (Figure 3B). |
| OPG secretion by endothelial cells |
| After stimulation of ECs, OPG released to the supernatant was quantified by ELISA. IL-1β significantly increased OPG release to the supernatant (4758 ± 727 vs. 88 ± 33.17 pg/mL, p=0.001) and PDGF also significantly elevated OPG concentration (451 ± 151 vs. 88 ± 33 pg/mL, p=0.009). Glucose and insulin did not modify OPG concentration in the supernatant (Figure 4). |
| Osteoprotegerin effects |
| We next evaluated whether OPG exerts any proinflammatory effect on ECs. IL-6, VCAM-1, ICAM-1, RANK and RANKL expression was assayed to study the expression under OPG stimulation. Dosedependency studies revealed that 50 ng/mL of OPG was an adequate concentration for subsequent stimulation of endothelial cells (Data not shown). |
| RANK mRNA expression in ECs was increased by OPG but it did not reach statistical significance (1.0 ± 0.1 vs. 1.25 ± 0.2, p=0.06). However, RANKL mRNA was not expressed in any of the conditions assayed. A non-significant increase in adhesion molecules expression was observed after OPG stimulation (VCAM-1 mRNA: (1.0 ± 0.4 vs. 1.2 ± 0.4) andICAM-1 mRNA: (1.0 ± 0.3 vs. 1.2 ± 0.5)). IL-6 mRNA expression increased by OPG stimulation but it did not reach statistical significance (1.0 ± 0.4 vs. 1.2 ± 0.4). |
| We next aimed to study whether IL-6 and IL-8 were released to the supernatant after OPG stimulation. OPG significantly increased the release of IL-6 (247±60 vs 148±30 pg/mL, p=0.008) to the supernatant. Furthermore, the release of IL-8 by ECs was also increased after OPG stimulation (1444±70 vs 1538±28 pg/mL, p=0.05). |
| Discussion |
| The main findings of the present study are 1) OPG is expressed in ECs, 2) OPG expression can be modulated and induced by several factor such as IL-1β, glucose and insulin, 3) OPG is released to the supernatant by IL-1β and PDGF and 4) OPG increases the proinflammatory milieu by increasing IL-6 and IL-8. |
| OPG is expressed in endothelial cells |
| OPG expression in ECs was studied by RT-PCR and WB. Besides, the expression of RANK mRNA was detected by RT-PCR while RANKL showed no expression either in baseline or stimulated samples. Different studies have confirmed OPG expression in different EC models [25-29]. However, differences mainly arise regarding RANK and RANKL expression and different ECs cell types as shown in the study by Cross et al. [30]. In that study, OPG expression was determined in HMVEC and HUVEC. Both cell types showed intracellular OPG expression, however, OPG mRNA expression was higher in HMVEC when compared to HUVECs. |
| OPG expression can be induced in endothelial cells |
| Among different potential cellular sources of circulating OPG, ECs appear to represent a major source of OPG not only under baseline conditions but also in response to inflammatory stimuli. Although the biological functions of intracellular OPG remain to be established, this may represent the OPG stored prior to release, or alternatively the unprocessed forms of the molecule [30]. |
| OPG modulation was induced by different stimuli: IL-1β, PDGF, insulin and glucose. IL-1β, glucose and insulin significantly increased OPG expression in ECs studied by RT-PCR. Moreover, the protein data by WB mirrored the RT-PCR results. Previous studies confirmed OPG increased expression by different inflammatory stimuli (TNF-α and IL- 1α) [25,31]. |
| Furthermore, a recently published study by our group [14] showed a positive and significant correlation between glucose and OPG suggesting a possible relationship. Apart from that, increased serum OPG levels are detected in patients with the metabolic syndrome [14], and in both DM types [10-13,26,32,33] reinforcing the idea of a positive relationship between glucose and OPG. |
| OPG secretion by endothelial cells |
| ECs were stimulated with different stimuli, and OPG released to the supernatant was quantified. IL-1β and PDGF significantly elevated OPG concentration in the supernatant. However, although insulin and glucose elevated mRNA OPG levels and OPG expression, OPG concentration in the supernatant was not increased under those conditions. This may suggest that OPG expression is increased but OPG release may be stimulated by other factors (such as inflammatory factors) in spite of by hyperinsulinemia and hyperglycemia per se. |
| In other studies, OPG secretion was confirmed in different ECs types under basal and stimulated conditions [25,26,29,30]. Treatment of ECs with inflammatory stimuli (TNF-α and IL-1β) resulted in a significant increase of OPG release detected by ELISA in the supernatant compared to controls [25]. The results from this study are in accordance with another study by Secchiero et al. [26] in which HUVECs were exposed to high glucose concentrations, insulin or inflammatory cytokines. Under these stimuli, OPG was secreted at measurable concentrations in the culture medium. However, in accordance with our study, neither high glucose levels nor insulin were able to significantly modulate basal OPG release. |
| Another important fact to be considered is the ECs type that may vary OPG secretion. Cross et al. [30] showed that HUVECs released relatively lower levels of OPG compared to HMVECs. |
| These results suggest that although OPG expression is increased under hyperglycaemia and hyperinsulinemia, its release to circulation is solely mediated by inflammatory stimuli. However, future studies will be needed to determine different possible mediators that stimulate OPG augmented release. |
| OPG effects in endothelial cells |
| It is not clear whether OPG is causally related to atherosclerotic disease progression and acute coronary events or rather serves as a marker of atherosclerotic disease burden, with high OPG levels being a modulatory response to subclinical CVD. |
| In human studies, OPG has been shown strongly associated with numerous CV risk factors and it is related to carotid atherosclerosis and an independent risk factor for CVD [1,3]. Besides, OPG has been directly and significantly correlated with IMT, a surrogate marker of atherosclerosis [14,17,18]. All these data show that OPG might play a role in the pathogenesis of atherosclerotic disease. |
| ECs were stimulated with OPG and subsequently different gene and protein expressions were analysed by RT-PCR. After OPG stimulation, RANK mRNA expression was upregulated whereas no RANKL expression was observed under basal or stimulated conditions. Inflammatory molecules such as IL-6 were not modified under stimulation with increasing OPG concentrations and neither were endothelial dysfunction markers (VCAM-1 and ICAM-1). Conversely to the mRNA analysis, ELISA quantification of various cytokines in the cells´ supernatant led to an increase in inflammatory molecules such as IL-6 and IL-8. |
| In accordance with this study, OPG did not influence the expression of adhesion molecules (ICAM-1, VCAM-1, P-selectin) in ECS in the study by Mangan et al. [34]. However, previous stimulation of HUVECs with TNF-α prior to OPG not only increased the surface expression of adhesion molecules but also increased the binding of monocytes in the presence of OPG. The functional importance of this effect is supported by the ability of OPG to promote monocyte adhesion to TNF-α activated ECs. Previous stimulation of ECs with an inflammatory stimulant prior to OPG addition would probably have concluded in different results. |
| Our study has some limitations that are worth considering. ECs were pulmonary artery vascular cells that are not the best and most accurate in vitro model. Carotid ECs should have been a most approximate model to study CV effects. Besides, studies in explanted ECs obtained from controls and patients would have been interesting to determine OPG expression in normal and pathological ECs. |
| In summary, ECs are a source of OPG in circulation and may be responsible for the increased observed in cardiovascular diseases. Furthermore, different stimuli are capable of inducing OPG release that subsequently contributes to the proinflammatory state that characterizes most cardiovascular diseases. |
| Acknowledgements |
| Thanks to the Cardiovascular Department of the Royal Hallamshire Hospital in Sheffield (England) especially to the Pulmonary Group. Financial support for this study was provided by the J.L. Castaño Foundation from the Sociedad Española de Química Clínica (SEQC), the Government of Navarra and the Asociación Española de Farmaceúticos Analistas (AEFA). |
References
|
Tables and Figures at a glance
| Table 1 |
Figures at a glance
 |
 |
 |
 |
| Figure 1 | Figure 2 | Figure 3 | Figure 4 |
Relevant Topics
- Analytical Biochemistry
- Applied Biochemistry
- Carbohydrate Biochemistry
- Cellular Biochemistry
- Clinical_Biochemistry
- Comparative Biochemistry
- Environmental Biochemistry
- Forensic Biochemistry
- Lipid Biochemistry
- Medical_Biochemistry
- Metabolomics
- Nutritional Biochemistry
- Pesticide Biochemistry
- Process Biochemistry
- Protein_Biochemistry
- Single-Cell Biochemistry
- Soil_Biochemistry
Recommended Journals
- Biosensor Journals
- Cellular Biology Journal
- Journal of Biochemistry and Microbial Toxicology
- Journal of Biochemistry and Cell Biology
- Journal of Biological and Medical Sciences
- Journal of Cell Biology & Immunology
- Journal of Cellular and Molecular Pharmacology
- Journal of Chemical Biology & Therapeutics
- Journal of Phytochemicistry And Biochemistry
Article Tools
Article Usage
- Total views: 13358
- [From(publication date):
December-2015 - Jul 04, 2025] - Breakdown by view type
- HTML page views : 8810
- PDF downloads : 4548
