Research Article Open Access
Octreotide Labelled Fluorescein Isothiocyanate for Identification of Somatostatin Receptor Subtype 2
| Ahmed AH Abdellatif* | |
| Department of Pharmaceutics and Industrial pharmacy, Faculty of Pharmacy, Al Azhar University, Assuit 71524, Egypt | |
| Corresponding Author : | Ahmed AH Abdellatif Department of Pharmaceutics and Industrial pharmacy Faculty of Pharmacy, Al Azhar University, Assuit 71524, Egypt Tel: +20 1016660069 Fax: +20 882148090 E-mail: Ahmed.abdellatif@hotmail.de, ahmed.a.h.abdellatif@azhar.edu.eg |
| Received September 15, 2015; Accepted October 08, 2015; Published October 15, 2015 | |
| Citation: Abdellatif AAH (2015) Octreotide Labelled Fluorescein Isothiocyanate for Identification of Somatostatin Receptor Subtype 2. Biochem Physiol 4:183. doi: 10.4172/2168-9652.1000183 | |
| Copyright: © 2015 Abdellatif AAH. This is an open-access article distributed under the terms of the Creative Commons Attribution License, which permits unrestricted use, distribution, and reproduction in any medium, provided the original author and source are credited. | |
| Related article at Pubmed, Scholar Google | |
Visit for more related articles at Biochemistry & Physiology: Open Access
Abstract
Cancer can be detected by certain signs and symptoms, it is can be investigated by medical imaging and confirmed by biopsy. Many tumor cells express some kind of receptor, e.g., somatostatin receptors. Somatostatin receptor-positive human tumors can be detected using labeled analogues of somatostatin. In vitro labeled octreotide (OCT) has been successfully used in the visualization of somatostatin receptor-positive tumors by flow cytometry. OCT was labeled with fluorescein isothiocyanate (FITC) to easy identify the somatostatin receptor subtype 2 (SSTR 2) in different living cell lines. The labelling of OCT was proceeded depending on the the difference of pKa of amino groups of OCT. The reaction was proceeded at pH 6 as the amino group phenylalanine has pKa 7.1 and the amino group of lysine has pKa 10.1. The labelling of OCT was confirmed by high performance liquid chromatography and mass spectrometry. The expression of somatostatin receptor in tumor cells was confirmed by incubation with FITC-OCT. All cells were positively expressed with SSTR2 in comparison with standard positive SSTR2. The labelled FITC-OCT is a promising model for identification of SSTR2. The tumor cell lines were choosed in this study were completely positive SSTR2.
| Keywords |
| Fluorescein isothiocyanate; Octreotide; Somatostatin receptor subtype 2 |
| Introduction |
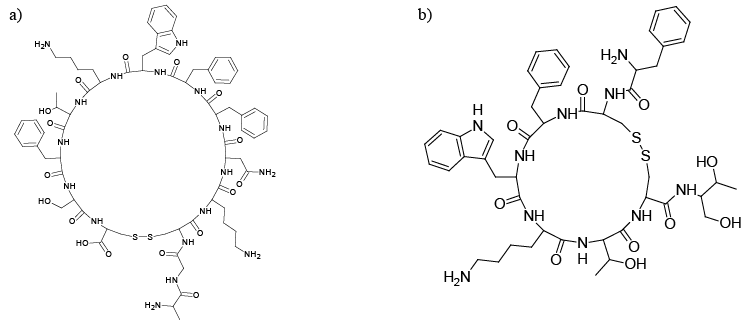
| Somatostatin receptors (SSTRs) are members of the GPCRs super family [1,2]. There are five different subtypes of SSTRs (SSTR1-5), SSTR2 having been classified into two subtypes, SSTR2A and SSTR2B [3,4]. The five receptor subtypes bind with the natural SST and its analogues (Figure 1a and 1b) with low nanomolar affinity, and produce defined biological effects in many normal and diseased cells [5]. The blocking of SSTRs with antagonist supresses the interaction of the peptide agonist with SSTRs [6]. |
| SSTRs are present in numerous normal and diseased cells [7,8]. They are expressed in normal tissues such as the pituitary gland, salivary glands, cerebellum, monocytes, parathyroid, thyroid, activated lymph nodes, vessels, lymphocytes, macrophages, spleen, gastric mucosa, duodenum, ileum, colon, pancreas, bronchial gland, testes, ovary, and myocardium. SSTR2A is especially expressed in the brain, pituitary, islet, stomach and kidney [4,9]. SSTRs are also expressed in many tumor cells i.e small cell lung cancer [10-12], neuroendocrine tumors [13], prostate cancer, breast cancer [14], colorectal carcinoma, gastric cancer and hepatocellular carcinoma [15]. SSTR2 is expressed in glucagonoma 1, glucagonoma 2 [16], metastatic lymph nodes [17], insulinoma 1, insulinoma 2, insulinoma 3 [16,18-20], normal adrenal gland, pheochromocytoma 1, pheochromocytoma 2 and pheochromocytoma 3 [21]. However, these expression of receptor is depended on the detection of recetor using antibody, RT-PCR, or may by labelling of somatostatin analogoue agonist or antagonist. |
| The majority of human cancer cells (benign or malignant), are generally positive for SSTRs [22] and are often characterized by the changing their surface receptors [23]. Many human cancer cells are known to express SSTRs, which are clinically used for tumor scintigraphy. For these reasons, the targeting of SSTRs, especially SSTR2, would be a promising target for cancer therapy using nanoparticulate delivery systems, reducing side effects and increasing the drug concentration in the tumor [24]. These indicated that the identification of SSTR may help to detect the cancer cells, this could be by comparing the expression of SSTRs for the same cells of normal and tumor cells which may overexpess this receptor. |
| Many studies reported that Octreotied (OCT) (Figure 1b) was delivered to cancer cells that express SSTRs [25]. OCT have been widely used to target tumor cells expressing SSTRs for therapy using radionuclides such as 90-Y or 177-Lu [26]. It was reported that some SST analogues are labeled with radionuclide (i.e. 111-In, 90-Y, 177- Lu, 68-Ga) and injected intravenously, showed a reduction of tumor growth [27]. Radio-materials labeled SST analogues, i.e. glucose-Tyr3- octreotate and DOTA-Tyr3-octreotate radiolabeled with 111-In, 177- Lu and 125-I, were used for the imaging and treatment of tumor cells expressed SSTRs [28]. OCT was conjugated to micellar nanoparticles for the targeting of specific malignant tumor cells [29,30]. |
| It is beneficial to label the OCT, in order to easy bioimaging and receptor detection. In the current study, our aim was to confirm the expression of SSTR2 in different cell lines. Therefore, FITC-labeled OCT was synthesized and characterized by HPLC, ESI-MS and MALDI-ToF spectrometry. The synthesized FITC-OCT was incubated with different cell lines expressed SSTR2 to confirm the expression of SSTR2. |
| Materials |
| Octreotide acetate (OCT) was purchased from ChemPep (Wellington, USA). Fluorescein isothiocyanate isomer ≥ 90% (HPLC), and albumen bovine serum were purchased from Sigma aldrich (Steinheim, Germany). Dulbecco`s phosphate buffered saline (pH 7.4), Dulbecco’s Modified Eagle Medium, and Leibovitz’s L-15 were purchased from invitrogen, (Paisley, UK). Somatostatin sense and antisense were purchased from Eurofins MWG Operon (Ebersberg, Germany). Acetonitrile, Coomassie brilliant blue G-250 and N,NDiisopropylethylamine (DIPEA) were purchased from Sigma-Aldrich (Taufkirchen, Germany). Different cell lines were kindly supplied from (Haematology and Internal Oncology, Regensburg University, Germany). Pancreatic carcinoid tumor cells were kindly supplied from Novartis Institutes (Basel, Switzerland). |
| The purified water used for all experiment was obtained using a Milli-Q water purification system from Millipore (Schwalbach, Garmany). |
| Methods |
| Labelling of octreotide OCT with fluorescein isothiocyanate (FITC) |
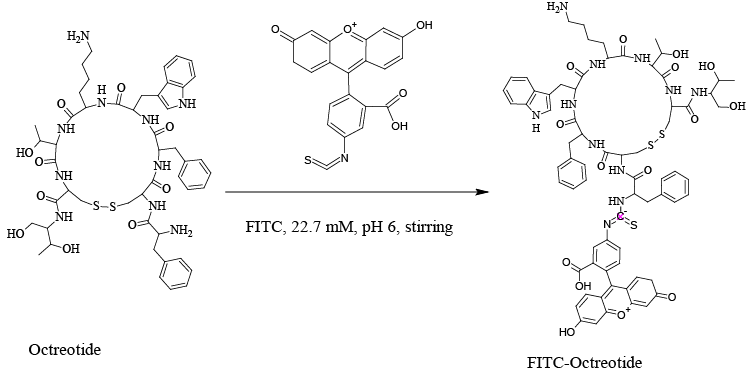
| OCT was labelled with FITC to easily identify the somatostatin receptor subtype 2 (SSTR2) in different living cell lines. The procedure of labelling was preceded according to the previously reported method [32,33]. In brief, FITC was dissolved in dimethyl formamide (DMF) at 10 mg/mL. 88.7 μL of 22.7 mM of FITC from FITC-stock solution was taken, and then put in 1.8 mL Cryo freezing vials. To them, 100 μL of 1.91 mM OCT was added and stirred at 600 rpm overnight in a dark place. The working volume was 0.5 mL. The FITC-OCT was purified by HPLC reversed phase using C18 column as shown in Figure 2. |
| Characterization of FITC-OCT |
| HPLC analysis: The HPLC method for OCT and FITC-OCT was proceeded according to the previously validated reported method [34]. HPLC analysis was performed for OCT and FITC-OCT using a system with a Degasser (Knauer, Berlin, Germany), LC-10AT pump, FCV-10ATVP gradient mixer, SIL-10ADVP autosampler, CTO-6A column oven, SPD-10AV UV-detector and SCL-10AVP controller (all Shimadzu, Duisburg, Germany). Chromatograph of mono-labeled FITC-OCT was obtained using a C18-reversed phase analytical column, using a linear gradient from 26% to 39% acetonitrile in water, with 0.1% TFA, as mobile phase at a flow rate of 1.0 mL/minute over 5-15 minutes. A UV detection at 280 nm recorded chromatographs. |
| Electrospray ionization mass spectrometry ESI-MS: Spectroscopy was utilized for the determinations of the molecular weight of OCT, and FITC-OCT as previously reported methods [35-37]. Typically samples dissolved in water and directly injected directly in the spectrometer using a sample loop directly attached to the ion spray unit. Alternatively, samples were additionally separated prior to their investigation by MS using a Hewlett-Packard HPLC system with series 1100 degasser, binary pump, autosampler, column oven and DAD (all from Hewlett- Packard, Waldbronn, Germany) and reversed phase columns (Sigmaa Aldrich Discovery Bio Wide Pore C18, 300Å, 100* 2.1 mm, Munich, Germany) for the separation. All mass spectra were obtained using the TSQ7000 ESI- mass spectrometer (ThermoQuest, San Jose, USA) using detection ranges of 400 to 12000 for the FITC-OCT. |
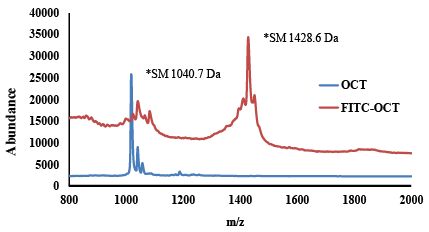
| Matrix assisted laser desorption/ionization-time of flight mass spectroscopy for identification the labelling of FITC to OCT: The average molecular weight of FITC-OCT was determined using MALDI-ToF mass spectrometry as previously reported methods [38,39]. The samples were prepared in water and mixed with matrix (indoleacrylic acid in THF). Additionally, 0.05 mg/mL potassium trifluoroacetate in THF was added in order to improve the ionization. The investigated FITC-OCT was analysed in the range of 800-2000 m/z. The samples were prepared on the target by depositing 1 μL of FITCOCT of the solution and matrix solution in the ratio of 1:3. Then, the deposited samples were dried under vacuum at room temperature. The accelerating voltage was set to 20 kV and ionization was conducted with a 337 nm nitrogen laser. Spectra were analysed using the Voyager 5.0 software integrated in the Applied MALDI-ToF system (Weiterstadt, Germany). |
| Identification of SSTR2 in cell lines |
| Identification of SSTR2 using OCT tagged fluorescein isothiocyanate: To identify the SSTR2, different cells lines were seeded in a 24-wellplate at a density of 100,000 cells/well in complete growth medium and allowed to grow for 2 days, with medium changed once. Then the medium was removed. Cells were washed with Dulbecco’s phosphate buffer (DPBS) and incubated with FITC-OCT at 20 nM for 1 hour at 37oC. After incubation, FITC-OCT was removed. The cells were washed with DPBS and trypsinized. The cells were centrifuged at 300 ×g at 4oC. Then resuspended in FACS staining buffer for a final flow cytometric analysis. FITC-OCT was excited at 498 nm and emission was measured at 518 nm. |
| Reverse transcription polymerase chain reaction: The mRNA expressions of SSTR2 were determined using RT-PCR. Standard method was carried out as reported previously [40,41]. RNA was isolated from cultured cells by phenol–chloroform extraction method using Trizol (Trizol is an aqueous solution of phenol and guanidinium isothiocyanate). Addition of chloroform resulted in a phase separation into three layers. After centrifugation, the upper aqueous phase contained mRNA, the intermediate phase contained the hydrophilic proteins and DNA, the lower organic phase contained lipophilic proteins and lipids [42]. RT-PCR measurements were conducted to identify the SSTR2 expression on BON-1 cells, HeLa cells, U-87 cells, L929 cells and MCF-7 cells. |
| The following protocol describes the isolation of RNA from different cells [43] |
| 1 mL of Trizol was used to lyse each cell in each well (5 mL for T-75 flask or 1 mL for 10 cm2 culture area, for 5 minutes at room temperature). The cells were scrapped with a cell scraper then transferred into 2 mL Eppendorf tubes. 200 μL of a mixture of (chloroform to water 3:1) were added for the lysed cells, the cells mixed well and centrifuged at 12,000 xg at -4°C for 15 minutes. The aqueous layer was transferred into a new 1.5 mL Eppendorf tube (it contained RNA). 500-μL isopropanol were added to aqueous layer and vortexed at room temperature for 10 minutes, and then centrifuged at 12,000 x g and 4°C for 20 minutes. The supernatant was decanted carefully and the precipitate was washed with 1 mL of ethanol (with 75% Ribonuclease (RNAse) water free) and then centrifuged again at 9,500 xg at 4°C. Supernatant was decanted carefully, and the collected RNA washed again with water to remove the remaining ethanol. Depending on the yield, RNA was suspended in a 15-25 μL RNase-free water release, and then incubated for 1 minute at 65°C and 400 rpm in shaker. RNA was frozen in either -80°C or further processed on ice. 2 μg of mRNA were reverse-transcribed to cDNA by using the following primers (sense: 5’-CGG AGTG ACAGT AAGC GGA-3’, antisense: 5’-GGAA GCCAGTGTGGGTAGG -3’). Sequences related to G protein-coupled receptors were amplified by using PCR and the degenerate oligonucleotide primers described previously. For the quantification of SSTR2-mRNA expression, RT-PCR was performed using a Light Cycler Instrument (Roche Diagnostics, Mannheim, Germany) and a Light Cycler 480 SYBR Green I Master (Roche Diagnostics). |
| Results and Discussion |
| Characterization of OCT labelled with fluorescein isothiocyanate |
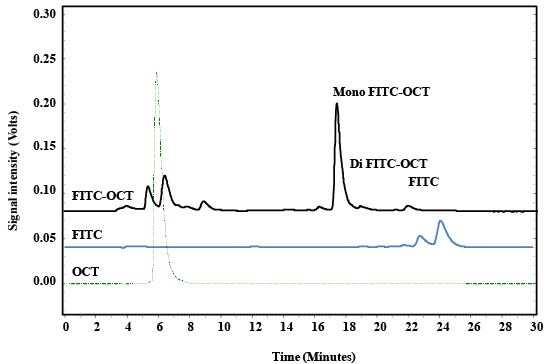
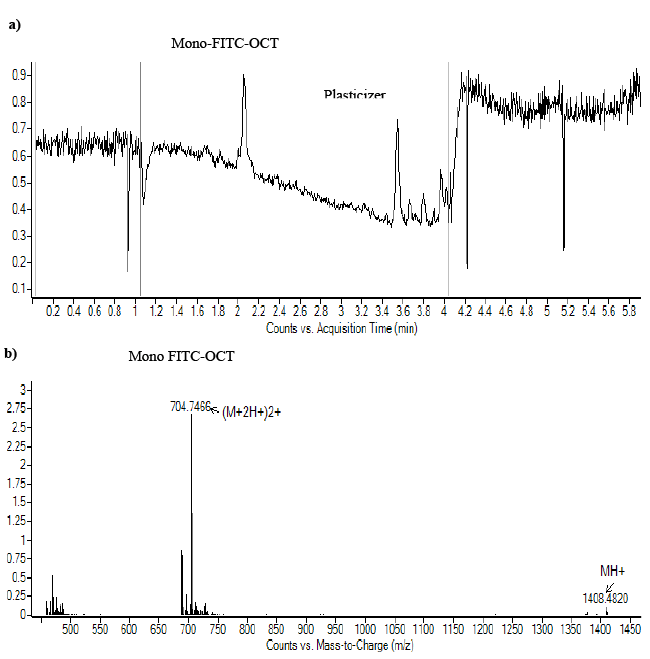
| The results obtained by HPLC is depended on the the previously validated method [34,44]. The chromatograph of labeled FITC-OCT showed four characteristic peaks that eluted after about 6.1, 17.9, 18.5 and 22.5–25.5 minutes, these peaks are related to OCT, mono labbeled OCT, di labeled OCT and FITC respectively (Figure 3). The peak at 6.1 minutes corresponds to OCT as compared with reference OCT. The sharp peak at 17.5 minutes corresponds to the mono-labeled OCT followed with di-labeled OCT that eluted at 18.5 minutes, and the last peaks stem from the excess of non-bound dye. The peak eluted at 17.5 minutes that contained mono-labeled FITC-OCT was collected in vials. The strong increase of the fluorescence signal after labeling with FITC indicated the success of the reaction. The sample was dried to remove the acetonitrile and redissolved again in Millipore water. The product molecular weight was analyzed by ESI-MS spectroscopy. The HPLCMS analysis for FITC-OCT are shown in (Figure 4a and 4b). |
| The HPLC chromatograph of Figure 2a showed one major peak that eluted after about 2.1. The respective mass spectrum showed only one characteristic peak corresponding to the molecular weight of mono-labeled OCT, since mono-labeled OCT showed an increase in molecular mass of about 389 Da (Figure 4b). These results confirmed those obtained by RP-HPLC. In addition, the labeling of OCT with FITC was confirmed by MALDI-ToF mass spectroscopy as shown in Figure 5. The results matched the theoretical calculation and showed an increase in the molecular weight of OCT by molecular mass of FITC which is about 389 Da indicating that the labelled OCT was mono labelling in amino group phenyl alanine. The results indicated by MALDI-ToF showed 20 Da excess than in ESI-MS, this is due to attaching of some ions to the product. The same increase showed also on OCT by MALDI-ToF which showed excess on Mol.wt. 21 Da. The monolabelled OCT can identify the expression of SSTR2 which may help in the detection of tumor cell overexpressed SSTRs. The selectively in reaction on amino group of phenyl alanine, due to the amino group of pheny alanine reactive on pH 7 as its pKa 7.1, while the amino group lysine has pKa of 10.1 which make it reactive at pH 10.1 [44]. |
| Identification of SSTR2 in different cell lines using FITClabelled OCT |
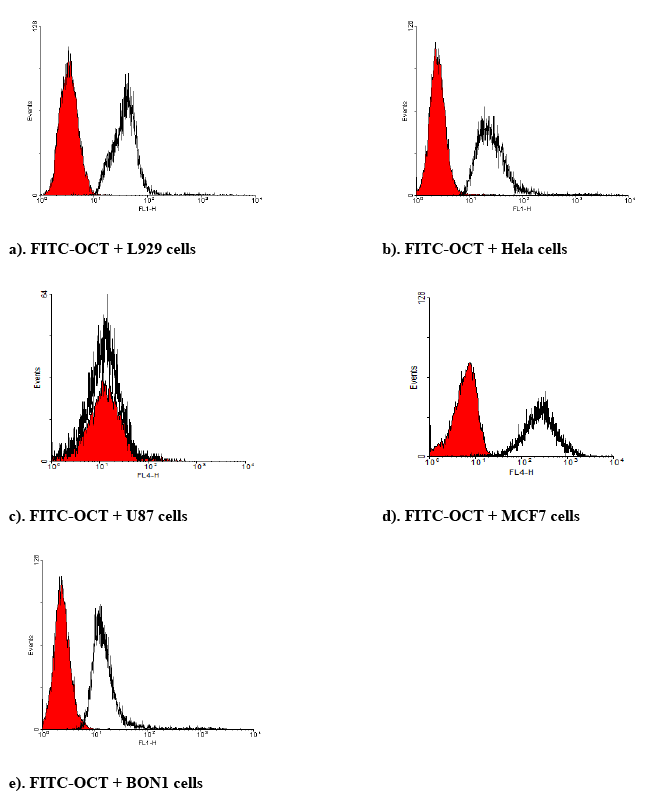
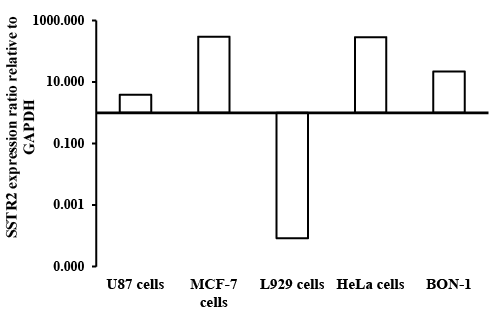
| BON-1 cells positive expression of SSTRs as reported previously [45]. These results compared BON cells to the cells that are higher expression of SSTRs, while the U87 cells can be conseder as nagative control. FITC-labeled OCT, and RT-PCR were used to determine the presence of SSTR2 in different cell lines. The expression of SSTR2 in HeLa cells, MCF7 and L929 cells was significant as illustrated by binding of FITC-OCT as shown in Figure 6. In addition, BON-1 cells served as positive control [45]. Besides, the study showed that the mRNA level of SSTR2 was significantly higher in MCF-7 cells and HeLa cells than positive control BON-1 cells. The high binding to HeLa cells compared to BON-1 could serve as an indicator for specific binding with FITCOCT. This suggests that SSTR2 can bind SST or SST analogues. The expression of mRNA using RT-PCR in L929 cells did not work (Figure 7), this could be due to the sense and antisense that were optimal for human receptor, while L929 stem were obtained from mice origin. Additionally, the study showed the mRNA level of SSTR2 in U-87 cells was very low. |
| The results showed that binding of FITC-OCT to HeLa cells, L929 cells and MCF7 cells showed higher binding as compared to BON-1 cells. Additionally, these higher binding of FITC corresponds to the results obtained with the expression of SSTR2 by RT-PCR or FITCOCT. Moreover, just as it was found weak expression of mRNA in U-87 cells by RT-PCR, the study also showed also weak binding for FITCOCT with U-87 cells as compared with HeLa and other cell lines. These results confirm that the better binding with FITC-OCT due to a higher concentration of SSTR2 in the mentioned cells. |
| Conclusion |
| The study confirmed that the binding of FITC-OCT to cell lines due to the expression of SSTR2 confirmed by RT-PCR. These results confirm that the expression of SSTR2 on the cancer cells can be detected using OCT-FITC which can be used as tumor bio-imaging. |
References
|
Figures at a glance
 |
 |
 |
 |
| Figure 1 | Figure 2 | Figure 3 | Figure 4 |
 |
 |
 |
|
| Figure 5 | Figure 6 | Figure 7 |
Relevant Topics
- Analytical Biochemistry
- Applied Biochemistry
- Carbohydrate Biochemistry
- Cellular Biochemistry
- Clinical_Biochemistry
- Comparative Biochemistry
- Environmental Biochemistry
- Forensic Biochemistry
- Lipid Biochemistry
- Medical_Biochemistry
- Metabolomics
- Nutritional Biochemistry
- Pesticide Biochemistry
- Process Biochemistry
- Protein_Biochemistry
- Single-Cell Biochemistry
- Soil_Biochemistry
Recommended Journals
- Biosensor Journals
- Cellular Biology Journal
- Journal of Biochemistry and Microbial Toxicology
- Journal of Biochemistry and Cell Biology
- Journal of Biological and Medical Sciences
- Journal of Cell Biology & Immunology
- Journal of Cellular and Molecular Pharmacology
- Journal of Chemical Biology & Therapeutics
- Journal of Phytochemicistry And Biochemistry
Article Tools
Article Usage
- Total views: 14798
- [From(publication date):
December-2015 - Jul 09, 2025] - Breakdown by view type
- HTML page views : 10107
- PDF downloads : 4691
