Research Article Open Access
Observations of an Extra-Large Subsurface Anticyclonic Eddy in the Northwestern Pacific Subtropical Gyre
Feng Nan1, Fei Yu1,2*, Chuanjie Wei1, Qiang Ren1 and Conghui Fan11Institute of Oceanology, Chinese Academy of Sciences, Qingdao, China
2University of Chinese Academy of Sciences, Beijing, China
- Corresponding Author:
- Dr. Fei Yu
Institute of Oceanology
Chinese Academy of Sciences
7 Nanhai Road, Qingdao 266071, China
Tel: (86)053282898187
Fax: (86)053282898186
E-mail: yuf@qdio.ac.cn
Received Date: July 05, 2017; Accepted Date: July 26, 2017; Published Date: July 30, 2017
Citation: Feng Nan, Yu F, Wei C, Ren Q, Fan C (2017) Observations of an Extra-Large Subsurface Anticyclonic Eddy in the Northwestern Pacific Subtropical Gyre. J Marine Sci Res Dev 7:234. doi: 10.4172/2155-9910.1000234
Copyright: © 2017 Feng Nan, et al. This is an open-access article distributed under the terms of the Creative Commons Attribution License, which permits unrestricted use, distribution, and reproduction in any medium, provided the original author and source are credited.
Visit for more related articles at Journal of Marine Science: Research & Development
Abstract
An extra-large subsurface anticyclonic eddy (SAE) with horizontal scale of 470 km was detected in the northwestern Pacific subtropical gyre by in situ measurements in October 2014. The SAE exhibited a lens-shaped vertical structure with shoaling of the seasonal thermocline and deepening of the main thermocline. Consequently, the water in the eddy core was colder above 200 m and warmer below 200 m than the surrounding waters with maximum temperature anomalies of -1.2°C and 3.5°C located at ~100 m and ~450 m depths, respectively. The central water mass of the SAE was characterized as low potential vorticity water, i.e., the north Pacific Subtropical Mode Water (STMW). Swirl velocity of the SAE was directly observed by ship-mounted ADCP (Acoustic Doppler Current Profilers). The maximum azimuthal velocity reached 0.35 ms-1 near a 110 km radius at ~ 200 m depth, which was comparable with the maximum velocity of the northward Kuroshio east of Taiwan at the same depth. Threedimensional structure and evolutionary process of the SAE were also presented using Argo float profile data as well as the satellite altimeter data. The results indicated that the SAE was generated in the region of the STMW in February, then propagated westward over 1500 km at a mean speed of ~0.06 ms-1 and finally disappeared east of Taiwan in December, transporting ~0.5 Sv (Sv=106 m3s-1) STMW.
Keywords
Subsurface eddy; Mode water; Kuroshio; Potential vorticity
Key Points
• An extra-large subsurface anticyclonic eddy with horizontal scale of 470 km in the northwestern Pacific was detected by in situ measurements in October 2014.
• Three-dimensional structure and evolutionary process of the subsurface eddy were presented using Argo profiling data as well as satellite data.
• The subsurface eddy carrying the Subtropical Mode Water propagated westward over 1500 km.
Introduction
Mesoscale eddy is ubiquitous in the world ocean, playing important roles in the ocean general circulation, mixing, and transport of heat, salt, water mass, momentum, nutrients and biological species [1-4]. Utilizing remote sensing data, surface-intensified eddy properties, such as distribution, size, amplitude, polarity, lifetime, etc., have been relatively clear [1,6]. In addition to the surface-intensified eddy, there exists subsurface-intensified eddy in the Ocean. Subsurface eddy is a special class of oceanic eddy that has its cores (maximum temperature/salinity anomalies and azimuthal velocity) in the subsurface layer typically located between 100 and 1000 m depth [5,7,8]. Subsurface eddy often exhibits a completely distinct vertical structure compared with surface eddy, i.e., a lens-shaped vertical structure [9,10]. Subsurface eddies have been occasionally detected in the world ocean. Several subsurface eddies were observed in the Southeast Pacific [11,12]. Based on highresolution model results [13], indicated that the subsurface field in the Southeast Pacific is dominated by anticyclonic eddies and triggered by the instability of the Peru-Chile Undercurrent. These subsurface anticyclonic eddies (SAEs) play an important role in the near-coastal salinity, oxygen, and nutrient distributions [14]. Pelland et al. [15] detected 20 SAEs and 10 subsurface cyclonic eddies (SCEs) in the California Current System associated with the California Undercurrent. In the North Atlantic, subsurface eddy containing a clockwise rotating core of warm salty water were often found and named “Meddies” [16,17]. It was characterized as the Mediterranean Water from the eastern Atlantic [18].Subsurface eddy were also observed in other regions, such as the Japan Sea [19], the southwestern South China Sea [20], the Bay of Bengal [21], the southeastern Baltic Sea [22], the southern Indian Ocean [23], the Sargasso Sea [24], Gulf of Mexico [25]. Recently, 1073 SAEs were detected in the global ocean based on available Argo profiles by [26]. Most of these SAEs are located near the regions of mode water formation and strong subsurface currents in the subtropical area. Assassi et al. [10] summarized some possible formation mechanisms for subsurface eddy. However, compared with surface eddy we know little about the subsurface eddy due to lack of in situ observations until now.
Statistical analyses based on satellite altimeter data show that northwestern Pacific Ocean is a region with a high probability of surface eddy occurrence [27,28]. Surface eddy occurrence frequency and kinetic energy are prevailingly high in the Kuroshio Extension region east of Japan and in the Subtropical Countercurrent zonal band [27]. However, subsurface eddy is poorly understood in this region. Only few subsurface eddies have been observed based on sporadic observation. In the northwestern Pacific Ocean, subsurface eddy with lens-shaped vertical structure was firstly reported by Maximenko and Yamagata [29] south of the Subarctic Front. In 2001, two subsurface eddies (a cyclonic and an anticyclonic) were observed in the southeast of Okinawa Island by Zhu et al. [30] using pressure-recording inverted echo sounders (PIESs). The maximum temperature and salinity anomalies appeared at ~ 500 m ranging through about ± 2° Cand ± 0.2 psu, respectively. A SAE was detected southeast of the Ryukyu Islands in February 2002 by Takikawa et al. [31]. The SAE is located at about 300 m with extraordinary features. Thickness and width of the eddy are about 300 m and 100 km, respectively. The water mass in the subsurface eddy core is characterized as the north Pacific Subtropical Mode Water (STMW). In fall 2008, Oka et al. [32] captured a SAE in the subtropical northwestern Pacific Ocean. It is with thickness of 150 m and diameter of 40 km at ~500 m depth. This SAE contains the north Pacific Central Mode Water (CMW) characterized as low potential vorticity (PV). Two subsurface eddies (one SAE and one SCE) with horizontal length scale of ~20 km were observed by rapid-sampling Argo floats by Zhang et al. [33]. According to the previous studies, subsurface eddies play an important role on the subsurface circulation, the water mass properties, and vorticity redistribution in the northwestern Pacific, which should be paid further attention.
In this study, we reported an extra-large SAE with horizontal scale of 470 km observed in the northwestern Pacific subtropical gyre. Vertical structure of the SAE was directly observed. In addition, its three-dimensional structure and evolutionary process were presented using Argo float profile data as well as the satellite altimeter data. It is proved to be generated in the region of the STMW based on its water mass characteristics. The rest of the paper is organized as follows. Section 2 describes the data and methodology. Section 3 presents the observational results on the subsurface eddy. Section 4 discusses influences of the eddy on the STMW transport. Finally, Section 5 summarizes the main findings.
Data and methods
Satellite data and eddy identification
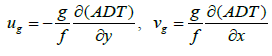
The Absolute Dynamic Topography (ADT) and Sea Level Anomaly (SLA) data by satellite altimeter were used in this study to show the background circulation in the northwestern Pacific (Figure 1) and to identify the eddy (Figure 2), respectively. The datasets merged all available satellites are produced by the French Archiving, Validation, and Interpolation of Satellite Oceanographic (AVISO) data project. Daily averaged frames are interpolated onto a global grid of 1/4° resolution from 1993 to the present. As in ref. 34 the data in areas where the water depth is less than 200 m were excluded to minimize the aliasing effects due to tides and internal waves. The surface horizontal geostrophic velocities (ug and vg) can be derived from ADT as the following,
 (1)
(1)
Where g is gravitational acceleration and f is the Coriolis parameter.

Figure 1: Mean ADT (units: m) in the northwestern Pacific derived from the satellite altimeter data in 2014 showing the large-scale circulation. Solid dots represent the XCTD stations along 23ºN section east of Taiwan during observational period of 1-3 October 2014.
Mesoscale eddy can be identified as closed-contour SLA (see 0.25 m contour in Figure 2 that has a single extremum in each satellite snapshot following Faghmous et al. [6]. It can be tracked by associating a feature in one time-step to the nearest feature in the subsequent one. Based on SLA data, eddy evolutional processes are shown in Figure 3. The eddy area A represents the area delimited by the outmost contour of the eddy, and its radius R represents the radius of an equivalent circular eddy having the same A, i.e., R=(A/π)1/2.

Figure 2: Mean SLA (black contours and color shades, units: m) during the period of 1-3 October 2014. Thick black contour of 0.25 m represents the outermost closed SLA contour associated with the eddy center. Solid dots represent the XCTD stations along 23ºN section east of Taiwan. Blue line represents the eddy trajectory, while pink line is the PV contour of 2 × 10⁻¹⁰ m-1 s-1 on the core layer of STMW (25.3 σθ) indicating the STMW region in February 2014.

Figure 3: Snapshots of the SLA (black contours and color shades, units: m). Thick black contours represent the outermost closed SLA contour associated with the SAE.
Hydrological data
In situ temperature and salinity data with vertical resolution of 1 m above 800 m are obtained by means of expendable conductivitytemperature- depth (XCTD) aboard the Research Vessel ‘Kexue’. The XCTDs were manufactured by the Tsurumi Seiki Co. There are 17 stations at 0.5° intervals along 23°N between 122°E and 130°E during the period of 1-3 October 2014 (Figure 1). Vertical distributions of velocities along 23°N section are also obtained by the 38 kHz SADCP (ship-mounted Acoustic Doppler Current Profilers) manufactured by Teledyne RD Instruments. The data-sampling rate was set to one ping per 3 s, and bin length set to 16 m. Ship speed during the survey was approximately 13 knots. The misalignment between ADCP transducers and the ship’s GPS gyrocompass has been calibrated carefully since small misalignments can generate significant velocity errors [35]. Vertical scale of the mesoscale eddy can be detected by the presence of large horizontal speeds accompanied by T-S anomalies Zhao et al [34]. According to previous works, this speed criterion is set to be 0.1 m s-1, which is faster than the tidal flow speeds in the open ocean.
Argo data
To composite the three-dimensional structure of the eddy, Argo profiling float data relative to the eddy were download from the Argo Data Management site http://www.argodatamgt.org/. There are 412 T-S profiles within a radius of 300 km to the eddy center from February to December (Figure 4). The Grid Point Value of the Monthly Objective Analysis (MOAA GPV) based on Argo profiling float data was also used to show the mean PV of 2 × 10⁻¹⁰ m-1s-1 on the core layer of STMW (~25.3 σθ) indicating the region of the STMW in February 2014 (Figure 2). The MOAA GPV data is a global 1°×1° grid dataset of monthly temperature and salinity fields from January 2001 to the present [36].

Figure 4: (a) Geographic distributions of Argo profiles within a radius of 300 km from the SAE center. Blue line represents the eddy trajectory. (b) Geographic distributions of Argo profiles relative to the SAE center using an eddy-following coordinate system (Δx, Δy).
Results
Observations
As shown in Figure 2, an anticyclonic eddy was captured south of Ryukyu Islands in the northwestern Pacific by satellite altimeter data during the period of 1-3 October 2014. The maximum SLA in the eddy core reaches 0.4 m. Following the eddy identify method of Faghmous et al. [6], the 0.25 m SLA contour is selected as the boundary of the eddy because it is the outmost contour and there is a single extremum inside it. The eddy is quasi circular with horizontal scale of 470 km identified by SLA larger than 0.25 m. According to Yang et al. [27], the mean diameter of surface eddy in the subtropical northwestern Pacific gyre is about 280 km. Surface eddies with diameter larger than 400 km are rare. Fortunately, this large eddy was also detected by XCTD stations along 23°N east of Taiwan which approximately traversed the eddy core (Figure 2). Thus the vertical structure of the eddy was captured by in situ observations. Figure 5 shows the vertical distributions of temperature, salinity, potential density, and its anomalies along 23°N section. The temperature and salinity anomalies are calculated referenced to the climatological temperature and salinity in October along 23°N section derived from WOA13. Note that the large anomalies above the mixed layer have been masked. Interestingly, the eddy exhibits a lens-shaped vertical structure significantly different from the general vertical structure of surface anticyclonic eddy. The seasonal thermocline/halocline/ pycnocline shoals in the eddy center from 124°E to 128°E, while the main thermocline/halocline/pycnocline deepens in the eddy center, which is the typical characteristic of subsurface eddy. Consequently, the water in the eddy core is colder above 200 m than that in the surrounding areas, while it is warmer below 200 m. The maximum negative (-1.2°C) and positive (3.5°C) temperature anomalies appear at ~100 m and ~450 m depths, respectively (Figure 5a). The patterns of salinity anomalies are obviously different. It has been known that there exist subsurface salinity maxima at ~200 m depth called North Pacific Tropical Water (NPTW) and salinity minima at ~500 m depth called North Pacific Intermediate Water (NPIW) in the northwestern Pacific subtropical gyre (Figure 5b) [37]. In the SAE core, the NPTW above 200 m is uplifted, while the NPTW below 200 m and the NPIW are depressed. Thus, there exist two salinity anomaly maxima and a weak minima in the eddy core at 100 m (0.25 psu), 450 m (0.25 psu), and 700 m (-0.1 psu) depths, respectively. This extraordinary structure of the subsurface eddy in this region has been noticed by Takikawa et al. [31]. They indicated that the reason for the special structure is because the eddy carried the STMW characterized with nearly uniform temperature (16-19°C) and low PV (<2 × 10⁻¹⁰ m-1s-1). This point will be discussed in the subsection 3.3. Note that the observed SAE in this study is much larger than those subsurface eddies and most surface eddies in this region detected by previous researchers [27,31-33].

Figure 5: Longitude-depth sections of (a) temperature (units:°C), (b)salinity (units: psu), (c) potential density (σθ), and its anomalies (color shading) compared with climatological mean values in October from WOA13 through the SAE at 23ºN east of Taiwan. Dots at the top of the figure indicate the locations of the hydrographic observations (Figures 8 and 10). Data above the mixed layer have been blanked.goff
The eddy swirl velocity was directly observed by SADCP aboard the Research Vessel ‘Kexue’ (Figure 6a) [38]. Not surprisingly, the maximum swirl velocity (0.35 ms-1) appears at ~200 m depth near a 110 km radius from the eddy center. Here the tide effect on the observed velocity was neglected since tidal currents away from the major topography in the open ocean are weak [39]. The diameter of the subsurface eddy is ~460 km and its depth can extend to 700 m identified by velocity contours larger than 0.1 ms-1. The horizontal scale of the SAE is consistent with that detected by satellite altimeter data (Figure 2). According to Figure 6a, the maximum swirl velocity of the subsurface eddy tends to be comparable to the maximum northward Kuroshio velocity east of Taiwan at the same depth (200 m). The radius of the subsurface eddy is even larger than the Kuroshio width (~100 km) east of Taiwan. Effects of the SAE on the Kuroshio east of Taiwan remain unclear.

Figure 6: Longitude-depth sections of (a) meridional velocity (units: m s-1) observed by SADCP and (b) normalized relative vorticity (ζ/f) at 23ºN east of Taiwan.
Three-dimensional structure
Three-dimensional structure of such subsurface eddy in this region has never been shown by previous researchers due to the lack of in situ observations [29-33]. However, Argo data provided us an invaluable tool to composite three-dimensional structure of the subsurface eddy. There are total 412 T-S profiles within a radius of 300 km from the observed SAE center during its evolutional processes from February to December. These T-S profiles were interpolated onto a regular grid of 25 × 25 km2 using the same mapping technique as Qiu et al. [40]. The Gaussian weight function for mapping has a form of exp (-Δx2/2Lx2-Δy2/2Ly2), where Δx and Δy are the zonal and meridional distances between a data point and the grid point. Lx and Ly are chosen as 50 km based on sparseness of the Argo profiles (Figure 4b). Thus, three-dimensional structure of the subsurface eddy was composited as shown in Figure 7. Temperature and salinity anomalies were calculated by minus the mean values at different indicated depths from 50 to 1000 m. Dynamical height and geostrophic velocities were computed taking 2000 m as the reference level. The results shown in Figure 7 are almost consistent with the result of Figure 5 and Figure 6a except for some quantitative differences. According to Figure 7, the SAE is quasi symmetric and rotates anticyclonicly. The water in the eddy core is colder above 200 m and warmer below 200 m than those of the surrounding waters. Two salinity anomaly maxima and one weak minima in the eddy core are also clear. The maximum temperature and salinity anomalies reach 3.5°C and 0.25 psu at ~450 m depth relative to its environment, respectively. Three-dimensional structure of the geostrophic velocity was also shown in Figure 7. The maximum geostrophic velocity (~0.30 m s-1) appears at ~200 m, similar to the observed velocity by SADCP (Figure 6a). It has a more slowly rotating center. Note that the pattern of temperature/salinity anomaly is asymmetric at 50 m. That is possibly because the period of the Argo profiling data relative to the SAE lasted for 10 months from February to December. Seasonal variation of the temperature and salinity may cause biases above the mixed layer. This is also why the values above the mixed layer are blanked in Figure 5. It is worth emphasizing that to display the three-dimensional structure of the subsurface is of vital importance for better understanding of subsurface eddy dynamics.

Figure 7: Objective interpolation onto a regular grid (25 × 25 km2) of (a) temperature anomalies (units:°C) and (b) salinity anomalies (units: psu) at 50 m, 200 m, 450 m, 700 m, and 1000 m depths based on gridded T-S profiles with vectors of the geostrophic flow.
Potential vorticity and origin
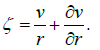
According to Figure 2 and Figure 7, the SAE is quasi-circular. The relative vorticity can be estimated from the cyclogeostrophic velocity through
 (2)
(2)
Where v is orbital velocity observed by SADCP, and r is redial distance referenced to the station at 126°E (approximately the eddy core). The Ertel PV consists of two terms associated with planetary vorticity (PVf) and relative vorticity (PVζ):
 (3)
(3)
where the Brunt-Väisälä frequency N is defined as  and ρ is potential density. In the open ocean, the first term in Equation 3 is by far the dominant one, i.e., |f| is far larger than |ζ|. Figure 6b shows the vertical section of normalized relative vorticity (ζ/f) at 23°N east of Taiwan associated with the SAE. It can be seen that the second term in Equation (3) can’t be neglected in the eddy region since the minimum normalized relative vorticity (ζ/f), i.e., Rossby number, amounts to -0.6. This notion is important for investigating the water mass trapped by the SAE (section 4). Figure 8 displays the distributions of planetary vorticity (PVf), relative vorticity (PVζ), and total PV across the SAE. It can be seen that the planetary vorticity (PVf) in the eddy core shows a minimum (< 2 × 10⁻¹⁰ m-1s-1) at ~ 400 m (~ 25.3 σθ) which is the typical characteristic of the STMW [41-44]. The STMW is characterized with nearly uniform temperature and low PVf (< 2 × 10⁻¹⁰ m-1s-1) between the seasonal and main thermoclines in the northwestern Pacific subtropical gyre and widely distributed in the Kuroshio recirculation region (purple contours in Figure 2). Figure 9 shows the scatterplots of PVf on the core layer (25.3 σθ) of STMW using a coordinate system (Δx, Δy) relative to the SAE centre. It can also be seen that the PVf is almost lower than 2 × 10⁻¹⁰ m-1s-1 in the eddy core, which indicates that the observed SAE formed in the STMW region. The minimum PVζ appears in the surface layer and increases with depth (Figure 8b). There existed minimum PV at 150-450 m depths because of the combined effects of PVf and PVζ (Figure 8c). According to Figure 2, the SAE is clearly exhibited in the maps of SLA anomalies. It should be note that not all subsurface eddies have a signature extending up to the sea surface [17]. Based on the maps of SLA anomalies, the observed SAE was tracked to the position near 136°E, 25°N in February where is the STMW region (Figure 2). It then propagated westward over 1500 km to the east of Taiwan in October (Figure 3). The eddy was blocked by the Kuroshio front east of Taiwan and stayed east of the Kuroshio front until it disappeared in December. Calculated from the propagating distance divided by 10 months, mean propagating speed of the observed SAE is about 0.06 ms-1, which is roughly within the expected phase speed ranges of the first-mode baroclinic Rossby wave at these latitudes [1,27].

Figure 8: Longitude-depth sections of (a) PVf, (b) PVζ, and (c) total PV (units: 10-10 m-1 s-1) at 23ºN east of Taiwan. Black contours in (a) and (c) are PV contours of 2 × 10⁻¹⁰ m-1 s-1 indicating the low PV water. Data above the mixed layer have been blanked.

Figure 9: Scatterplots of PVf (color shading, units: 10-10 m-1 s-1) and geostrophic current (vectors) on the core layer of the STMW (25.3σθ). A coordinate system (Δx, Δy) is used relative to the SAE centre as in Figure 4b.
Discussions
The nonlinear parameter (ε) is often defined as the ratio of the eddy swirl velocity to the propagation speed [1]. From above analysis, the swirl velocity of the SAE is significantly larger than its mean propagating speed (~ 0.06 m s-1). Thus, the observed SAE satisfies ε>1 and can be considered as nonlinear eddies, which means that the subsurface eddy can trap and transport water. Uehara et al. [41] and Takikawa et al. [31] also pointed out that such subsurface eddies can trap a substantial amount of water parcels within them during their westward movement. From Figure 8a and Figure 9, it can also be seen that the subsurface eddy carried STMW from its source region to the western boundary.
The water mass transport by mesoscale eddies can be quantitatively estimated by the outmost close PV contour [25]. In a recent study, Zhang et al. [26] found that the volume of the water trapped by the SAE has a three-compartment structure in the vertical with the mode water being located in the middle (Figure 6). However, they ignored the effects of relative vorticity and thought it is not important. According to Figure 6 and discussions in subsection 3.3, the minimum normalized relative vorticity (ζ/f), i.e., Rossby number, amounts to -0.6, indicating that the relative vorticity also plays an important role in the eddy core especially. Figure 10a-10c show the water trapped by the SAE (black contours) due to the effects of PVf, PVζ, and total PV, respectively. The values are blanked above the mixed layer to remove the spikes. It can be seen that the water volume trapped by the SAE exhibits a vertical three-compartment structure if only considering the effect of PVf (Figure 10a) which is consistent to the result of Zhang et al. [26]. The low potential vorticity is located in the middle layer, while the high potential vorticity waters are located in the upper and deep layers. However, if only considering the effect of PVζ, the water volume trapped by the SAE has a cone-shaped structure in the vertical (Figure 10b). Most importantly, when considering the joint effect of PVf and PVζ, the water volume trapped shows a spindle-shaped structure which is the most credible. According to Figure 2 and Figure 7, the SAE is roughly circular and the mean propagating speed of the observed SAE is about 0.06 ms-1. The total volume transport amounts to 13.5 Sv (Sv=106 m3s-1) integrated the area in the eddy core (Figure 10c). We can also calculate the transport of STMW by the SAE by multiple area of low PVf (< 2 × 10⁻¹⁰m-1s-1) in Figure 8a and the mean propagating speed. The transport of STMW by the SAE is about 0.5 Sv. According to Qu and Chen [42] and Wang et al. [43], the STMW located between the isopycnal surfaces of 25.0 σθ and 25.6 σθ. Its volume varies significantly between 25 and 50 Sv [44,45]. Thus, the observed SAE can transport 1 ~2% of the total STMW. From Zhang et al. [26]. it seems that northwestern Pacific Ocean is a region with a high probability of the SAE occurrence. How much STMW transported by all the SAEs remains unclear. In addition, the STMW is thought to be advected southwestward on isopycnal surfaces by recirculation gyre flow [46]. It can be inferred that eddies is another important way for the STMW transport.

Figure 10: Similar to Figure 8 but for anomalies of (a) PVf, (b) PVζ, and (c) total PV (units: 10-10 m-1 s-1) referenced to mean value of stations from 129ºE to 130ºE. Black contours represent the trapped fluid by the SAE defined by the outmost closed contours of the PV anomaly.
It is known that surface eddy plays an important role on the volume transport and path of the Kuroshio east of Taiwan [47,48]. Based on satellite altimeter data, Yan et al. [47] revealed that both surface anticyclonic and cyclonic eddies are able either to strengthen or weaken the Kuroshio. However, the effects of the subsurface eddy on the Kuroshio are not covered. We can infer that the maximum anomalous velocity appears in the subsurface layer of the Kuroshio when the SAE approaching [49]. In situ observations should be designed to examine the subsurface eddy-Kuroshio interactions.
Summary and Conclusions
Subsurface eddies are more difficult to detect compared with surface eddies. In October 2014, a SAE approaching Kuroshio front east of Taiwan was captured by satellite altimeter in conjunction with in situ measurements. The eddy is extra-large with horizontal scale of 470 km above 700 m which is significantly larger than the subsurface eddies in this region observed by previous researchers. It exhibits a lens-shaped vertical structure which is significantly different from the general vertical structure of surface anticyclonic eddy. The seasonal thermocline shoals, while the main thermocline deepens in the eddy center. Thus, the water in the eddy core is colder/warmer above/below 200 m than that in the surrounding areas with maximum negative (-1.2°C) and positive (3.5°C) temperature anomalies appear at ~100 m and ~450 m depths, respectively. There exist two salinity anomaly maxima and a weak minima in the eddy core at 100 m (0.25 psu), 450 m (0.25 psu) and 700 m (-0.1 psu) depths, respectively. Three-dimensional structure of temperature and salinity anomalies was also composited based on Argo profiling data, displaying the similar results. Surface anticyclonic eddy often has warm core in the north hemisphere due to water convergence and downwelling in the eddy core [27,49], which plays an important role in transporting positive heat in the Subtropical North Pacific [50]. However, the observed SAE has cold core above 200 m and warm core below 200 m. Further studies are necessary for better understanding the thermodynamic effects of the SAEs with extraordinary structure.
The maximum swirl velocity of the SAE (0.35 ms-1) appears at ~200 m observed by SADCP and tends to be comparable to the maximum northward Kuroshio velocity east of Taiwan at the same depth. The radius of the subsurface eddy is even larger than the Kuroshio width. Based on observations from moored current meter array east of Taiwan, William et al. [51] indicated that the Kuroshio transport into the East China Sea was significantly modulated by the westward mesoscale surface eddy east of Taiwan. However, the effects of the subsurface eddy on the Kuroshio remain unclear.
According to the PV characteristics in the eddy core and the trajectory identified from SLA maps, it is proved that the observed SAE was generated in February in the STMW region. It then propagated westward over 1500 km to the east of Taiwan in October. The eddy was blocked by the Kuroshio front east of Taiwan and stayed east of the Kuroshio front until it disappeared in December. The mean propagating speed of the observed SAE is about 0.06 m s-1, which is roughly within the expected phase speed ranges of the first-mode baroclinic Rossby wave at these latitudes. The water volume trapped by the SAE shows a spindle-shaped structure in the vertical. It can transport 0.5 Sv STMW occupying 1-2% of its total volume transport. In this study, the formation mechanisms of the observed SAE were not investigated based on the limited in situ measurements. These topics will be pursued in our future studies.
Acknowledgements
The altimeter products were produced by Ssalto/Duacs and distributed by Aviso, with support from Cnes. The MOAA-GPV dataset was available from http://www.jamstec.go.jp/ARGO/argo_web/MapQ/Mapdataset_e.html. Argo profiling floats data was provided by http://www.argodatamgt.org/. The XCTD and SADCP data along 23°N section used here can be accessed freely for research purpose upon request to Dr. Feng Nan (nanfeng0515@qdio.ac.cn). This work was jointly supported by the National Natural Science Foundation of China (Grant No. 41676005), the Global Climate Changes and Air-sea Interaction Program (Grant No. GASI-02-PAC-ST-Wsum and GASI-IPOVAI-01-06), the CAS Interdisciplinary Innovation Team, and the NSFC Innovative Group Grant (Project No. 41421005).
References
- Chelton DB, Schlax MG, Samelson RM (2011) Global observations of nonlinear mesoscale eddies, Prog Oceanogr 91: 167-216.
- Xiu P, Palacz A, Chai F, Roy E, Wells M (2011) Iron flux induced by Haida eddies in the Gulf of Alaska, Geophys. Res. Lett38.
- Dong C, McWilliams JC, Lui Y, Chen D(2013) Global heat and salt transports by eddy movement. Nat Commun 5:3294.
- Xu C, Shang XD, Huang RX (2014) Horizontal eddy energy flux in the world oceans diagnosed from altimetry data. Sci Rep 4:5316.
- Zhang ZG, Wang W, Qiu B (2014) Oceanic mass transport by mesoscale eddies. Science 345: 322-324.
- Faghmous JH,Frenger I, Yao Y, Warmka R, Lindell A, et al. (2015) A daily global mesoscale ocean eddy dataset from satellite altimetry. Sci Data 2:150028.
- Arnold LG, Claudia FG, Craig ML, Heather HF, Amy B, et al.(2002) Japan/East Sea Intrathermocline Eddies. J Phys Oceanogr 32: 1960-1974.
- Chiang TL, Wu CR, Qu T, Hsin YC (2015) Activities of 50-80 day subthermocline eddies near the Philippine coast. J Geophys Res Oceans 120: 3606-3623.
- Dennis J,McGillicuddy J (2015) Formation of Intrathermocline Lenses by Eddy-Wind Interaction. J Phys Oceanogr 45: 606-612.
- Assassi C, Morel Y, Vandermeirsch F,Chaigneau A, Pegliasco C, et al. (2046)An Index Distinguish Surface- and Subsurface-Intensified Vortices from Surface Observations. J Phys Oceanogr 46: 2529-2552.
- Johnson G, McTaggart K (2010) Equatorial Pacific 13°C Water Eddies in the Eastern Subtropical South Pacific Ocean. J Phys Oceanogr 40: 226-236.
- nson G, McTaggart K (2010) Equatorial Pacific 13°C Water Eddies in the Eastern Subtropical South Pacific Ocean. J Phys Oceanogr 40: 226-236.
- Hormazabal S, Combes V, Morales CE, Correa-Ramirez MA,Di Lorenzo E, et al. (2013) Intrathermocline eddies in the coastal transition zone off central Chile (31-41ºS). J Geophys Res Oceans 118: 4811-4821.
- Combes V, Hormazabal S, Di Lorenzo E (2015) Interannual variability of the subsurface eddy field in the Southeast Pacific. J Geophys Res Oceans 120: 4907-4924.
- Thomsen S, Kanzow T, Krahmann G, Greatbatch RJ, Dengler M, et al. (2016) The formation of a subsurface anticyclonic eddy in the Peru-Chile Undercurrent and its impact on the near-coastal salinity, oxygen, and nutrient distributions. J Geophys Res Oceans. 121: 476-501.
- Pelland N, Eriksen C, Lee C (2013) Subthermocline Eddies over the Washington Continental Slope as Observed by Seagliders. J Phys Oceanogr 43: 2025-2053.
- McDowellSE, Rossby HT (1978) Mediterranean water: an intense mesoscale eddy off the Bahamas. Science 202: 1085-1087.
- Paillet J, Le Cann B, Serpette A, Morel Y, Carton X (2002) Dynamics and evolution of a northern meddy. J Phys Oceanogr 32: 55-79.
- Richardson P,Bower A, Zenk W (2000) A census of Meddies tracked by floats. Progress in Oceanography 45: 209-250.
- Gordon A, Giulivi C, Lee C, Furey H,Bower A, et al. (2002) Japan/East Sea Intrathermocline Eddies. J Phys Oceanogr 32: 1960-1974.
- Zhang Z, Qiao F, Guo J (2014) Subsurface eddies in the southern South China Sea detected from in-situ observation in October. Deep Sea Research Part I 87: 30-34.
- Kumar S, Babu M, Rao D (1992) Energy and generating mechanism of a subsurface, cold core eddy in the Bay of Bengal. Indian Journal of Marine Sciences 21: 140-142.
- Zhurbas V, Stipa T, Malkki P,Paka V, Golenko N, et al. (2004) Generation of subsurface cyclonic eddies in the southeast Baltic Sea: Observations and numerical experiments. J Geophys Res 109.
- Nauw JJ, Van Aken HM, Lutjeharms JRE, Ruijter WPM (2006) Intrathermocline eddies in the Southern Indian Ocean. J Geophys Res 111.
- Brundage WL, Dugan JP (1986) Observations of an Anticyclonic Eddy of 18°C Water in the Sargasso Sea. J Phys Oceanogr 16: 717-727.
- Zhang Z, Zhang Y, Wang W (2017) Three-compartment structure of subsurface-intensified mesoscale eddies in the ocean. J Geophys Res Oceans 122: 1653-1664.
- Oey LY,Zhang HC (2004) The generation of subsurface cyclones and jets througheddy-slope interaction. Continental Shelf Research 24: 2109-2131.
- Yang G, Wang F, Li Y, Lin P (2013) Mesoscale eddies in the northwestern subtropical Pacific Ocean: Statistical characteristics and three-dimensional structures. J Geophys Res 118: 1906-1925.
- Qiu B, Chen S (2013) Concurrent Decadal Mesoscale Eddy Modulations in the Western North Pacific Subtropical Gyre. J Phys Oceanogr 43: 344-358.
- Maximenko N, Yamagata T (1995) Submesoscale anomalies in the North Pacific Subarctic Front. J Geophys Res 100: 18459-18469.
- Zhu X,Park JH, Huang D (2008) Observation of baroclinic eddies southeast of OkinawaIsland. Science in China Series D: Earth Sciences51:1802-1812.
- Takikawa T, Ichikawa H, Ichikawa K, Kawae S (2005) Extraordinary subsurface mesoscale eddy detected in the southeast of Okinawa in February 2002. Geophys Res Lett 32: L17602.
- Oka E, Toyama K, Suga T (2009) Subduction of North Pacific central mode water associated with subsurface mesoscale eddy. Geophys Res Lett 36: L08607.
- Zhang Z, Li C, Zhao W, Tian J, Qu T (2015) Subthermocline eddies observed by rapid-sampling Argo floats in the subtropical northwestern Pacific Ocean in Spring 2014. Geophys Res Lett 42: 6438-6445.
- Zhao M, Timmermans ML(2015) Vertical scales and dynamics ofeddies in the Arctic Ocean’s CanadaBasin. J Geophys Res Oceans 120:8195-8209.
- Nan F, Xue H, Xiu P, Chai F, Shi, M, et al. (2011) Oceanic eddy formation and propagation southwest of Taiwan. J Geophys Res 116: C12045.
- Zhu XH, Nakamura H, Dong M, Nishina A, Yamashiro T (2017) Tidal currents and Kuroshio transportvariations in the Tokara Strait estimated from ferryboat ADCP data. J Geophys Res Oceans 122: 2120-2142.
- Hosoda S, Ohira T, Nakamura T (2008) A monthly mean dataset of global oceanic temperature and salinity derived from Argo float observations. Jamstec Rep Res Dev 8: 47-59.
- Qu T, Mitsudera H, Yamagata T (1999) A climatology of the circulation and water mass distribution near the Philippine coast. J PhysOceanogr 29: 1488-1505.
- Rossby T, Flagg C, Ortner P, Hu C (2011) A tale of two eddies: Diagnosing coherent eddies through acousticremote sensing. J Geophys Res 116: C12017.
- Qiu B, Chen S, Rudnick D, Kashino Y (2015) A new paradigm for the North Pacific subthermocline low-latitude western boundary current system. J Phys Oceanogr 45: 2407-2423.
- Uehara H, Suga T, Hanawa K, Shikama N (2003) A role of eddies in formation and transport of North Pacific Subtropical Mode Water. Geophys Res Lett 30: 1705.
- Qu T, Chen J (2009) A North Pacific decadal variability in subduction rate, Geophys. Res Lett 36: L22602.
- Wang R, Yu F, Nan F (2015)Weakening of subduction in theSubtropical Mode Water formationregion observed during 2003-2013.J Geophys Res Oceans 120:7271-7281.
- Xu L, Li P, Xie S, Liu Q, Liu C, Gao W (2016)Observing mesoscale eddy effects onmode-water subduction and transport in the North Pacific. Nat Commun 7: 10505.
- Toyama K, Iwasaki A, Suga T (2015) Interannual variation of annual subduction rate in the North Pacific estimated from a griddedArgo product. J Phys Oceanogr 45: 2276-2293.
- Oka E, Qiu B (2012) Progress of North Pacific mode water researchin the past decade. J Oceanogr 68: 5-20.
- Hsin YC, Qiu B, Chiang TL, Wu CR (2013) Seasonal to interannual variations in the intensity and centralposition of the surface Kuroshio east of Taiwan. J Geophys Res Oceans 118: 4305-4316.
- Yan X, Zhu XH, Pang C, Zhang L (2016) Effects of mesoscaleeddies on the volume transport andbranch pattern of the Kuroshio east ofTaiwan. J Geophys Res Oceans 121: 7683-7700.
- Nan F, He Z, Zhou H, Wang D (2011) Three Long-lived Anticyclonic Eddies in the Northern South China Sea. J Geophys Res 116: C05002.
- Qiu B, Chen S (2005) Eddy-Induced Heat Transport in the Subtropical North Pacific from Argo, TMI, and Altimetry Measurements. J Phys Oceanogr 35: 458-473.
Relevant Topics
- Algal Blooms
- Blue Carbon Sequestration
- Brackish Water
- Catfish
- Coral Bleaching
- Coral Reefs
- Deep Sea Fish
- Deep Sea Mining
- Ichthyoplankton
- Mangrove Ecosystem
- Marine Engineering
- Marine Fisheries
- Marine Mammal Research
- Marine Microbiome Analysis
- Marine Pollution
- Marine Reptiles
- Marine Science
- Ocean Currents
- Photoendosymbiosis
- Reef Biology
- Sea Food
- Sea Grass
- Sea Transportation
- Seaweed
Recommended Journals
Article Tools
Article Usage
- Total views: 4333
- [From(publication date):
August-2017 - Mar 31, 2025] - Breakdown by view type
- HTML page views : 3442
- PDF downloads : 891