Numerical Study of Electrically Conductive Graphene/Paraffin Wax Nanocomposites
Received: 17-Jun-2019 / Accepted Date: 01-Jul-2019 / Published Date: 08-Jul-2019
Abstract
Over the last years, nano-enhanced Phase Change Materials (nano-PCM ) have lately attracted a great attention to address many key barriers (i.e., low electrical and thermal conductivities) to wide adoption of PCMs in emerging applications such as cooling systems, energy conversion, electronic devices, electrodes for rechargeable batteries. For all applications, the knowledge of the electrical properties is important. In this work, a numerical setup was built to investigate the electrothermal behavior of the nanocomposite graphene/paraffin wax. This new materials are developed by associating paraffin wax as thermal storage material and graphene nanoparticles as conductive fillers.The finite element method based on COMSOL Multiphysics 5.2a software, was used to solve the coupled equations of various physical phenomena: electric current, heat transfer and phase change process of the paraffin. To understand the physics-based mechanisms during current distribution, a multi-scale numerical models were developed, where the homogeneous mode is used in macroscopic scale and heterogeneous one in microscopic scale. The choice of optimal physical properties of these materials is analyzed to predict the effective electrical and thermal conductivities of the composite system. The numerical results indicate that the improvement of electrical conductivity of the composite is due to the formation of a conductive network inside the paraffin wax. The resulting current passing through the graphene nanoparticles produces joule heat and self melting of paraffin wax. Accordingly, electric heating behavior of the nanocomposite is strongly dependent on graphene concentrations as well as applied voltage.
Keywords: Numerical study; Graphene nanoparticles; Electrothermal behavior; Nanocomposite materials; Phase change material
Nomenclature
CP: Heat Capacity (J.kg-1.K-1); K: Thermal conductivity (W.m-1.K-1); L: Latent heat (J/kg); T: Temperature (K); Tm: Temperature of melting of PCM (K); ΔT: Temperature difference (K); U: Velocity (m/s); σ: Electric conductivity (S/m); ρ: Density (kg m-3); β: Thermal expansion coefficient (1/K); μ: Viscosity (N s/m2); GNP: Graphene nanoparticle; nano-PCM : PCM nanocomposite; PCM: Phase change material
Introduction
Thermal Energy Storage System (TESS) is considered as an especially bright way to minimize the mate between demand and supply of energy. The use of Phase Change Materials (PCMs) seems one of the most significant storage technique due to their ability of charging and discharging heat at a constant temperature during phase change process [1-2]. PCMs are usually classified as non-organic, organic and eutectics kinds [3].
Non-organic PCMs
They have high heat of fusion, inflammable and they are obtainable at low costs. Nevertheless, their main drawbacks is that their super cooling problem during phase change process that results in irreversible transition phase [4]. Hydrated salts are the foremost habitually used PCM for thermal energy storage in this group.
Organic PCMs
They keep a high density energy storage while not abundant much super-cooling compared to inorganic PCMs. They're accessible in a large temperature range and that they have a great agreement with different materials. Paraffin wax, fatty acids and carbohydrate are the most frequently used PCMs in this category [5].
Eutectic PCMs
Eutectic is a mixture of two or more compounds with high density. However, their thermo-physical properties are restricted and the usage of such materials is new for energy storage applications.
The main criterion to select a PCM for a specific application is its phase change temperature. Additionally, different many factors should even be taken under consideration for an appropriate decision: physical properties, non-toxic, large latent heat of fusion, chemically stable, non-erosive. Among these materials, organic PCMs are considered as a kind of vital materials and have an intensive potential for sensible applications in solar energy storage, green house construction and dissipate heat recuperation from electronic devices etc. In spite of their fascinating properties, organic PCMs have some drawbacks like:
(i) The low thermal conductivity which reduce the rate of heat storage and energy conversion.
(ii) The low electrical conductivity that frustrates taking advantage of electricity as energy source.
Many methods have been suggested to enhance the electrical and thermal conductivity of pure paraffin, such as inserting fins [6], metal foam [7], dispersing conductive particle within PCM [8] and microencapsulation of PCM [9]. Recently, with the development of nanotechnology, combining pure PCMs with high conductive nanoparticles could be crucial to overcome these problems [10]. These nanoparticles such as carbon nanotubes, carbon nanofibers, graphite, metallic nanoparticles, graphene flakes, etc. [11-15] have gained considerable attention in many emerging applications like antistatic coatings, organic light emitting diodes,sensors, flexible microelectronics, and touch screens due to their excellent properties [16-21].
Several numerical and experimental researches are investigated to improve the low thermal conductivity of the PCMs by adding nanoparticles [22-27]. Kant et al. [28] examinated the influence of inserting Graphene Nano Particles (GNP) with different concentrations of nanoparticles in various PCM (CaCl26H2O, Capric Acid and paraffin). They numerically investigated the melting of these composite materials inside a square cavity heated from one side. They revealed that inserting GNP improves the effective thermal properties of the PCMs and ameliorate the phase change rate. Arasu et al. [29] numerically investigated the melting of nanocomposite (PCM/Al2O3 nanoparticles) with different weight ratio which was heated from two different arrangements. The study described that the melting rate decreases with the heighten of the volumetric composition of alumina (Al2O3), the simulation reported that the accumulation of alumina in paraffin wax results in the enhancement of the effective thermal properties for efficient utilization of TESS. Wang et al. [30] prepared paraffin/ nano-SiO2 composites by natural infiltration method as innovative insulation materials applied to electronic thermal protection. Examinations by methods of Thermos Gravimetric Analysis (TGA), Scanning Electron Micrographs (SEM), hot disk analyzer, Differential Scanning Calorimeter (DSC) and thermal protection performance tests were dedicated to the thermal properties,morphology and thermal protection performance analysis of composites. Experimental procedures reported that the incorporation of about 75 wt.% of nano SiO2 can mainly enhance the thermal properties of the nanocomposite. These excellent properties make the parafin-nano SiO2 composite promising for using in the field of electronic thermal protection. Shirazi et al. [31] investigated the feasibility to use PCM nanocomposites for suitable heat management of a Li-ion battery package. The heat generation was modeled using 3D heat transfer model with different nanocomposite structures created by the adding of carbon nanotubes, graphene,and fullerene throughout battery charging/discharging cycles. These results discovered a motivating decrease in temperature variations by embedding the batteries within a paraffin nanocomposite and enhancement of effective thermal conductivity.
Among the research on PCMs focused on electric-to-thermal energy conversion, Zhang et al. [32] elaborated a nanocomposite material by associating paraffin wax as thermal storage matrix and carbon nanofiber as conductive fillers. Then, they evaluated their Electrical Thermal Storage (ETS) performance through an experiment of electric heating and thermal energy release. Results show that electrical resistivity of carbon nanofiber/paraffin wax composites decreases with increasing of the Carbon Nano Fiber (CNF) concentration and the thermal storage capacity is five times better than the traditional thermal storage medium.
To date, most of the research studies focussed on investigating the thermal behavior problem of the phase change material with diffferent volume fraction of nanoparticles.Although, relevent litterature related to the electrical behavior are lacking, despite, it plays a vital role in electronic applications such as converting off-peak electricity,use in hybrid vehicles and portable electronics. Thus this is the essential motivation of the current work.Moreover, Graphene is a two dimensional (2D) honeycomb-like lattice sheet of pure carbon which have excellent electrical [33], mechanical [34], thermal properties [35] and unique structural properties (e.g., lightweight, flexibility) [36]. This combination of proprieties have made a graphene one of the most promising material improvement in different (mechanical, thermal, electrical etc.) properties of produced nanocomposites.In this paper, a numerical study was built to investigate the electrothermal behavior of nanocomposite material paraffin wax filled with graphene nanoparticles. Our challenge is to develop a smart material used in variety of electrical applications such as cooling systems, energy conversion, electronic components, electrodes for rechargeable batteries. Indeed, that can change one or more properties when an electric current is applied and return to this original properties when the stimulus is withdrawn. On this subject, the simulation results will be accustomed to provide a general perspective to conduct experiments that are excessive and time intense as well. The randomly dispersed graphene in the paraffin matrix was simulated to optimized the Electrical Percolation Threshold (EPT). The effects of percolation, concentration level of graphene and temperature on the electrical properties of the nanocomposite material was considered. To understand the physics-based mechanisms during current distribution, a multi-scale numerical models were developed, where the homogeneous mode is used in macroscopic scale and heterogeneous one in microscopic scale.
Physical and Numerical Models
Physical model
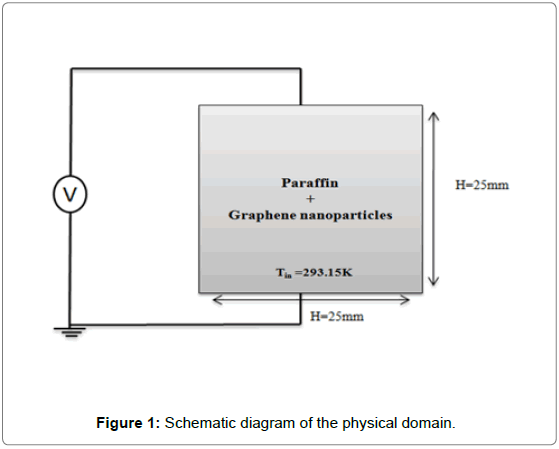
The dimensions and geometry used for the present study are shown in Figure 1. The graphene nanoparticles with different volume ratios dispersed PCM (nano-PCM) is filled in a square enclosure of size 25 mm×25 mm. Initially, the material is considered as frozen substance (solid). For the electrical boundary conditions, a voltage is applied between the two contact boundaries (top and bottom) of the composite and the two others boundaries are insulated. For the thermal boundary conditions, the four walls are taken at a constant temperature (300 K). The initial velocity of the nano-PCM is zero and maintained no slip at the walls. The initial pressure is at atmospheric pressure. The thermophysical and electrical properties of PCM and graphene are represented.
The assumptions for the present study are as following:
1) The graphene nanoparticles are homogeneously distributed in the PCM.
2) The melting of nano-PCM is Newtonian and incompressible, and its flow is two dimensional and unsteady.
3) The viscous dissipation terms, volume expansion during melting are negligible.
4) The physical properties of the nano-PCM are temperature dependent.
5) The melting of nano-PCM is controlled by the convection and conduction modes of heat transfer.
The physics interface solves a current conservation equation for the electric potential leading to the following formulation:
 (1)
(1)
Where, J is the current density, E is the electric field, V is the electric potential and σNPCM is the electric conductivity of the nanocomposite.
Then, the temperature distribution is determined by the heat transfer diffusion Eq. (2)
 (2)
(2)
Where, S is a source term present the joule heating due to the circulate of electric current through the material.
 (3)
(3)
The nanocomposite considered in this study are made of graphene nanoparticles homogenously distributed in the simulation domain during the melting process when the transport of nanoparticles and their rejection by the advancing liquid–solid interface are ignored. In fact the effect of Graphene Nanoparticles (GNP) are considered, the physical properties of such nanocomposites for varying volume fractions need to be properly calculated. The following equation is used for conversion between the mass and volume fractions of nanoparticles:
 (4)
(4)
Where, ρPCM and ρGNP are respectively the density of PCM and the density of graphene nanoparticles.
The density of PCM can be written as:
 (5)
(5)
Where, ρliquid and ρsolid describe the density of the PCM at its liquid and solid phase respectively. The function B(T) as mentioned in Eqn (6), is defined as the liquid fraction was updated to account for the change in specific heat between the solid and the liquid phase of the PCM. The value of function B is 0 when the PCM is totally in solid state and 1 when it became fully liquid. B(T) linearly increases from 0 to 1 between the two states of PCM.
 (6)
(6)
Where, Tm is the melting temperature of PCM and ΔT is the transition temperature of PCM. The liquid fraction of the PCM is used to model the modifications of the thermo-physical properties that appears during the phase transition.
The thermophysical properties of the nano-PCM such as density, specific heat, latent heat, thermal expansion coefficient are obtained with following equations similar to the procedure reported in [26]:
 (7)
(7)
The modified heat capacity of Nano-PCM is given by:
 (8)
(8)
Where, CpGNP and CpGNP are respectively the density and the heat Capacity of the graphene nanoparticles.
The heat Capacity of PCM is written as:
 (9)
(9)
Where, Cpsolid and Cpliquid are the heat capacity of the PCM at its solid and liquid phases respectively. D(T) is a Dirac delta function and its main role is to distribute the latent heat equally around the mean melting point of PCM. It is set to 0 all over excluding the interval [Tm− ΔT, Tm+ΔT] and can be modeled as follows:
 (10)
(10)
When the PCM started to change its phase, it absorbs the latent heat (Lf) which can be represent as a change in its specific heat during the phase transition period.
The dynamic viscosity of the nano-PCM is evaluated by Krieger- Dougherty model for nanoparticles [29].
 (11)
(11)
The thermal conductivity of the PCM nanocomposite is intended using a Maxwell-Garnett type Effective Medium Theory (EMT) considering the role of thermal boundary resistance between the GNP and surrounding PCM matrix. This model has proven to predict the thermal conductivity enhancement of nanocomposites with reasonable accuracy [23,24].
 (12)
(12)
Where, k0 is the stagnant thermal conductivity given by:
 (13)
(13)
The thermal conductivity of PCM kPCM (T) is written as :
 (14)
(14)
Moreover, kliquid and kd are the thermal conductivity of the PCM at its liquid and solid phases respectively.
The kd accounts for Brownian motion, which causes the temperature dependence of the thermal conductivity.
 (15)
(15)
Where, B0 is Boltzmann constant, 1.381*10-23J/K and dp is the diameter of nanoparticles.
The value of 
The value of correction factor f (T,φ) in the Brownian motion term is defined as the same as
for liquid fraction, B(T) in Eq. (6).
 (16)
(16)
We appropriated that the PCM in the liquid phase is a Newtonian fluid. The mass, momentum and energy conservation equations were resolved simultaneously with the heat transfer diffusion equation. The velocity fields in Eq.(2) is given by Navier-stokes equations for incompressible fluid. However, to model the phase transition, the momentum conservation equation was modified as follow:
 (17)
(17)
Where, the force  is a buoyancy force can be given by the Boussinesq approximation:
 (18)
(18)
And the force  is an additional source to damp the velocity in solid PCM
 (19)
(19)
With the function A(T) inspired from the Carman–Koseny relation for porous medium
 (20)
(20)
Where, q is typically a small number so as to make Eqn (20) effective, even when the liquid fraction B(T) is zero. The constant value of q was fixed at 10-3. C defines the mushy zone constant and its value is subject to the morphology of the PCM. The mushy zone constant describes how steeply the velocity is totally reduced to zero when the PCM becomes completely solid. In this research, C is taken as a constant value 106 [28]. This value is chosen arbitrary high due to the high viscosity of solid PCM.
Numerical model
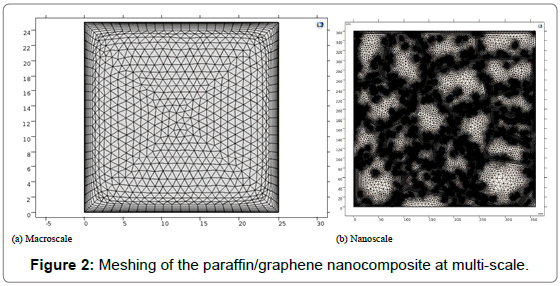
COMSOL Multiphysics software is used to solve numerically the concurrent equations mentioned previously in Section (2.1) and subjected to the boundary conditions based on the finite element method. The physical properties of Nano-PCM are defined according to temperature, which determines the phase (liquid, mushy, or solid) and nanoparticles concentration (ϕ).The numerical simulation is carried out according to the following steps: Discretization of the considered domain (size, element and type), defining the appropriate time step as well as the relative and absolute tolerances and use the appropriate solver techniques. In order to get the most suitable solution, a mesh dependence study was performed carefully for the current investigation. A triangular meshing with a regular refinement method was used for the global mesh at the macroscale geometry of the nanocomposite material as shown in Figure 2a. Firstly, 1954 domain elements are considered for the entire model calibrate for the fluid dynamic with the predefined normal mesh. The maximum element size and element growth rate are set to 0.00113 and 1.15 respectively. Secondly, 4412 domain elements are considered for the entire model calibrate for the fluid dynamic with the predefined fine mesh as shown in Figure 2b where the maximum element size and element growth rate are set to 7E-4 and 1.1 respectively. Finally, 17800 domain elements are considered for the entire model calibrate for the fluid dynamic with the predefined extra fine mesh. The maximum element size and element growth rate are set to 3.25E-4 and 1.08 respectively.
It is well noted that there is not a significant difference in the obtained results for all mesh sizes. For better precision and exactness, a mesh size with 17800 elements will be chosen for our research. An absolute tolerance of 0.00001 and a relative tolerance of 0.001 are applied. The time stepping is selected with an initial time step of 0.01 s and a maximum time step of 100 s.
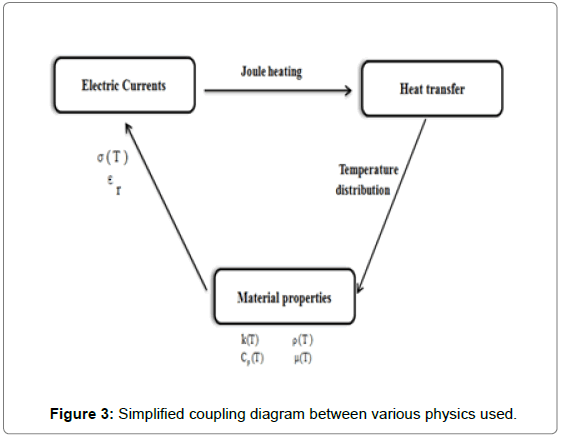
Then, in order to simulate the electrothermal behavior of the PCM nanocomposite, a coupling of two different COMSOL physics interfaces was required. We therefore used the electric current and heat transfer models which the interrelationship of the way they interact with each other is shown in Figure 3. The electric currents interface applies a voltage between the two contact boundaries of the nanocomposite. The overall process of simulation is to control the change of temperature inside the material when an electric current is applied. In ordre to couple the electric currents interface from with the heat transfer interface, the power dissipation density is used as input heat source defined by the joule heating. The velocity and pressure distributions are also used as inputs in the heat transfer interface.
Stochastic microstructure
Our goal is therefore to develop techniques to generate the nanocomposite material (GNP/paraffin wax) with well-controlled structural properties. The proposed method includes a stochastic Voronoi diagram to control the nanopaticle size and distribution, and a B-spline curve to control the particle shape [37,38]. In the literature, Voronoi tessellations have been widely used to divide geometric domains and generate polygonal meshes [39,40].
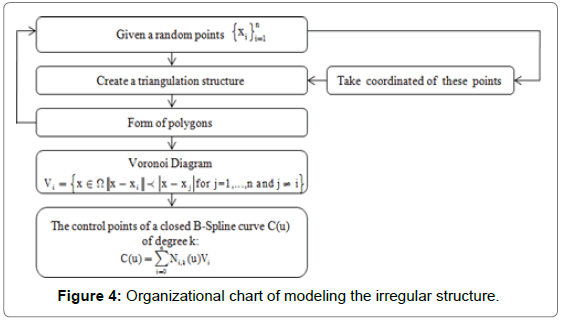
The characteristics of this structure are modeled through some functions to optimize the topology of nanostructure with the aim to define the physical parameters such as volume fractions. Different steps were developed to use the appropriate functions, as detailed in the organizational chart in Figure 4.
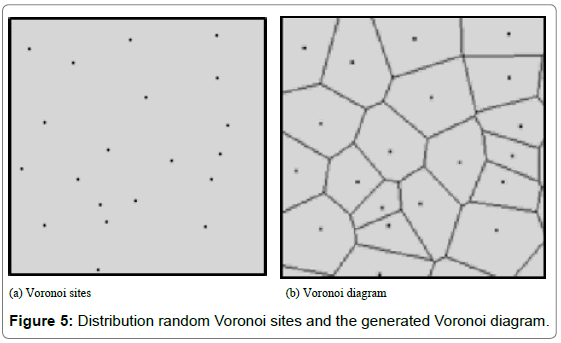
The first step of structural modeling is to determine the random generation of different points  in the the m-dimensional space Rm shown in Figure 5a. These points will be connected together to create irregular convex and concave polygons where the assembly of these polygons form the Voronoi cell of pi which follows Eq. (21)
 (21)
(21)
Where,  is the Euclidean-distance between two point x2 and x2, In = {1, 2,...,n}.
In R2, the boundaries of Voronoi cells contain line segments that connect exactly perpondicular bisector between two generators points. The boundary is called Voronoi edge, and all the Voronoi edges of the same Voronoi cell form a Voronoi Polygon. The point where three or more Voronoi edges meet is called Voronoi point or Voronoi Vertex shown in Figure 5b.
Let  a voronoi cell associated with the generator V(pi) and the vertices of the voronoi polygon
  be {v0, v1,..., vm} which are modeled as control points of closed B-Spline curves C(u) of degree k, we take
 (22)
(22)
Where,  is B-Spline basis function of degree k, which can be recursively defined by Eqn (23). To create a periodic B-Spline curve, the first and last k control points must be properly wrapped in the form such that
 (23)
(23)
 (24)
(24)
The B-Spline curves are then used to allow for a closer fit of observed structures with irregular cell size and shape.
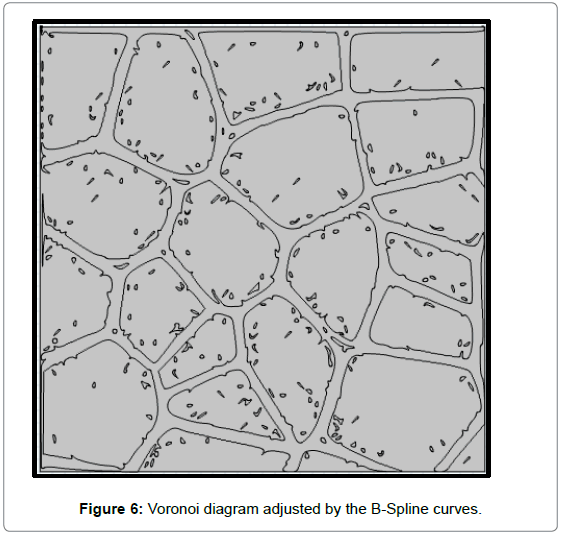
This allows for a more realistic simulation of the properties of the materials. Furthermore, the generation of virtual nanomaterial is possible which can then be used for optimizing the existing microstructure and for the virtual design of new materials shown in Figure 6.
Indeed, before presenting the B-spline curves, the merged polygons are scaled down with a constanscaling factors (0<sf<1) to scale all the B-spline curves and modify the thickness of interstices.
Model Validation
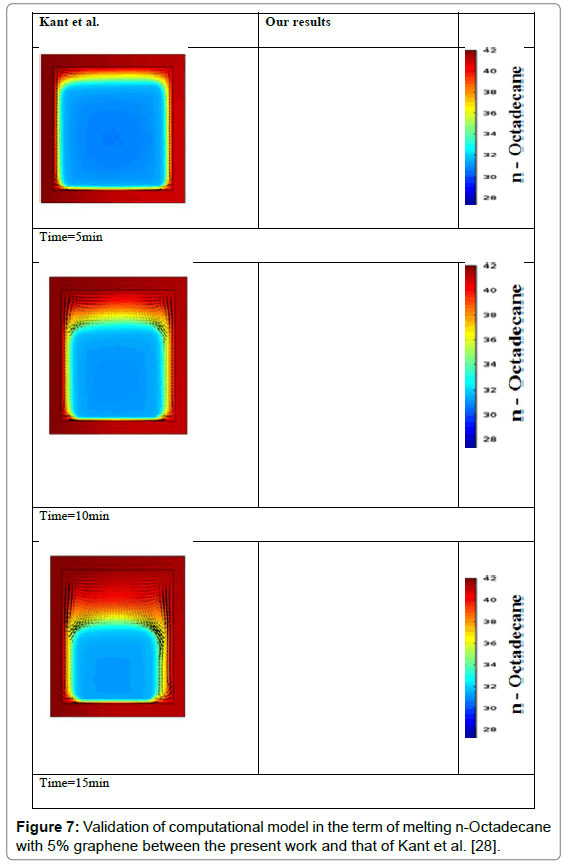
This section presents a validation approach and illustrates the accuracy of the computational model by comparing with different research. In first step, the calculation from the current simulation model, in terms of thermal behavior, are compared with the numerical results of Kant et al. [28] and shown in Figure 7. Initial computationals were achieved using the developed methodology of the present investigation for which similar structure geometry, boundary conditions and the same material properties were used as designated by Kant et al. [28]. As show in Figure 7, the temperature distriution and the velocity field of the PCM nanocomposite are in good agreement with the results of numerical study carried out by Kant et al. [28]. Such comparative study establishes a stringent test of the agreement of our thermal model in the term of melting nano-PCM and its predictions before using it further.
Figure 7: Validation of computational model in the term of melting n-Octadecane with 5% graphene between the present work and that of Kant et al. [28].
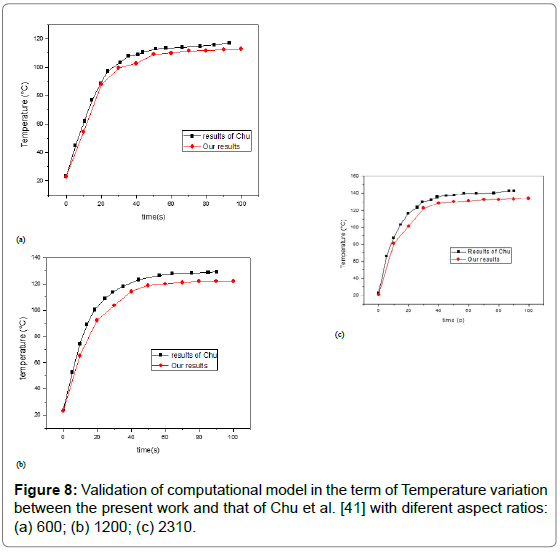
In second step,to validate our proposed electrothermal behavior, we initiated by modeling a previously published work of Chu et al. [41]. The electric heating properties of the CNT/PDMS composites (5.6%) with different aspect ratios were evaluated by measuring the changes in the temperature under an applied DC voltage of 10V. This comparative study clearly shows in Figure 8 that the developed electrothermal model is in good agreement with the results of the experimental study carried out by Chu et al. [41].
Figure 8: Validation of computational model in the term of Temperature variation between the present work and that of Chu et al. [41] with diferent aspect ratios: (a) 600; (b) 1200; (c) 2310.
Results and Discussion
Electrical-thermal behavior
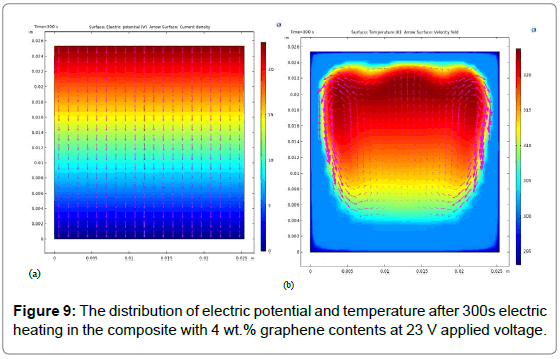
The Figure 9a shows the electrical potential distribution and the current density field product from electrical analysis. The red color indicates the highest voltage of 23 V which was set in the boundary condition. The opposite side has the zero electrical potential. When we apply an electric potential to the nanocomposite material (paraffin wax/4wt.% of GNP), an electric current circulate through the material defined by a current density vector per cross-sectional area, its direction being that of the motion of the charges. By applying a given DC voltage, the material can generate Joule heat proportional to the resistance and square of the current. Figure 9b shows the distribution of the temperature inside the material. It illustrates that a voltage of 23 V increases the temperature from room temperature to 320 K in 300 s, as the maximum value was detected in the center of the media. The solid nano PCM absorbs heat and transforms into a liquid state,produces a self melting. The velocity vector near the solid nano PCM is high due to a higher temperature gradient. Infact, energy from the electrical field is converted into thermal energy.
Effect of GNP concentration
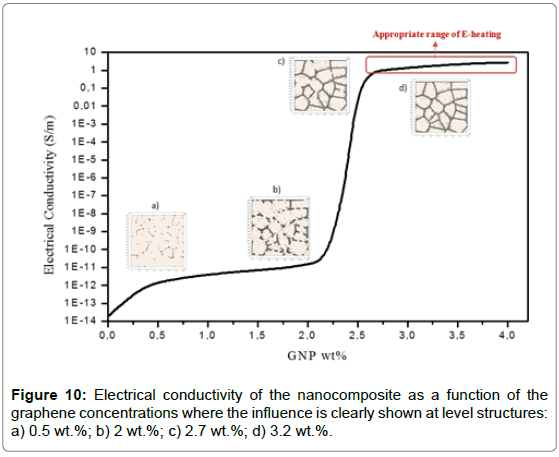
Electrical conductivity: The primary goal of this simulation is to calculate the effective electrical conductivity of the composite medium made of paraffin wax and graphene nanoparticle. Figure 10 shows the electrical conductivity of the composite with different GNP weight percentages at fixed voltage of 23V. The unfilled neat paraffin (at 0 wt.%) is an insulator that exhibits low electrical conductivity of 1.6×10⁻¹⁴ S/m. When GNP nanoparticles were added to paraffin, the electrical conductivity increased. On the other hand, electrical conductivity of the composite with low GNP concentrations level of 0.3-2 wt.% was measured to be around of 1.6×10⁻¹² - 7.3×10⁻¹¹ S/m, which was quite similar with that of the pure paraffin. It means that the electric charges do not flow effectively in those composite because of no physical connection between graphene sheets dispersed in the paraffin matrix. On the other hand, for the composite with high graphene contents of 2.5-4.5 wt.%, the electrical conductivity was dramatically increased to be around of 1-3 S/m. Therefore, it is reasonable to note that the electrical percolation of nanocomposite is related to the concentration of fillers inside the matrix because conductive networks formed at certain graphene content between 2.0 and 2.5 wt.%. To quantitavely understand the abrupt change in the electrical conductivity, we have considered the material (PCM/graphene) at nanoscale by seeting the domain(350 nm×350 nm). We proposed a model that traduce realistic virtual structure of the nanocomposite through the optimization of embedded graphene nanoparticles: shape, volume fraction, size distribution, and spatial arrangement. This model is based on Voronoi function and B-Spline curves as shown in Figure 6. At low GNP content, the electrical conductivity of the GNP/paraffin nanocomposites was very close to the conductivity of the paraffin matrix, consequently of no conductive GNP network was formed as shown in Figure 10. It means that the electric charges do not flow effectively in these nanocomposites because of the vast distance between the GNP which make difficulty to form the conductive path inside the paraffin matrix. The increase of GNP leads to a reduction in the average space between neighbors GNP added in composites and the electronic transition by tunneling conduction becomes easier.The alignment of the nanoparticles crisply increases the electrical conductivity of the nanocomposites along the direction of the electrical field. As more GNP were added, the nanoparticules moved close together, and at a certain concentration (percolation threshold), a continuous conductive network of graphene nanoparticles was formed and the conductivity increased by several orders of magnitude.
Figure 10d shows a close view for 3.2 wt.% GNP dispersed in the paraffin forming network exhibited percolation behavior. It illustrates the conductive network which occurs as the GNP are getting close to each other, creating electron paths through the matrix and thus increasing electrical conductivity. The conductive behaviour in these three regimes can be understood from the nanostructure of the composite. When there is no conductive path through the filler, no charge can flow, and the composite remains insulating. On the other hand, if the filler forms a directly connected network, electrons can move through this network, and the composite is conductive. To achieve a highly conducting composite, the intrinsic poor conductivity of parafin wax can be compensated through the use of the conductive GNP that form a conducting network.
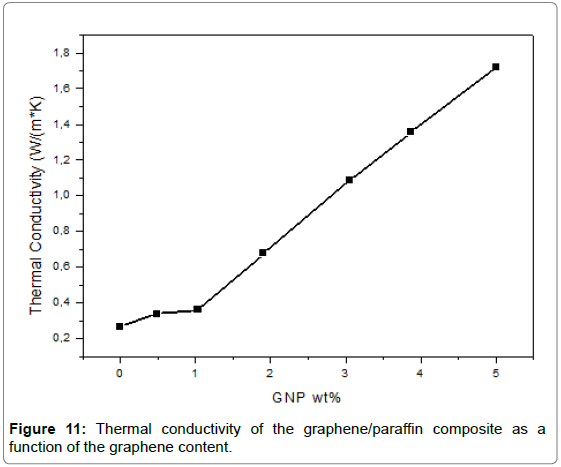
Thermal conductivity: The thermal conductivity of the nano PCM with different graphene concentrations is calculated and represented in Figure 11. The effective thermal conductivity of the composite PCM increases with increasing of graphene contents. The high percentages are involved with a high volume of graphene nanoparticles which results in a increase in the conductive paths for heat flow.
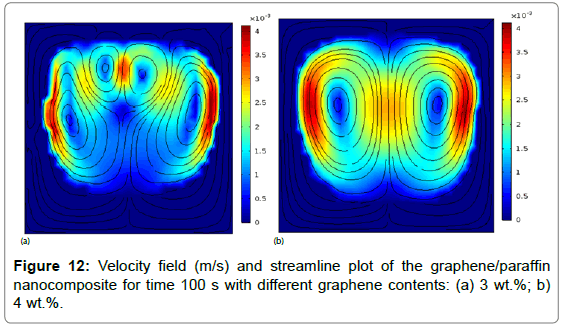
Velocity field: The velocity magnitude distribution and streamline plot of the nanocomposite with different concentration of GNP are figured out in Figure 12. At the onset of melting process, the phase change of the nanocomposite material from solid to liquid phase starts from the center.As the density of PCM reduces, the nanocomposite is melted and transfer upward transfered due to the presence of the buoyancy force. At nanocomposite with 3 wt.% of graphene contents, the velocity streamlines form four snapshots inside the media (Figure 12a) and the symmetry of the circulation pattern is still preserved. At the right side, the direction of circulation is clockwise and anti-clockwise at the left side.During fusion process, two identical circulations (eddies) of velocity streamlines inside the composite at 4 wt.% of graphene contents appear as shown in Figure 12b. Moreover, the vortices are symmetric and a small distance between the two vortex centers is observed.
Voltage effect
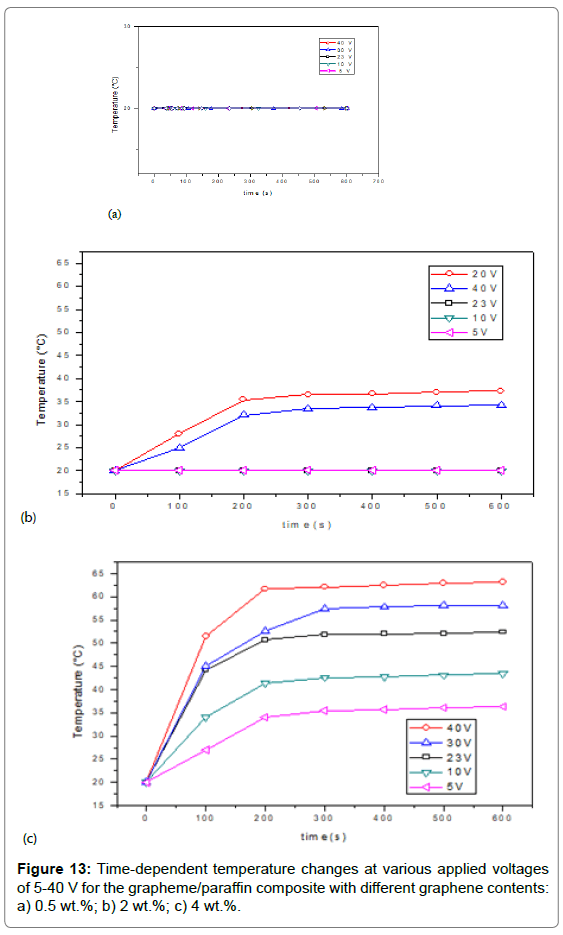
Electric heating experiments of the graphene/paraffin composite with different graphene contents were carried out by varying the applied voltage in the range of 5-40 V. When an external voltage of 30 V was applied to the composite, the temperature was momentarily increased. By observation the temperature of the composite at an applied voltage with the time, the electrical heating behavior was investigated. Figure 13 displays time-dependent temperature changes of the composite with different graphene contents at various applied voltages. For the nano-PCM with 0.5 wt.% graphene content, there was no temperature change over the applied voltage range of 5-40V (Figure 13a), which demonstrates that there was no electric heating behavior. In case of the nano-PCM with 2.0 wt.% graphene, the temperature was not changed with time at relatively low applied voltages of 5-23 V (Figure 13b). But, a considerably increase in temperature of the studied nanocomposite material was observed with time due to the application of voltages above 20 V. Then, maximum temperatures were attained within 300 s and maintained constant over time.
This electric heating behavior was similarly monitored for other composite with higher graphene contents of 3.0-4.5 wt.%, except for the fact that the great temperature attained at a given applied voltage was higher for the nanocomposite with higher graphene contents (Figure 13c). So the nanocomposites with higher GNP weight could have longer electrical network path, resulting a higher electrical conductivities Therefore, much more current flows resulting in higher temperature. Thanks to the high thermal conductivity of the GNP nanoparticles, the saturated temperature is easily reached in a faster and easier way while increasing voltage.
Conclusion
In this study, a Finite Element Method (FEM) were investigated for solving the energy, electric and dynamics equations in the composite material (paraffin wax/graphene nanoparticles).
Based on the numerical results, we proved that:
• The effective electrical conductivity of the nanocomposite increases sharply with the concentration of graphene nanoparticles.
• The random dispersion of graphene nanoparticles inside paraffin wax matrix predicts an Electrical Percolation Threshold (EPT) around of 2.5wt.%.
• Below this value of EPT, electrical conductivities were around of about 3.5×10⁻¹² to 7.3×10⁻¹¹ S/m, which was quite similar with that of the pure paraffin i.e 1.6×10⁻¹⁴ S/m because the absence of connected pathways in the materials.In this state, Graphene/paraffin wax nanocomposites are suitable materials for applications requiring insulation that has a low electrical conductivity and important thermal properties.
• Above the same value of EPT, the well-dispersed electrically conductive GNP networks were found to act as nanoheaters integrated in the paraffin matrix through simple Joule heating when an electric current was passed through them. In this state, Graphene/paraffin wax nanocomposites are suitable materials for electric heating applications, having appropriate thermal properties.
• The expansion of paraffin wax is the most important factor for the decreasing of electrical conductivity in the composite GNP/ paraffin wax.
• The increase of applied voltage involved an increase of the nanocomposite temperature at high concentration level of graphene (above EPT) nevertheless without effect at low concentration (below EPT).
• The effective thermal conductivity of the nanocomposite increases linearly with the concentration of graphene nanoparticles.
References
- Guo S, Liu Q, Zhao J, Jin G, Wu W, et al. (2018) Mobilized thermal energy storage: Materials, containers and economic evaluation. Energy Convers Manag 177: 315-329.
- Iten M, Liu S (2014) A work procedure of utilising PCMs as thermal storage systems based on air-TES systems. Energy Convers Manag 77: 608-627.
- Nazir H, Batool M, Bolivar Osorio FJ, Isaza-Ruiz M, Xu X, et al. (2019) Recent developments in phase change materials for energy storage applications: A review. Int J Heat Mass Transf 129: 491-523.
- Lin Y, Alva G, Fang G (2018) Review on thermal performances and applications of thermal energy storage systems with inorganic phase change materials. Energy 165: 685-708.
- Kenisarin MM, Kenisarina KM (2012) Form-stable phase change materials for thermal energy storage. Renew Sustain Energy Rev 16: 1999-2040.
- Khan Z, Khan ZA (2017) An experimental investigation of discharge/solidification cycle of paraffin in novel shell and tube with longitudinal fins based latent heat storage system. Energy Convers Manage 157-167.
- Zheng H, Wang C, Liu Q, Tian Z, Fan X (2017) Thermal performance of copper foam/paraffin composite phase change material. Energy Convers Manag 157: 372-381.
- Jafari M, Rahimi A, Shokrolahi P, Langroudi AE (2014) Synthesis of antistatic hybrid nanocomposite coatings using surface modified indium tin oxide (ITO) nanoparticles. J Coatings Technol Res 11: 587-593.
- Liang C, Lingling X (2019) Microencapsulation of butyl stearate as a phase change material by interfacial polycondensation in a polyurea system. Energy Convers Manage 50: 723-729.
- Ebadi S, Tasnim SH, Aliabadi AA, Mahmud S (2018) Melting of nano-PCM inside a cylindrical thermal energy storage system: Numerical study with experimental verification. Energy Convers Manage 166: 241-259.
- Chaichan MT, Kamel SH, Al-Ajeely ANM (2015) Thermal conductivity enhancement by using nanomaterial in phase change material for latent heat thermal energy storage systems. Multidisciplinary Int Peer Review J 5: 48-55.
- Nakao S, Yonemura K, Akamatsu K, Katayama R, Ogawa M (2019) A facile microencapsulation of phase change materials within silicone-based shells by using glass capillary devices. Colloids and Surfaces: A Â Physicochemical and Engineering Aspects 567: 297-303.
- Chowdhury S, Olima M, Liu Y, Saha M, Bergman J, et al. (2016) Poly dimethylsiloxane/carbon nanofiber nanocomposites: fabrication and characterization of electrical and thermal properties. Int J Smart Nano Mater 7: 236-247.
- Li B, Zhong WH (2011) Review on polymer/graphite nanoplatelet nanocomposites. J Mater Sci 46: 5595-5614.
- Mutiso RM (2013) Electrical percolation in metal nanowire networks for bulk polymer nanocomposites and transparent conductors, and resistive switching in metal/polymer nano-gap devices. ProQuest.
- Das RN, Lin H, Lauffer JM, Rowlands M, Card N, et al. (2008) Printable nanocomposites for electronic packaging. Polymer Nanocomposites 607: 2-5.
- Yuksel R, Uysal N, Aydinli A, Unalan HE (2018) Paper based, expanded graphite/polypyrrole nanocomposite supercapacitors free from binders and current collectors. J Electrochem Soc 165: A283-A290.
- Rahim I, Shah M, Iqbal M, Wahab F, Khan A (2017) Fabrication and electrical characterizations of graphene nanocomposite thin film based heterojunction diode. Phys B Condens Matter 524: 97-103.
- Shrivastava S, Jadon N, Jain R (2016) Next-generation polymer nanocomposite-based electrochemical sensors and biosensors: A review. TRAC Trends Anal Chem 82: 55-67.
- Jafari M, Rahimi A, Shokrolahi P, Langroudi AE (2014) Synthesis of antistatic hybrid nanocomposite coatings using surface modified Indium Tin Oxide (ITO) nanoparticles. J Coatings Technol Res 11: 587-593.
- Webb AJ, Szablewski M, Bloor D, Atkinson D, Graham A, et al. (2013) A multi-component nanocomposite screen-printed ink with non-linear touch sensitive electrical conductivity. Nanotechnology 24: 165501.
- Karaipekli A, Biçer A (2017) Thermal characteristics of expanded perlite/paraffin composite phase change material with enhanced thermal conductivity using carbon nanotubes. Energy Convers Manag 134: 373-381.
- Agyenim F, Hewitt N, Eames P, Smyth M (2010) A review of materials, heat transfer and phase change problem formulation for Latent Heat Thermal Energy Storage Systems (LHTESS). Renew Sustain Energ Rev 14: 615-628.
- Li M (2013) A nano-graphite/paraffin phase change material with high thermal conductivity. Appl Energy 106: 25-30.
- Ling Z, Chen J (2015) Thermal conductivity of an organic phase change material/expanded graphite composite across the phase change temperature range and a novel thermal conductivity model. Energy Convers Manag 102: 202-208.
- Alimohammadi M, Aghli Y, Alavi ES, Sardarabadi M, Passandideh-Fard M (2017) Experimental investigation of the effects of using nano/phase change materials (NPCM) as coolant of electronic chipsets, under free and forced convection. Appl Therm Eng 111: 271-279.
- Motahar S, Alemrajabi AA, Khodabandeh R (2017) Experimental study on solidification process of a phase change material containing TiO2 nanoparticles for thermal energy storage. Energy Convers Manag 138: 162-170.
- Kant K, Shukla A, Sharma A, Biwole PH (2017) Heat transfer study of phase change materials with graphene nano particle for thermal energy storage. Sol Energy 146: 453-463.
- Arasu AV, Mujumdar AS (2012) Numerical study on melting of paraffin wax with Al2O3 in a square enclosure. Heat and Mass Transfer 39: 8-16.
- Wang Y, Gao X (2016) Preparation and thermal performance of paraffin/Nano-SiO2 nanocomposite for passive thermal protection of electronic devices. Appl Therm Eng 96: 699-707.
- Shirazi HN, Mohebbi F, kakavand MRA, Rabczuk T (2016) Paraffin nanocomposites for heat Management of lithium-ion batteries: A computational investigation. J Nanomater 2016: 1-10.
- Zhang K, Han B, Yu X (2012) Electrically conductive carbon nanofiber/paraffin wax composites for electric thermal storage. Energy Convers Manag 64: 62-67.
- Deka MJ, Chowdhury D (2019) Surface charge induced tuning of electrical properties of CVD assisted graphene and functionalized graphene sheets. J Mater Sci Technol 35: 151-158.
- Papageorgiou DG, Kinloch IA, Young RJ (2017) Mechanical properties of graphene and graphene-based nanocomposites. Prog Mater Sci 90: 75-127.
- Moradi Z, Vaezzadeh M, Saeidi M (2018) Temperature-dependent thermal expansion of graphene. Phys A Stat Mech Its Appl 512: 981-985.
- Chen Q, Zhu H (2017) Structural Characterizations of Graphene. Graphene pp: 13-26.
- Kou XY, Tan ST (2010) A simple and effective geometric representation for irregular porous structure modeling. Comput Aided Des 42: 930-941.
- You YH, Kou ST, Tan ST (2016) A new approach for irregular porous structure modeling based on centroidal Voronoi tessellation and B-spline. Comput Aided Des Appl 13: 484-489.
- Bertoncelj B (2016) A voronoi-diagram analysis of the microstructures in bulk-molding compounds and its correlation with the mechanical properties. Express Polym Lett 10: 493-505.
- Rosen DW (2014) Multiscale, heterogeneous computer aided design representation for metal alloy microstructures. J Comput Inf Sci Eng 14: 41003.
- Chu K, Park SH (2016) Electrical heating behavior of flexible carbon nanotube composites with different aspect ratios. J Ind Eng Chem 35: 195-198.
Citation: Mhiri H, Jemni A, Sammouda H (2019) Numerical Study of Electrically Conductive Graphene/Paraffin Wax Nanocomposites. Innov Ener Res 8: 231.
Copyright: © 2019 Mhiri H, et al. This is an open-access article distributed under the terms of the Creative Commons Attribution License, which permits unrestricted use, distribution, and reproduction in any medium, provided the original author and source are credited.
Share This Article
Recommended Journals
Open Access Journals
Article Usage
- Total views: 3170
- [From(publication date): 0-2019 - Dec 19, 2024]
- Breakdown by view type
- HTML page views: 2530
- PDF downloads: 640
