Research Article Open Access
Numerical Optimization of Biogas Production through a 3-Steps Model of Anaerobic Digestion: Sensitivity of Biokinetic Constants Values
| Amal Zayen1 and Hatem Ksibi2* | |
| 1CBS, Route Sidi Mansour, Sfax, P.O. Box 1177, 3018, Tunisia | |
| 2Sfax University, LASEM, Route Soukra, Sfax, P. Box 1173, 3038, Tunisia | |
| Corresponding Author : | Hatem Ksibi Sfax University IPEIS Route Menzel Chaker Sfax 11172, 3018 Tunisia E-mail: hatem.ksibi@ipeis.rnu.tn |
| Received: April 24, 2015 Accepted: June 24, 2015 Published: June 26, 2015 | |
| Citation:Zayen A, Ksibi H (2015) Numerical Optimization of Biogas Production through a 3-Steps Model of Anaerobic Digestion: Sensitivity of Biokinetic Constants Values. J Bioremed Biodeg 6: 302. doi:10.4172/2155-6199.1000302 | |
| Copyright: ©2015 Zayen A, et al. This is an open-a ccess article distributed under the terms of the Creative Commons Attribution License, which permits unrestricted use, distribution, and reproduction in any medium, provided the original author and source are credited | |
| Related article at Pubmed, Scholar Google | |
Visit for more related articles at Journal of Bioremediation & Biodegradation
Abstract
Anaerobic digestion (AD) of organic substrates can produce biogas, which consists mainly of methane and carbon dioxide. The objective of this study is to perform, for a given wastewater, useful numerical simulations following model number 1 by integrating an optimization sequence to show biokinetic constants effects on the biogas production rate. Therefore, we obtain via an accurate and simple simulation with less time of calculations a reliable estimation of biokinetic values. Indeed, we evaluate the effect of certain biokinetic constants on the response of 3-steps AD model to select the most significant ones. Thus, the constants in question were varied in specific ranges by setting the others. We conclude that main parameters were saturation constant for acidogenic bacteria (KS1), the solublization rate per unit of acidogenic biomass (�) and the yield coefficient for the yield of volatile acids from soluble organics (Yb) they have an important effect on the biogas production rate Q max and period to reaches its plateau value.
| Keywords |
| Anaerobic digestion; ADM1; Haldane; Monod; Optimization; Biokinetic constants |
| Introduction |
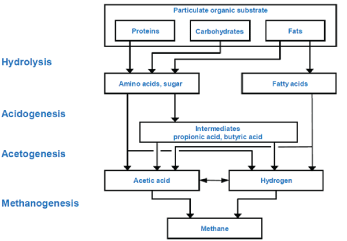
| Anaerobic digestion (AD) modeling is an established method for assessing anaerobic wastewater treatment for design, systems analysis, operational analysis, and control. Anaerobic treatment of domestic wastewater is a relatively new, but rapidly maturing technology, especially in developing countries, where the combination of low cost, and moderate-good performance are particularly attractive. The anaerobic digestion is a biochemical process in which bacteria biodegrade organic matters into biogas (methane and carbon dioxide), (Figure 1). During anaerobic digestion, complex biological, chemical, and physical processes take place in a bioreactor system that is influenced by several process protocols and strategies [1]. The anaerobic degradation of organic matter is a complicated biological process; therefore, many technical reviews were published as Kasiri [2]. The conversion of organic matter consists of several independent, consecutive and parallel reactions in which a close-knit community of bacteria cooperates to form a stable, self-regulating fermentation that transforms organic matter into a mixture of methane and carbon dioxide gases. These processes go through six main stages: hydrolysis of biopolymers (proteins, carbohydrates, proteins) into monomers (amino-acids, sugars and long chain fatty acids); fermentation of amino-acids and sugars; anaerobic oxidation of long chain fatty acids and alcohols; anaerobic oxidation of intermediary products such as volatile fatty acids, conversion of acetate to methane and the conversion of hydrogen to methane, (Figure 2). These can be carried out either manually by plant personnel or automatically through process control software. In a well-operated AD reactor, the methane content is sufficiently large to make the biogas combustible; that is, the AD process produces applicable energy. Moreover, the reactor digestate is often high in nutrients and can be used in fertilization. |
| Several simulation models of the process in stirred tank bioreactors have been proposed by several authors such as Hill and Barth and Angelidaki and Simeonov [3-5] described the hydrolysis of undissolved proteins and the hydrolysis of undissolved carbohydrates as separate paths. Their model included 8 bacterial groups, 19 chemical compounds and a detailed description of pH and temperature characteristics. The specific growth and decay rates can also be presented by differing levels of complexity. |
| The IWA Task Group developed ADM1 model (anaerobic digestion model No 1) for Mathematical Modeling of Anaerobic Digestion Processes [6]. The model reflects the major processes that are involved in the conversion of complex organic substrates into methane and carbon dioxide and inert by-products. The models described require the simultaneous solution of mass-balance equations for each individual substrate and bacterial group. Such a treatment is extremely complex yielding equations with numerous unknown parameters. The increased interest in these processes has simulated mathematical modeling, because it is usually much faster and less expensive to model a system and to simulate its operation than to perform laboratory experiments. |
| However, the ADM1 model employs a large number of constants and coefficients. Given the model complexity, it was impossible to calibrate the model parameters with available experimental data. In these conditions, the question of how to design a model is crucial. Especially the trade-off between model complexity allowing representing most of the known phenomena and adequation with the available experimental information is capital. Then, the objective of this study was to define and evaluate different needed constants used in ADM1 by varying their values and study the sensitivity. |
| This paper is organized as follows. Firstly, we give a literature review of several models. Then we provide a 3 step model of AD description, including the mathematical set of equations used as the basis for state estimation of biogas rate. After, operation conditions are defined in terms of an acceptable range of VFA (volatile fatty acids). The last section presents a parametric study where effects of different constants were shown via numerical optimization, which can be applicable to several AD bioreactors. Finally, we present in the conclusion a predictive method of best values for a given numerical simulation. |
| Modeling |
| Anaerobic digestion of highly concentrated organic pollutants was used in AD. This process is a very complicated and involved hundreds of possible intermediate compounds and reactions, each of which catalyzed by specific enzymes or catalysts. Many of the transformations can be accomplished by one of several alternative metabolic pathways, and biochemists and microbiologists continue with their attempts to define and describe more precisely the various mechanisms. The overall biochemical reaction can be illustrated by the following scheme [1]: |
| The experimental data cannot give a detailed insight into the biological process, since the measurements lump together several components and give therefore only a global view. Especially the segregation of biomass is delicate because there is no accessible quantitative measure for the different compartments. For this reason, the modeling approach is essentially macroscopic. |
| First attempts of modeling anaerobic digestion resulted in simple stationary models that tried to predict theoretical biogas composition and yield of a given substrate. Supposing complete substrate use, the maximum biogas yield can be calculated given that the elementary composition of the digested substrate is known. However, dynamic effects and varying process conditions (e.g., temperature, pH, etc.) cannot be considered. Thus, dynamic models of the process of anaerobic digestion have been created since the late 1960’s. |
| When the anaerobic digestion process is conducted with membrane bioreactor (MBR), the mathematical model is developed using the assumptions that there is a perfect mixing in the reactor and the membrane is operated without cake deposition. This assumes that we consider the ideal case of filtration in which the driving force and filtration velocity remain unchanged during the process. |
| Specific growth rate |
| The specific growth rate of bacteria, noticed μ is the number of individuals produced by each individual in the population over some unit of time. If a substrate metabolized by the microorganism is growthlimiting at lower concentrations and growth-inhibiting at higher concentrations, then the specific growth rate/t is a function p(s) of the substrate concentration s, concave for lower, and convex for higher values of s. A convenient way to model such a concave convex function i. Since Growth bacterial cultures kinetics was assumed by Monod [7] and reviewed by Lawrence and McCarty [8] for bacterial growth on acetate it has been used for description of acetoclastic methanogenesis in a several published papers, the most |
| referenced and cited is that of Jeong et al. [9]. The Monod specific growth is expressed as follows: |
| The observed decrease in methanogenic activity caused by a drop in temperature, for example, varies in different anterior works. Furthermore, half-saturation constants (Ks) of acetate methanation have been reported both to increase [8] and to decrease [10] at lower temperatures. |
| Haldane kinetics have been used to account for the inhibition of acetoclastic methanogenesis by high acetate concentration instead of Monod kinetics [11,12]. |
| Both Monod and Haldane models yield a sigmoidal S-shaped methane accumulation and acetate depletion curves. The kinetic coefficients may be calculated from the batch experiments by fitting all sigmoidal curve data to the integrated Monod and Haldane models, using numerical fitting techniques. Roughly, these curves may be divided on three parts: exponential growth, linear and declining growth phases [13]. |
| AD Biogas production |
| Biogas is one of the main products resulted during the AD process, and consists of carbon dioxide (CO2) and methane (CH4), hydrogen sulfide (H2S), water vapor (H2O) and some traces of other substances depending on the composition of the substrate [14], whereby CH4 and CO2 are the main components [1]. |
| The amount and composition of the biogas formed depends on the amount and composition and the degradability of the substrate, the influence of toxic substances, the process technique and the operation of the plant, [15]. The CO2 formed is balanced with the liquid, thus a higher CO2 content in the biogas leads also to a higher concentration of carbonic acid. Therefore the CO2 content in the gas is a good indicator for the performance of the plant [14]. |
| The one-stage model |
| Many mathematical models of the process in STBR are known. They are usually presented as sets of ordinary non-linear differential equations [16]. In this case, the following two models are considered: – a model based on a one -stage reaction scheme [17]. |
| The equations of the mathematical model are written below: |
| The first equation describes the growth and changes of the biomass X consuming the appropriate substrate S. The first term in the right hand side reflects the growth of the bacteria and the second one reflects the effluent flow rate of liquid. The mass balance for the substrate is described by the second equation, where the first term reflects consumption by the bacteria; the second term reflects the influent flow rate of liquid with concentration of the inlet diluted organics Sin. The last equation in system (1) describes the formation of biogas with flow rate |
| Q. In systems terms the dilution rate D is the control input, the output is the biogas flow rate |
| Q, and Sin is a disturbance. The quantities K1 and K2 are given as constant parameters. |
| Three-stage model |
| During the first hydrolytic stage, the hydrolytic bacteria produce extracellular enzymes that hydrolyze the organic compounds into simple soluble compounds. The second stage is the acid-producing stage, in which acid-forming bacteria convert simple organic compounds into volatile acids. During the last methanogenic stage, methanogenic bacteria convert volatile fatty acids into methane and carbon dioxide [18]. |
| The growth rate of acidogenic bacteria μ1 is modeled according to the classical Monod Formula eq. 2. The growth rate of methanogenic bacteria μ2 is described using the noncompetitive inhibition model eq. 3. For simplicity, we assume that inhibition by volatile fatty acids occurs only with respect to methanogenic bacteria. In fact, these bacteria are the most sensitive to their growing conditions. |
| The equations of the mathematical model are written below [19]. |
| Numerical Implementation |
| We describe in this section the details of the implementation strategies used in the construction of the code, and we report the first numerical case test by which the convergence of calculation is obtained accurately and give currently available numerical results. The first numerical test shows that the one-step AD code gives well profiles of different concentrations and biogas production rate Q as it was validated numerically by comparing with linearized system results and experimentally, see Mejdoub [20]. Moreover, the implemented methods in the code are developed to a 3 steps Ad simulation characterized by a high precision calculation where the solution of differential equations was carried out numerically using a fourth order Range-Kutta. The code is performed and compiled in FORTRAN (FORmula TRANslator software) |
| Biokinetic Constants Identification |
| Many constants identification studies in AD modelling were published such as Noykova [21] and Haghighatafshar [22]. They performed a curve fit and then interpreted the best-fit parameter values. In fact, they underlined that the applied kinetics were found to affect the outcome of the regression study. Similarly, we used this numerical technique to optimize the dilution rate of the one-stage AD process [20]. Compared to one-stage AD simulation where we had less initial biokinetic constants values, the 3-stages AD simulation, used in numerical case tests and given in Table 2, presents a more complex problem than for non-inhibitory substrates because one fits simultaneously to the equation set (5) kinetic constants, combined growth data to the Monod equation, are not so easily employed for inhibitory models such as the Haldane equation because only a portion of the curve can be linearized. In our case, optimization numerical code with the Hook and Jeevs method (gold number) has been performed to get the best identification. This method is robust when varying the initial conditions. |
| The main calculation step was to determine the parameter set for each substrate 1 and 2 KS, and KI that minimized the differences between the simulation results of the model for a given initial conditions. This allowed us to choose the optimal parameter sets that had the minimum errors in each estimation step. The mathematical model developed was programmed using the iterative integration scheme with least-squares methodology [23]. Other constant parameters (K1, K2, β, yb and yp) are then varied to show effect on the kinetic of AD and to estimate the biogas production rates with respect to dynamic model (3-steps ADM1). |
| Numerical Case Test |
| Here we present several numerical simulations for 3-steps ADM1 set of equations (5), for which we applied half-explicit Runge-Kutta methods. In fact, all examples were studied, discretized and evaluated for each small step of time (0.1 day), and where convergence criterion was based on satisfying an averaged squared error. The dilution parameter D was set as an optimal constant as described in previous works [20]. |
| Before doing the calculation, we have to initialize S0 in and introduce different constant values that will be needed. The first case test that we had run is summarized in Table 2. It contains all basic values that are necessary to perform simulation and to get the temporal quantities of different substrates and biomass concentrations and therefore the biogas production rate. |
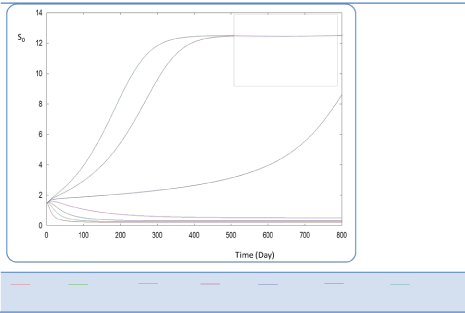
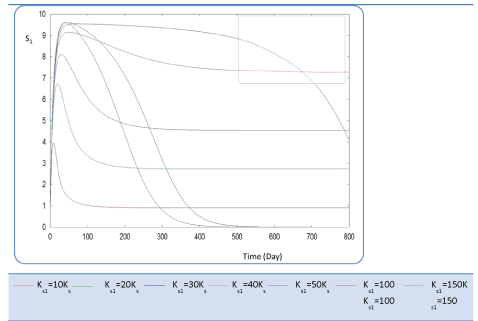
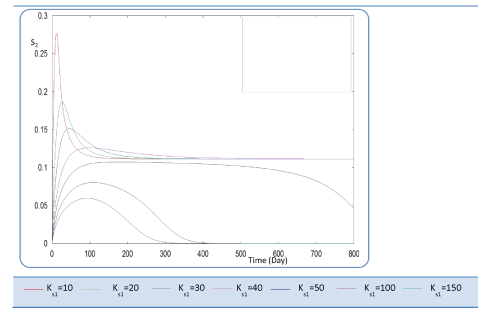
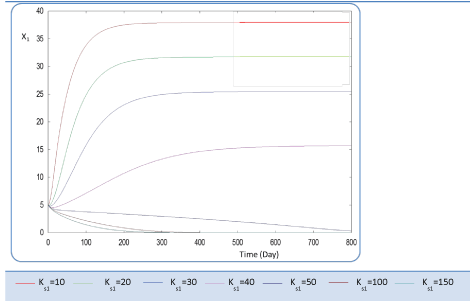
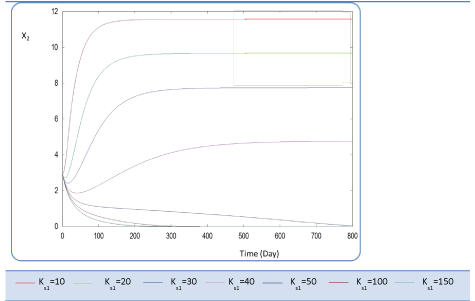
| In the following, the goal was the determination of the evolution of biogas production rate (Q) of an AD bioreactor over a long period. Generally, the variable Q increases sharply at the beginning of the process and reaches a quasi-constant value when the methanisation step is established conveniently. The biogas production rate curve might present various forms according to biokinetic constant values. Indeed, the biodigestion mechanisms of each substrate, as well as the formation of inhibiting substances, act on the biokinetic degradation of wastewater, resulting in different curves for the process. Different profiles of S and X for each substrate were drawn along the defined period [24]. The general behavior of the substrate concentration curve is shown in Figures 3-5. We notice that the variable S reaches a maximum value and then decreases exponentially to a weak level. Whereas the biomass concentration X increases along the same period to attains a constant level at a stationary phase, Figures 6 and 7. Infact the production rate profile (Q) as calculated as a function of X2 consolidates the biomass curve and rapidly reaches a plateau (steady state) (Figure 8). |
| Results and Interpretation |
| Here we present the effect of each biokinetic constant on the different concentrations of substrates and biomasses when varying its value. In this way we can deduce the optimal biogas production rate Q and, and detect the sensitivity of such a constant assessment presented in equations set (5). |
| KS1 effect |
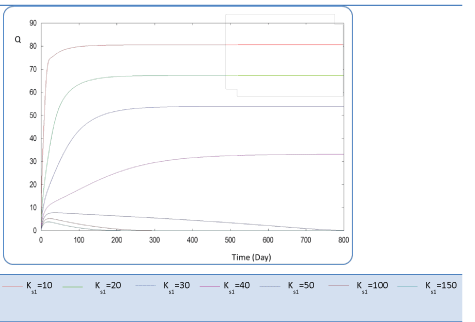
| First, we have calculated using the first case test values the biogas production and varying the half saturation constant KS1 associated with substrate concentration S1. Moreover, this biokinetic constant reflects the affinity of X1 microorganisms to the substrate S1. From Figure 3 we underline that more KS1 value is lower the affinity is high. Thus, by increasing the value of KS1, consumption of S0 diminishes and consequently its concentration increases. Similarly, evolutions of S1 and S2 vary quasi-identically with Ks1 graphically but differ enormously in magnitude (Figures 4 and 5). When our goal is to maximize the production of biogas expressed by Q, the value of the lowest KS1 provides a stable and maximum production Q (exceeds 80 l/l.day). KS1 values superior to 50 g/l, biogas production vanishes after some time (Figure 8). |
| KS2 effect |
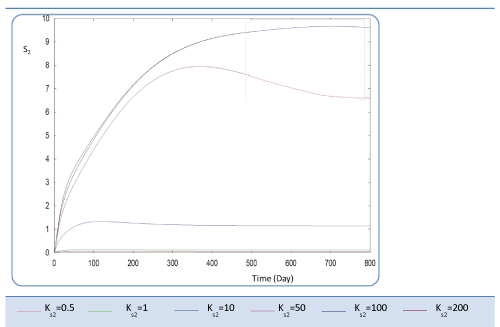
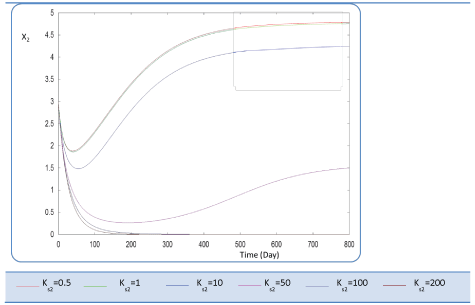
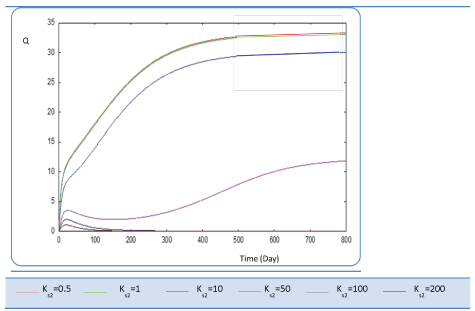
| Before analyzing effect of KS2 on the biogas production rate Q, let mention that KS2 cannot appear in equation balances of S0, S1 and X1. Also, we underline that there is no effect of this biokinetic constant on these parameters. In fact KS2 is the half saturation constant associated with S2. It reflects the affinity of X2 microorganisms for substrate S2. We have chosen several values sweeping different ranges; these are the used values: {0.1-0.5-1-10-50-100-200}. First, when KS2 is tiny (0.1), the simulation is strongly perturbed and convergence cannot obtained. At weak levels of KS2, we note from Figure 9 that substrate concentration S2 is not altered and remains constant: More KS2 value, the lower the affinity is high. Whereas, the biomass concentration (X2) decreases at the beginning and jumps after a long period (more than 300 days) to its static value (Figure 10). We notice that the optimal biogas production rate exceeds. |
| 30 after 500 days for a KS2 comprised between 0.5 and 1. This resulted in a stable and optimal biogas for KS2 = 1 g/L. A reduction of this constant below this value is irrelevant (For Ks2 = 0.5 and = 1, Q profiles are combined, Figure 11). |
| Ki effect |
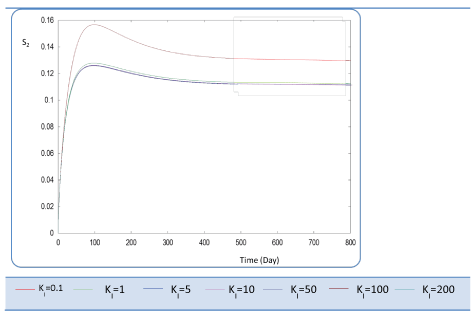
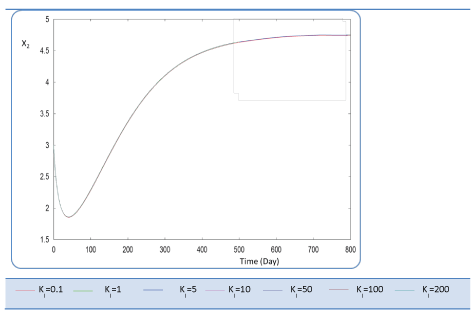
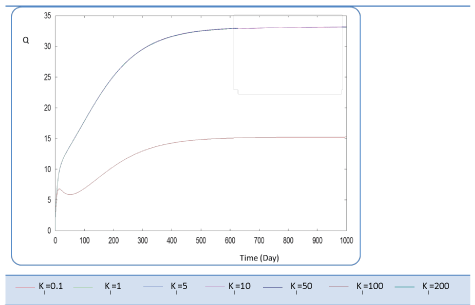
| Ki is the inhibition constant associated with S2. This constant is in the μ2 equation. This variable is set at different values sweeping a large interval Ki :{0.1 - 1- 5 - 10 - 50 - 100 - 200}. S2, X2 Profiles show that for Ki values greater than 0.1 g/L, this constant has no significant effect (Figures 12 and 13). The biogas production Q is superior to 30 for several inhibition constants except when it reaches static plateau, except for profile drawn at Ki=0.1 (Figure 14). |
| β effect |
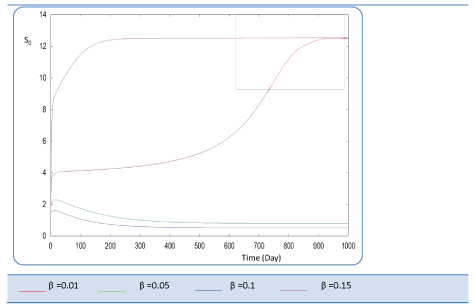
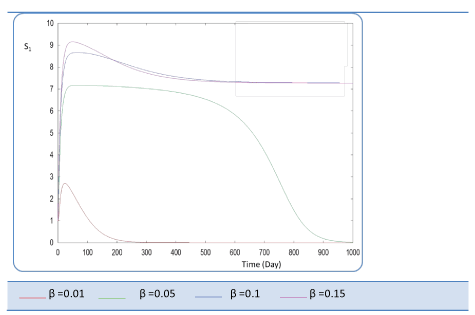
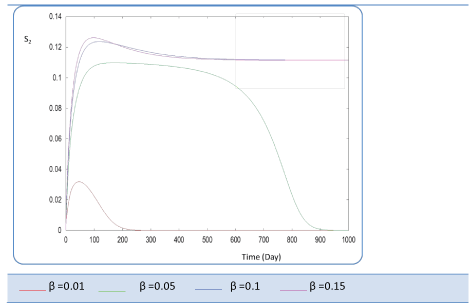
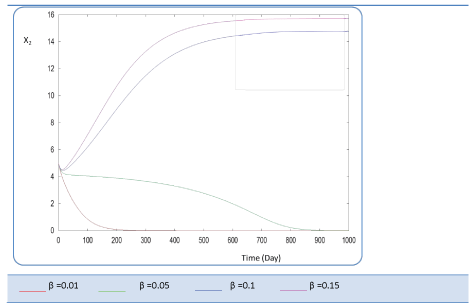
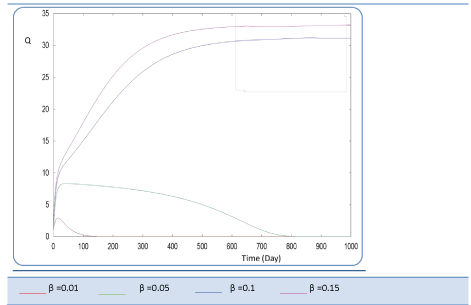
| Known as solubilization rate per unit of acidogenic biomass, the parameter β is set at several values as follows; β= 0.01 - 0.05 – 0.1 – 0.15 – 1. The last value gives a run error, perhaps it is a very high value which necessitates the solubilization of all acidogenic biomass. A quick look of S0, S1, S2, X1, X2 profiles and also Q curve in response to small changes in β shows that this constant has a very significant effect on these profiles. From Figure 15 we notice that S0 increases abruptly when β increases, whereas the increasing velocity of substrate concentration S1 and S2 is lower than the first case (Figures 16 and 17). For a very low value of β (β = 0.01 l/g X1.j), biogas production is stable and optimal. Against by, larger values (β = 0.1-0.15 l/g X1.j) provide low yields and which cancel after some time (Figure 18). Concerning the biogas rate Q, it exceeds stable plateau at 30 after more-less 400 days as an optimal biogas production rate of the AD bioreactor (Figure 19). |
| Yp effect |
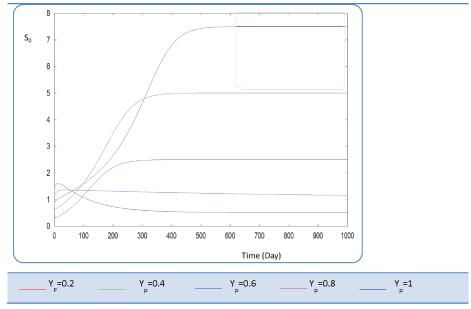
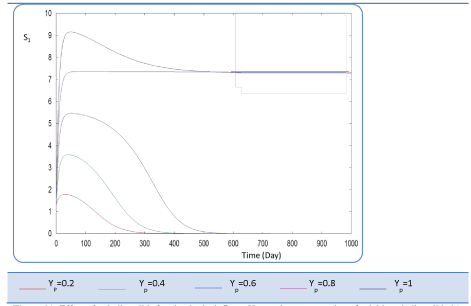
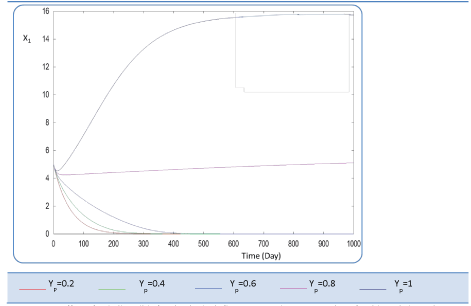
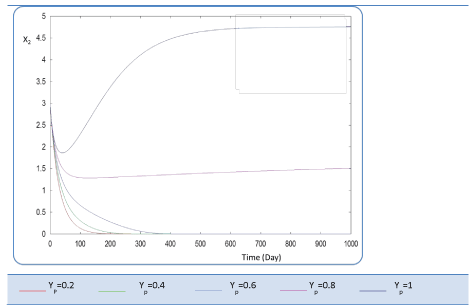
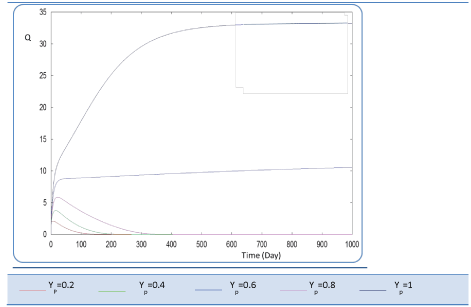
| In the given numerical case tests, we have varied the variable Yp from 0.2 to the unity. In fact the fraction of volatile solids in the influent that can be solubilized Yp takes successively followed values 0.2, 0.4 , 0.6, 0.8, and finally1, (Figure 20). Concerning S0, it exceeds a maximum value at this Yp range whereas S1 and S2 increase continually when Yp increases, (Figures 21 and 22). Concentrations X1 and X2 get approximatively same curves for each value of Yp, (Figures 23 and 24). A retrograde zone at the beginning of the process and thereafter each biomass concentration reaches its plateau value. For complete solubilzation of volatiles solids in the influent (Yp values approaching 1) the stability of response is observed Q. |
| Hereby the biogas rate reaches its maximum of 30 l/l.day after a long period of 500 days. From Figure 25, we can also notice that very low solubilization (Yp = 0.2 g COD/g m.vol ) and also medium fraction (Yp = 0.4- 0.6 g COD/g m.vol) the biogas production is low and vanishes after a while. |
| Yb effect |
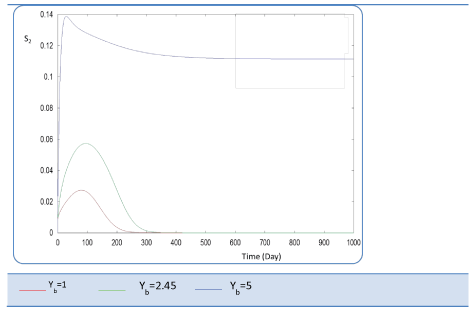
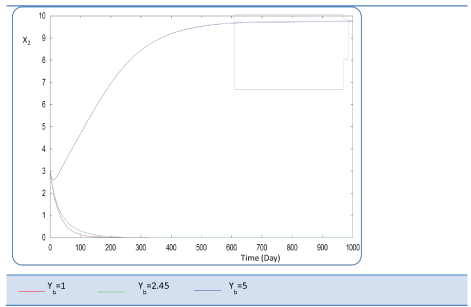
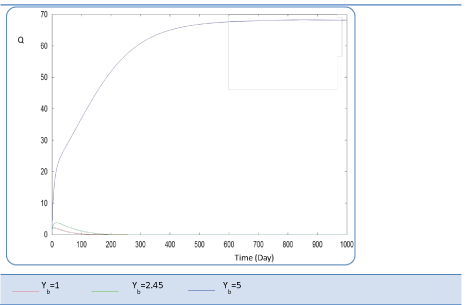
| This last variable expresses the yield coefficient for the yield of volatile acids from soluble organics that means the ration. It was varied as follows: 1; 2.45 and 5. The done calculations inform that Yb behaves in a similar manner to Yp. Indeed, for Yb = 5 g AGV/g m.org, biogas production is stable and optimal. Beyond this last value of Yp, there is no stability of all S and X concentration profiles and therefore of Q curve. Let mention also that several concentrations of substrate and biomass variation follows similarly their variation when yp increased, (Figures 26 and 27). The biogas production rate reaches a crucial maximum value of 65 l/l.day after a stabilization period of 300 days, (Figure 28). |
| Conclusion |
| An appropriate nonlinear model of the anaerobic digestion of waste has been developed. It can be used for AD process biogas production as well as for its control. In order to show the performance of numerical modeling, we proposed an integration of the nonlinear 3-steps AD model through semi explicit of RK method (fourth order precision) while achieving the sensitivity of main biokinetic constants on the biogas production rate. Furthermore, a parametric study was conducted in order to identify the most significant biokinetic parameters of the model and their coefficient values. In fact, we can conclude that KS1, β and Yb are the most significant parameters of the model. This paper presented some guidelines and advice-helps to researchers involved in such experiments to try to interpolate and extrapolate their biogas production units for considerable scales in future studies |
References
|
--
Tables and Figures at a glance
| Table 1 |
Figures at a glance
 |
 |
 |
 |
 |
| Figure 1 | Figure 2 | Figure 3 | Figure 4 | Figure 5 |
 |
 |
 |
 |
 |
| Figure 6 | Figure 7 | Figure 8 | Figure 9 | Figure 10 |
 |
 |
 |
 |
 |
| Figure 11 | Figure 12 | Figure 13 | Figure 14 | Figure 15 |
 |
 |
 |
 |
 |
| Figure 16 | Figure 17 | Figure 18 | Figure 19 | Figure 20 |
 |
 |
 |
 |
 |
| Figure 21 | Figure 22 | Figure 23 | Figure 24 | Figure 25 |
 |
 |
 |
| Figure 26 | Figure 27 | Figure 28 |
Relevant Topics
- Anaerobic Biodegradation
- Biodegradable Balloons
- Biodegradable Confetti
- Biodegradable Diapers
- Biodegradable Plastics
- Biodegradable Sunscreen
- Biodegradation
- Bioremediation Bacteria
- Bioremediation Oil Spills
- Bioremediation Plants
- Bioremediation Products
- Ex Situ Bioremediation
- Heavy Metal Bioremediation
- In Situ Bioremediation
- Mycoremediation
- Non Biodegradable
- Phytoremediation
- Sewage Water Treatment
- Soil Bioremediation
- Types of Upwelling
- Waste Degredation
- Xenobiotics
Recommended Journals
Article Tools
Article Usage
- Total views: 15364
- [From(publication date):
July-2015 - Jul 09, 2025] - Breakdown by view type
- HTML page views : 10401
- PDF downloads : 4963
