Research Article Open Access
New PVT Correlations Based on Libyan Crudes for Predicting Fluid Physical Properties
Khazam M*, Shlak M and Alkhaboli MDepartment of Petroleum Engineering, University of Tripoli, Libya
- *Corresponding Author:
- M Khazam
Department of Petroleum Engineering
University of Tripoli, Tripoli, Libya
Tel.: +218 21-4627901
E-mail: mohsenkhazam@gmail.com
Received Date: November 15, 2016; Accepted Date: November 22, 2016; Published Date: November 28, 2016
Citation: Khazam M, Shlak M, Alkhaboli M (2016) New PVT Correlations Based on Libyan Crudes for Predicting Fluid Physical Properties. Oil Gas Res 2:122. doi: 10.4172/2472-0518.1000122
Copyright: © 2016 Khazam M, et al. This is an open-access article distributed under the terms of the Creative Commons Attribution License, which permits unrestricted use, distribution, and reproduction in any medium, provided the original author and source are credited.
Visit for more related articles at Oil & Gas Research
Abstract
PVT properties are very important in reservoir and production engineering analyses such as material balance calculations, well testing, reserve estimation, inflow performance, production operations and design of surface facilities. New empirical PVT correlations have been developed for Libyan crudes with reliable degree of accuracy. These include; bubble point pressure (Pb), oil formation volume factor (Bo), gas solubility (Rs), stock tank oil molecular weight (Mwt), dead oil viscosity (μod), saturated oil viscosity (μob), under-saturated oil viscosity (μo), and oil compressibility (Co). Around 300 PVT samples collected exclusively from Libya, mainly Sirte, Ghadames and Murzuq basins, were used in our study to develop the above PVT correlations and covered wide range of API gravity (26 to 51°API) and reservoir temperature (100 to 313°F) normally found in Libyan reservoirs. Minitab regression tool was extensively used in our study to develop the PVT correlations and to statistically appraise them against the industry published correlations. The new proposed PVT correlations have demonstrated much better performance compared to the industry published correlations when tested for Libyan crudes. Also, Artificial Neural Network (ANN) models have been developed for Libyan PVT properties predictions. The models show acceptable accuracy and generally are more accurate than the empirical correlations.
Keywords
PVT properties; Empirical correlations; Artificial neural network
Nomenclature
API: Stock-tank oil gravity from flash separation, °API;
Bob: Oil formation volume factor at bubble-point pressure;
Mwt: Molecular weight of stock-tank oil;
Pb: Bubble-point pressure, (Psia);
Ps: Actual separator pressure, (Psia);
Rs: Total producing gas/oil ratio from flash separation, SCF/STB;
T: System temperature, °F;
Ts: Actual separator temperature, °F;
Yg: Gas mole fraction;
μod: Dead oil Viscosity (cP);
μob: Saturated oil Viscosity (cP);
μo: under saturated oil Viscosity (cP);
CO: Isothermal Compressibility Coefficient (psi-1);
ARE: Average relative error (%);
AARE: Absolute average relative error (%);
ANN: Artificial Neural Network;
γo: Specific gravity of stock-tank oil from flash separation, (water=1.0);
γg: Average specific gravity of total surface gases from flash sep. (air=1.0);
γgs: Gas gravity from separator conditions of 100 psig, (air=1.0);
Kuop: Watson paraffin city characterization factor.
Introduction
The PVT properties are important parameters in reservoir engineering. However, these PVT properties are usually determined from laboratory studies, but in some cases where adequate samples cannot be obtained or during exploration phase, when only produced fluid properties are available from flowing tests, one can rely on the empirical PVT correlations for predicting the physical fluid properties. Such PVT correlations will help the reservoir and production engineers to obtain a preliminary estimate of the oil initially in place, calculation of the recovery efficiency, production capacity, variations in produced gas/oil ratios during reservoir’s production life, etc. During the last 7 decades, several PVT correlations have been published. These empirical correlations are developed based on different data banks and different geographical regions. One of the early attempts for establishing PVT correlations was made by Standing [1]. Graphical correlations were proposed for Pb, and Bo based on 105 experimentally measured data points which were collected from 22 hydrocarbon systems of California oil fields. In 1958, Lasater [2] presented a Pb and Rs correlations based on 158 experimentally measured bubble-point pressures using 137 different crude oil systems from reservoirs in Canada, the U.S., and South America. The natural gases associated with these crudes were essentially free of non-hydrocarbons. Vazquez and Beggs [3] presented a worldwide empirical correlation based on 5008 PVT measurements of 600 samples from all over the world using regression methods. They divided collected data into two groups based on API gravity (i.e. API ≤ 10 and API>30), so that coefficients of developed correlation are different for these two groups. Also they introduced gas gravity at the reference separator pressure (γgs) and used this adjustment factor instead of gas gravity to improve performance of their correlations. In 1980, Glaso [4] proposed empirical correlations for estimating Pb, FVF at saturation pressure, and two-phase FVF. His correlations were derived from the laboratory PVT analyses of North Sea oil which has paraffinicity characterization factor (Kuop) of 11.9, and they can be used for other types of oil/gas mixtures after corrected for the content of non-hydrocarbons in surface gas and paraffinincity. In 1988, Al- Marhoun [5] developed correlations for estimating the Pb, Rs, and Bo for Middle East crude oils. These correlations were developed from a database of 69 bottom hole fluid samples and expressed as functions of reservoir temperature, gas gravity, solution gas-oil-ratio, and the stock tank oil gravity. Al-Marhoun used nonlinear regression methods to develop his correlations. In 1990, Petrosky [6] developed empirical PVT correlations for Gulf of Mexico crude oils. His correlations included the Pb, Rs, and Bo and derived from a total of 128 laboratory analyses. In 1990, Labedi [7] presented correlations for estimating oil FVF, oil density, and oil compressibility. His correlations are mainly function of measurable field data such as first-stage separator pressure and temperature, producing gas/oil ratio, stock-tank oil gravity, reservoir pressure, and reservoir temperature. More than 100 oil samples from three African countries, namely Libya (97 samples), Nigeria (27 samples), and Angola (4 samples) were used for developing his correlations. In 1994, Kartoatmodjo and Schmidt [8] developed a new set of empirical correlations based on a large data collection from reservoirs all over the world. The authors used two independent database; the first database was used to develop the correlations while the second was used as a benchmark for verification purposes. The first database contained 5392 data points, from 740 different crude oil samples, and the second database contained 998 data points. In 1995, Khazam [9] developed empirical PVT correlations for Libyan crude oils. His correlations included the Pb, Rs, and Bo. He used more than 150 PVT data points representing different Libyan crudes, mainly from Sirte basin, and his correlations were developed using nonlinear regression based on the optimization of Standing and Al-Marhoun forms of correlations by changing of their empirical constants for better predictions of Libyan crude properties. With regards to viscosity correlations, the early attempt was made by Beal [10]. Beal has developed two graphical correlations for determining the viscosity of the dead oils and under saturated oils. He used 753 and 26 data sets from United States oil fields for developing dead and under saturated oil viscosity correlations, respectively. Chew and Connally [11] used 2257 data sets which were collected from 457 crude oil samples of the United States, Canada and South America oil fields. He developed a saturated crude oil viscosity correlation in the graphical form and algebraic equation. In 1975, Beggs and Robinson [12] developed two empirical correlations for determining the viscosity of the dead and saturated oils. They used two data banks which were contained 460 dead oil viscosity measurements and 2073 saturated viscosity measurements. In 1992, Rafa Labedi [13] proposed viscosity correlations based on 100 oil PVT samples mainly collected from Libya. His correlations were developed using multiple-regression analysis to predict viscosity at atmospheric pressure (dead oil viscosity), at saturation pressure as well as above and below the saturation pressure. In 1995, Petrosky and Farshad [14] presented three viscosity correlations for Gulf of Mexico crudes. The correlations were presented for dead, saturated and under saturated crude oils viscosity and were derived based on 118, 404 and 864 data sets of viscosity measurements, respectively. The main objectives of this study were to gather more PVT analyses and upgrade our data bank to cover all producing basins in Libya, then to test the reliability of published correlations, including the previous ones developed for Libya [7,9,13]. Finally, to optimize the existing PVT correlations or introduce new correlations if necessary. Our analyses covered wide range of PVT predictions including, bubble-point pressure, gas solubility, oil formation volume factor, oil viscosity, and oil compressibility correlations. The other main objective was to introduce the concept of Artificial Neural Networks (ANN’s) system, as another tool, to predict the same properties. The constructed correlations and ANN’s were function of easy onsite field measurements such as, solution gas oil ratio, API gravity, total produced gas specific gravity and reservoir temperature.
Data Points and Statistical Indicators
All the data points used in this study are exclusively obtained from Libya, mostly for reservoirs from Sirte, Ghadames, Murzuq and offshore basins. On average basis, around 300 PVT sample data points were initially obtained for each property. The actual number of data points after excluding incompetent measurement and screening for unreasonable values are shown in Table 1 below. This table describes the range and number of experimental data points used in our study. Wider range of fluid properties is used in developing our PVT correlations making them much more representative for the crudes of Libya. In order to evaluate the predictions of the PVT correlations in terms of their accuracy, or their dispersion, or even their representation of the suggested model to the measured data, we have used the following common statistical indicators:
• Average per cent relative error
• Average absolute per cent relative error
• Standard Deviation
• R squared
| Property | Range (Min-Max) | Number of PVT Data Points |
|---|---|---|
| Oil FVF (rbbl/stb) | (1.034-2.22) | 312 |
| Oil Gravity | (26-51) | - |
| Temparature (ºF) | (100-313) | - |
| Gas Solubility (scf/stb) | (48-3583) | 285 |
| Gas Gravity (air = 1) | (0.6878-1.677) | - |
| Dead Oil Viscosity | (0.5755-5.96) | 253 |
| Saturated oil viscosity (cP) | (0.0908-2.22) | 103 |
| Under saturated viscosity (cP) | (0.0851-6.056) | 300 |
| Oil Compressibility (Psi^-1) | (6.11E-06-3.91E-05) | 340 |
| Bubble point (Psia) | (128-6344) | 285 |
Table 1: Range of Libyan PVT Properties and Number of Samples.
It should be pointed out that no individual statistical indicator should be thought upon as the ultimate gauge that can decide which correlation is better. Choosing the best correlation was assessed with many statistical indicators and was looked upon as an optimization process where each statistical indicator complements the others. Also scatter plots were constructed along with Pearson correlation in order to evaluate the relationships between variables to help in the process of formulations the new correlations. Residual plots, 3D plots and 45 degree plots were also constructed, beside the statistical indicators, in order to evaluate and visualize the suggested models compared to former studies.
Oil Formation Volume Factor Correlation
Performing multiple linear regression using Minitab after adjusting the following variables; X1=Rs, X2=Rs/API, X3=Rs/�?g, X4=Rs2/API2, and X5=T-Rs. The best regression analysis results were obtained by using the following oil FVF relation:

Where,
Bo=Oil FVF (rbbl/stb)
γg=Average specific gravity of total surface gases from flash separation (air=1)
Rs=Gas solubility (scf/stb)
T=System temperature, (°F)
API=Stock-tank oil gravity from flash separation (°API)
The first term is a constant that is close to unity followed be a second term that fully depicts the effect of API as well as Gas gravity and the effect of Rs. The third term partially depicts the Rs effect while fully represents the temperature effect. Table 2 below describes the statistical indicators of different industry published Bo correlations with our new formulated Bo correlation for Libyan crudes. As indicated from the this table, the new proposed correlation in this study has relatively better accuracy over the published industry correlations. Taking into account the sensitivity of Bo in reserve estimations and simplicity and accuracy of our correlation, therefore, the new proposed correlation can be adopted to best represent the Libyan crude oils. Figure 1 presents the incremental impact of X variables on the increase in R-squared value. As it is observed from the figure how much did each variable increase the R-squared value of the correlation? The gas solubility (Rs) is the most contributing factor to increase of R-squared value. The new developed correlation yielded a close to accurate prediction of the experimental Bo with R-squared equal to 97.86%, as shown in Figure 2 in the green side. Figure 3 below provides a better understanding of the reliability of the proposed new Bo correlation in compression to the industry published correlations using 45 line graphs. As one can see how the points are within a close fit of the measured Bo for our new correlation and Khazam [9] correlation which was developed for the same Libyan crude but with less data samples than those used in our new correlation.
| Correlations | ARE, % | AARE, % | SD, % | R^2, % |
|---|---|---|---|---|
| Standing (1947) | -1.07 | 2.90 | 3.99 | 95.16 |
| Vazquez & Beggs (1980) | 2.29 | 3.65 | 4.04 | 93.03 |
| Glaso (1980) | 1.68 | 3.29 | 3.64 | 96.77 |
| AL Marhoun (1988) | 1.78 | 3.00 | 3.32 | 96.41 |
| Khazam (1995) | -0.12 | 2.26 | 3.27 | 97.74 |
| New Correlation | -0.10 | 2.23 | 3.22 | 97.86 |
Table 2: Comparison between the new correlation and industry published correlations.

Figure 1: Incremental impact of the variable to the B0 Model.

Figure 2: Achieved R squared value of the Bo model.

Figure 3: Comparison between new correlation and published correlations for Bo.
Bubble Point Pressure Correlation
Different approach has been followed in which the number of independent variables were reduced to two,  and
and making use of curve fitting tool to perform non-linear regression, the following correlation was obtained:
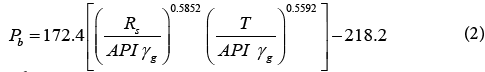
Where,
Pb=Bubble point pressure or saturation pressure (psia)
γg=Average specific gravity of total surface gases from flash separation (air=1)
Rs=Gas solubility (scf/stb)
T=System temperature, (°F)
API=Stock-tank oil gravity from flash separation (°API)
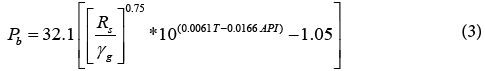
Table 3 below describes the statistical indicators of different industry published Pb correlations with our new formulated Pb correlation for Libyan crudes. The newly constructed correlation does not achieve the aimed statistical results. It slightly falls behind the Khazam correlation in terms of (AARE and SD), but it has better R2 prediction over all former published correlations. Khazam [9] correlation, developed in 1995 for Libyan crudes with less data points used in our study, has the same form of Standing [1] correlation with different empirical parameters that adjusted to better fit the Libyan crudes data and it has the following form:
| Correlation | ARE, % | AARE, % | SD, % | R^2, % |
|---|---|---|---|---|
| Standing (1947) | 6.55 | 14.23 | 17.27 | 92.90 |
| Lasater (1958) | 8.91 | 15.41 | 17.46 | 92.90 |
| Vazquez & Beggs (1980) | -2.86 | 14.16 | 17.93 | 92.90 |
| Glaso (1980) | 3.67 | 18.09 | 23.17 | 92.60 |
| AL Marhoun (1988) | 11.61 | 18.17 | 18.71 | 88.70 |
| Khazam (1995) | 3.16 | 12.94 | 16.66 | 93.70 |
| New correlation | -1.36 | 13.31 | 21.02 | 95.90 |
Table 3: Statistical analyses of Pb correlations.
Figure 4 shows a comparison between the Pb calculated with the new correlation and the measured Pb data. Standard deviation was determined to be about 21%, average relative error equal to -1.36%, and the average absolute relative error determined to be about 13.3%. No indications of abnormal or odd residual values that might be considered as large residuals, where the residual is the difference between the measured value and the predicted value of the Pb. The tested data for our new correlation are all laying within the trend of measured data. Figure 5 shows the cross plot of the new correlation and how the points are within a close fit of the measured Pb for our new correlation. Figure 6 below provides a better understanding of the reliability of the industry Pb published correlations using 45 line graphs.

Figure 4: Residual plot for the new Pb correlation.

Figure 5: Cross plot for the new Pb correlation.

Figure 6: Comparison between published correlations for Pb.
As one can see that Khazam [9] correlation is within a close fit of the measured Pb, since was developed for the same Libyan crude data, and is quite comparable with the new proposed form, and both of them have relatively better performance than other published correlations when tested for Libyan crudes.
Gas solubility correlation
The conventional approach was followed, which is to solve the saturation pressure correlation for Rs, which gives the following correlation:
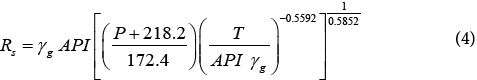
Where “P” is defined as system pressure at saturation condition (psia). Table 4 below describes the statistical indicators of different industry published Rs correlations with our new formulated Rs correlation for Libyan crudes. Figure 7 shows the cross plot of the new correlation and how the points are within a close fit of the measured Rs for our new correlation, especially at higher solution GOR values, volatile type of oils. Standard deviation was determined to be about 24%, average relative error equal to -1.45%, and the average absolute relative error determined to be about 16.8%. The tested data for our new correlation are all laying within the trend of measured data.
| Correlations | ARE, % | AARE, % | SD, % | R^2, % |
|---|---|---|---|---|
| Standing (1947) | -11.86 | 19.50 | 23.94 | 90.90 |
| Lasater (1958) | -29.00 | 32.39 | 32.41 | 73.60 |
| Vazquez & Beggs (1980) | 17.73 | 22.78 | 19.42 | 76.80 |
| Glaso (1980) | -8.42 | 21.04 | 27.74 | 89.80 |
| AL Marhoun (1988) | -26.94 | 34.52 | 39.65 | 65.60 |
| Khazam (1995) | -7.41 | 17.91 | 22.90 | 88.90 |
| New correlation | -1.45 | 16.84 | 24.09 | 91.00 |
Table 4: Statistical analyses of Rs correlations.

Figure 7: Cross plot for the new Rs correlation.
Dead Oil Viscosity Correlation
Many models for dead oil viscosity correlation have been tried and tested based on the temperature and API as correlating parameters, but we were unable to reach the aimed statistical results. Howevre, when we have integrated Khazam [9] molecular weight correlation instead of the API gravity, as correlating parameter, we have achieved better model results. The dead oil viscosity correlation was derived based on 274 data point samples and has the following final form:
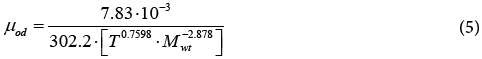
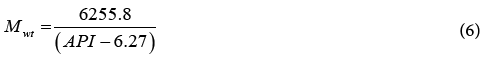
where,
μod=Dead oil viscosity (cP)
Mwt=Calculated stock-tank molecular weight (lb/gmol)
T=System temperature, (°F)
Table 5 below describes the statistical indicators of different industry published μod correlations with our new formulated μod correlation for Libyan crudes. Figure 8 below provides a better understanding of the reliability of the proposed new μod correlation in comparison to the industry published correlations using 45 line graphs. As one can see, it is quite difficult to obtain a close fit to the measured μod data, since one main reason behind this is the challenges and levels of viscosity uncertainty measurements between different industry labs. SD for our new correlation was determined to be about 26%, ARE equals to -4.13%, the AARE determined to be about 21%, and the R2 value is 71%. The tested data for our new correlation are all laying within the trend of measured data and no indications of abnormal or odd values predictions. Labedi [13] correlation has also reliable predictions since was developed for similar crudes, but our correlation tends to have much better predictions at higher viscosity measured values. Other published industry correlations are obviously deviated from the measured Libyan data with noticeable scattered abnormal trends.
| Correlation | ARE, % | AARE, % | SD, % | R^2, % |
|---|---|---|---|---|
| Beal’s (1946) | 41.81 | 42.53 | 21.79 | -12.60 |
| Beggs-Robinson (1975) | 13.89 | 26.08 | 29.07 | 38.80 |
| Glaso (1980) | 36.77 | 37.11 | 16.88 | 5.40 |
| Labedi (1992) | 4.17 | 22.96 | 28.34 | 66.90 |
| Kartoatmodjo-Schmidt (1994) | 43.75 | 43.90 | 17.17 | -13.00 |
| Petrosky-Farshad (1995) | 28.91 | 29.97 | 18.04 | 24.30 |
| New correlation | -4.13 | 21.00 | 25.99 | 71.10 |
Table 5: Statistical analyses of µod correlations

Figure 8: Comparison between new and published correlations for µod .
Saturated Oil Viscosity Correlation
The best model that was found to be more accurate was built on the basis that the saturated viscosity is function of (API, Rs and μod). The final obtained form of saturated viscosity correlation is:
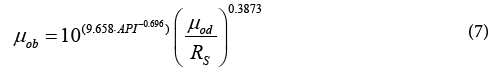
where,
μob=Oil viscosity at bubble-point pressure (cP)
Rs=Gas solubility (scf/stb).
μod=Dead oil viscosity (cP).
API=Oil API gravity (°API)
Table 6 describes the statistical indicators of different industry published μob correlations with our new formulated μob correlation for Libyan crudes. As noticed from Table 6, our new correlation has better accuracy indicators compared to the other industry correlations, with R2 of 85%. Figure 9 shows the comparison between the μob calculated with the new correlation and the measured μob data. The tested data for our new correlation are all lying within the trend of measured data and no indications of abnormal or odd values predictions.
| Correlation | ARE, % | AARE, % | SD, % | R^2, % |
|---|---|---|---|---|
| Chew-Connally (1959) | -24.82 | 41.73 | 56.61 | -9.40 |
| Beggs-Robinson (1975) | -1.17 | 31.22 | 44.23 | 79.20 |
| Labedi (1992) | 10.91 | 31.00 | 39.37 | 67.40 |
| Kartoatmodjo-Schmidt (1994) | -26.96 | 41.78 | 55.28 | 55.20 |
| Petrosky-Farshad (1995) | -89.00 | 92.09 | 125.21 | 19.70 |
| New correlation | -12.31 | 30.02 | 45.18 | 85.30 |
Table 6: Statistical analyses of µob correlations.

Figure 9: Cross plot for the new µob correlation.
Under-saturated Oil Viscosity Correlation
At pressures above the bubble point, the viscosity variation has almost linear relationship with the pressure. Based on several modelling attempts, the final best correlation model we have achieved has the following form:

where
μob=Viscosity of oil at saturation pressure, (cP)
μod=Dead oil viscosity (cP)
API=Oil API gravity, (°API)
ΔP=pressure difference above the bubble point pressure, (psi)
It is quite clear that the accuracy predictions of under-saturated oil viscosity is directly linked to the accuracy prediction of saturated oil viscosity. The pressure difference (ΔP) in our correlation is referenced to Pb pressure and in case DP is zero, our correlation will converge to the prediction of μob. This new correlation has achieved higher accuracy performance with R2 of 98.8%, SD of 9.64% and AARE of 5.9%.
Isothermal Oil Compressibility Correlation
Isothermal compressibility is used in a wide range of production and reservoir engineering calculations. Some of the reservoir engineering applications for the isothermal compressibility include well testing analysis and material balance calculation for under saturated oil reservoirs. Several correlations [1,3,7,14,15] to calculate oil compressibility have been published and widely used in the oil industry. We have introduced a simple Co correlation with reliable degree of accuracy and it is mainly function of the saturated oil formation volume factor (Bob). The new correlation has the following form:

where,
Co=Oil compressibility, (psi-1)
Bob=FVF at bubble point pressure, (rbbl/stb)
ΔP=pressure difference above bubble point pressure (psi)
It should be pointed out that Bob which is used in the above equation can be the measured value or the predicted value from the empirical FVF correlations. Figure 10 shows the comparison between the measured and predicted Co with acceptable fit to the measured data. Table 7 below summarises the statistical comparisons with other industry published correlations.

Figure 10: Cross plot for the new Co correlation.
| Correlation | ARE, % | AARE, % | SD, % | R^2, % |
|---|---|---|---|---|
| Standing (1947) | 14.28 | 19.15 | 19.15 | 52.90 |
| Vazquez-Beggs (1980) | 12.48 | 28.56 | 34.98 | 18.60 |
| Labedi (1990) | 20.92 | 21.97 | 15.66 | 48.40 |
| Petrosky-Farshad (1995) | 18.80 | 22.38 | 22.66 | 53.90 |
| AL Marhoun (2003) | 6.90 | 18.53 | 21.33 | 57.90 |
| New correlation | -3.49 | 16.46 | 19.06 | 77.60 |
Table 7: Statistical analysis of oil compressibility correlations.
Artificial Neural Network Model
This new computing technique can be defined as massively and highly parallel distributed information processing system that has the ability for recognizing nonlinear relationships within the available data. Neural network resembles the human brain in its function where knowledge is acquired through a learning process; and interneuron connection strengths known as weights are used to store the knowledge The data bank is divided into groups as shown Figure 11, where the learning data are divided into three subsets which are used for training, validation and testing.

Figure 11: Data division diagram for Artificial Neural Networks models.
Development of PVT Neural Network Models
Developed model refers to correlations that predict PVT properties from available field measured variables include oil API gravity, gas gravity, reservoir temperature, viscosity, solution gas oil ratio, bubble point pressure and reservoir pressure, using MATLAB Artificial Intelligent Package (Neural Network Toolbox), a model for each property has been developed to reach a target of best representation of the Libyan crudes. Table 8 and Figure 12 summarize the statistics of ANN’s in comparison with the new developed PVT correlations. As it can be noticed from the below graphs, as well as the statistical indicators, the ANN’s models are slightly better than the new developed empirical PVT correlations. ANN was developed for each correlated PVT property with different numbers of hidden layers. The hidden layers were increased to 3 in the case of oil viscosity and oil compressibility predictions, due to variation in data ranges, which makes the presence of 3 hidden layers better for the accuracy of the models predictions.

Figure 12: Comparison between ANN’s and new developed empirical PVT correlations.
| PVT Property | # of hidden layers | # of data used for Training | # of data used for verification | R^2, % | SD, % | ARE, % | AARE, % |
|---|---|---|---|---|---|---|---|
| Bob | 2 | 284 | 50 | 98.0 | 3.12 | -0.21 | 2.22 |
| Pb | 2 | 260 | 46 | 97.0 | 19.90 | -2.45 | 11.57 |
| Rs | 2 | 260 | 46 | 92.0 | 37.40 | -0.99 | 20.23 |
| µod | 3 | 233 | 41 | 76.6 | 25.80 | -6.07 | 19.39 |
| µob | 3 | 104 | 18 | 87.0 | 29.70 | -37.18 | 74.98 |
| µo | 1 | 276 | 40 | 99.8 | 6.78 | 0.05 | 4.10 |
| Co | 3 | 321 | 57 | 84.0 | 17.80 | -4.40 | 14.33 |
Table 8: Number of data used to develop the ANN AND Statistical Results.
Conclusions
1. New empirical PVT correlations have been developed for Libyan crudes with reliable degree of accuracy. These include; bubble point pressure (Pb), oil formation volume factor (Bo), gas solubility (Rs), stock tank oil molecular weight (Mwt), dead oil viscosity (μod), saturated oil viscosity (μob), under-saturated oil viscosity (μo), and oil compressibility (Co).
2. Around 300 PVT data point samples from Sirte, Muruzq, Ghadamis, and offshore basins were collected, screened and utilized for our study. These covered wide range of crude oils gravity ranges between (26 to 51°API) and reservoir temperature (100 to 313°F) normally found in Libyan reservoirs.
3. Minitab regression tool was extensively used in our study to develop the PVT correlations and to statistically appraise them against the industry published correlations. The new proposed PVT correlations have demonstrated better performance compared to the industry published correlations tested for Libyan crudes.
4. Artificial Neural Network (ANN) models have been developed for Libyan PVT properties predictions. The models show acceptable accuracy and are marginally accurate than the proposed empirical correlations.
Acknowledgment
We highly appreciate and thank the Libyan Petroleum Institute for providing us with the PVT data. Also, we would like to thank the members of Petroleum Engineering Department at the University of Tripoli for their academic support.
References
- Standing MB (1947) A Pressure-Volume-Temperature Correlation for Mixtures of California Oil and Gases. Drill & Prod Prac API pp: 275-287.
- Lasater JA (1958) Bubble-Point Pressure Correlation. Trans AIME, 213: 379-381.
- Vasquez ME, Beggs HD (1980) Correlations for Fluid Physical Property Prediction JPT, pp: 968-970.
- Glaso O (1980) Generalized Pressure-Volume-Temperature Correlations. Journal of Petroleum Technology, pp: 785–795.
- Al-Marhoun MA (1988) PVT Correlations for Middle East Crude Oils JPT, pp: 650-666.
- Petrosky GEJ (1990) PVT Correlations for Gulf of Mexico Crude Oils. MSC Thesis University of Southwestern Louisiana, Lafayette Louisiana USA.
- Labedi RM (1990) Use of Production Data to Estimate the Saturation Pressure Solution GOR and Chemical Composition of Reservoir Fluids Presented at the SPE Latin America Petroleum. Engineering Conference Rio de Janeiro Brazil, pp: 14-19.
- Kartoatmodjo F, Schmidt Z (1994) Large Data Bank Improves Crude Physical Property Correlations. Oil and Gas Journal 4: 51-55.
- Khazam MM (1995) Statistical Evaluation and Optimization of PVT Correlations for Libyan Crudes, National Oil Corporation Tripoli Libya.
- Beal C (1946) Viscosity of air water natural gas Crude Oil and its associated gases at Oil Field Temperature and Pressures. Petroleum Transactions, pp: 94-112.
- Beggs HD, Robinson J R (1975) Estimating the Viscosity of Crude Oil Systems. pp: 1140-1141.
- Chew J, Connally CA (1959) A Viscosity Correlation for Gas-Saturated Crude Oils. Trans AIME 216: 23-25.
- Labedi RM (1992) Improved Correlations for Predicting the Viscosity of Light Crudes. Journal of Petroleum Science Engineering, 8: 221-234.
- Petrosky GE, Farshad FF (1995) Viscosity Correlations for Gulf of Mexico Crude Oils, paper SPE 29468 Production Operations Symposium Oklahoma.
- Al-Marhoun MA (2003) The Coefficient of Isothermal Compressibility of Black Oils, Paper SPE 81432 presented at the SPE Middle East Oil, pp: 9-12.
Relevant Topics
Recommended Journals
- Oil & Gas Research Journal
- Renewable Energy and Applications Journal
- Oceanography Journal
- Industrial Pollution Control Journal
- Coastal Zone Management Journal
- Climatology & Weather Forecasting Journal
- Geoinformatics & Geostatistics Journal
- Engineering and Technology Journal
- Petroleum & Environmental Biotechnology Journal
- Polymer Sciences Journal
Article Tools
Article Usage
- Total views: 5876
- [From(publication date):
December-2016 - Jan 04, 2025] - Breakdown by view type
- HTML page views : 4810
- PDF downloads : 1066