Research Article Open Access
Neck CTA with Deformable Registration and Subtraction Method: Evaluation in Patients with Stents
| Masahiro Higashi1*, Suzu Kanzaki1, Yoshitaka Onishi1, Mutsumi Adachi1, Naomi Morita1, Yoshiaki Morita1, Tetsuya Fukuda1, Naoaki Yamada1, Tetsu Satow2 and Hiroaki Naito1 | |
| 1Department of Radiology, National Cerebral and Cardiovascular Center, Japan | |
| 2Department of Neurosurgery, National Cerebral and Cardiovascular Center, Japan | |
| Corresponding Author : | Masahiro Higashi Chief of CT Division, Department of Radiology National Cerebral and Cardiovascular Center, Japan Tel: 81668335012 E-mail: xhigashi@ncvc.go.jp |
| Received August 08, 2014; Accepted September 11, 2014; Published September 18, 2014 | |
| Citation: Higashi M, Kanzaki S, Onishi Y, Adachi M, Morita N, et al. (2014) Neck CTA with Deformable Registration and Subtraction Method: Evaluation in Patients with Stents. OMICS J Radiol 3:169. doi:10.4172/2167-7964.1000169 | |
| Copyright: © 2014 Higashi M, et al. This is an open-access article distributed under the terms of the Creative Commons Attribution License, which permits unrestricted use, distribution, and reproduction in any medium, provided the original author and source are credited. | |
Visit for more related articles at Journal of Radiology
Abstract
Background and purpose: The evaluation of arterial lumen with severe calcification or stent is still challenging. The purpose of the present study was to assess the effectiveness of the new subtraction method for CTA in patients with carotid artery stents.
Materials and methods: A total of 35 consecutive neck CTA examinations in patients who had undergone carotid artery stent placement were selected for inclusion in this retrospective study. The CT scanner used was a 320-row MDCT system. The new subtraction method (global non-rigid registration and local rigid refinement subtraction) was used to obtain subtraction images. Two observers visually assessed the subtraction effect for the stents and for bone near the vertebral arteries using a 4-grade scale in order to compare the new subtraction method against the conventional subtraction method and DSA.
Results: The arterial lumen could be evaluated in 89% of the stent subtraction images and 100% of the bone subtraction images obtained using the new subtraction method, and the subtraction images were judged to be superior to those obtained using the conventional method. The stenosis ratios showed a high correlation with those obtained by DSA (r = 0.92).
Conclusion: The new subtraction method is effective in eliminating stents and bones and is also useful for assessing the arterial lumen after stent placement.
| Keywords |
| CTA; subtraction; carotid artery; stent |
| Introduction |
| One of the most common causes of cerebral infarction is carotid artery stenosis. Previous prospective multicenter studies have demonstrated the superiority of surgery in patients with symptomatic severe stenosis, and carotid artery endarterectomy is commonly performed [1-3]. However, endovascular treatment with stent placement is employed in patients who are judged to be poor candidates for surgery, such as patients who have received radiotherapy, patients who have developed restenosis after endarterectomy, and patients in whom surgical access to the target region is difficult [4]. Ultrasound, CT, and MRI are commonly used to evaluate the carotid arteries as less invasive evaluation methods. Although CT requires the administration of contrast medium and involves radiation exposure, it is very useful for acquiring volume data in a short time [5,6]. As a three-dimensional display method in CT, there are multiplanar reconstruction (MPR), curved MPR (CPR), Maximum Intensity Projection (MIP), Shaded Surface Display (SSD), Volume Rendering (VR) and a virtual endoscopy. MIP can display vessel lumen similar to angiography, and it is useful for determining the degree of the stenosis of arteries [7]. |
| Despite the clinical usefulness of MIP, the artifacts generated by calcification or stents may interfere with diagnosis in some patients. For such patients, imaging methods have been developed for depicting only the arterial lumen, with the calcification and stents eliminated by performing subtraction between contrast and non-contrast CT images [8-10]. However, standard subtraction methods may fail to provide useful diagnostic information due to positional shift between the noncontrast and contrast CT images [9]. The present study was conducted to evaluate the effectiveness of a new subtraction method known as “global non-rigid registration and local rigid refinement subtraction (NR-sub)” for eliminating stents and bones in CTA of the carotid arteries. Assessment was based on the following: a) comparison of the NR-sub method against the conventional subtraction (C-sub) method and the rigid registration subtraction (R-sub) method in terms of the subtraction effect, b) investigation of the degree of correlation between the stenosis ratios determined by the NR-sub method and by DSA. |
| Subjects and Methods |
| The subjects were patients with carotid artery stents who underwent CTA of the carotid arteries using a 320-row MDCT system at our hospital between June 2010 to August 2011. We retrospectively evaluated 41 consecutive CTA examinations performed for the patients described above, and a total of 35 CTA examinations were selected for inclusion in the present study after excluding 3 examinations in which no volume data for non-contrast CT was available, 2 examinations in which subtraction was not possible because scanning was performed with the gantry tilted, and 1 examination in which the backflow of contrast medium into the jugular vein was severe. One patient underwent twice CTA examinations. One patient was implanted a stent in both carotid arteries. In total, 36 carotid arteries and 35 paired vertebral arteries of 35 CTA examinations in 34 subjects (33 men and one woman with an average age of 72 years) were selected for inclusion in this study. This study was approved by the institutional review board, and a waiver of consent was obtained for retrospective study. |
| CTA Protocol |
| The CT scanner used was a 320-row MDCT system (Aquilion ONE, Toshiba Medical Systems Corporation, Japan). Both non-contrast and contrast CT scanning were performed focusing on the bifurcation of the carotid artery, with scans performed in non-helical scan mode. The scan parameters employed were a tube voltage of 120 kVp, a tube current of 200 mA, a tube rotation speed of 0.75 s, a reconstruction slice thickness of 0.5 mm, a slice interval of 0.5 mm, an FOV of 120 mm, and reconstruction function FC 23. For the width in the Z-axis direction, 10 cm (200 rows) was generally set, but 12 cm, 14 cm, or 16 cm was also set in some subjects. The CTDIvol is 26.2 mGy and the Dose-length product (DLP) is 547 mGy.cm for both non-contrast and contrast-enhanced CT scans, with an estimated effective dose of 3.4 mSv. |
| High-concentration contrast medium (350 mgI/mL) was administered at a dosage of 1 mL per kg body weight. The contrast medium was injected over 20 s via an antecubital vein using an automatic injector, followed by a 25-mL saline flush injected at the same rate. Monitoring for the arrival of contrast medium in the left and right common carotid arteries was started at 18 s after the start of injection. When the CT number reached a threshold of 160 HU, the patient was instructed to hold his or her breath and CTA was performed. |
| Image Processing and Analysis |
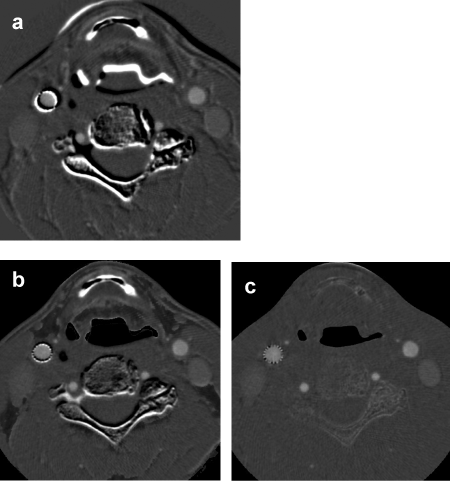
| Subtraction images were generated from the acquired non-contrast and contrast CT images using the new subtraction method (NR-sub: SURESubtractionTM, Toshiba Medical Systems Corporation, Japan). In this subtraction method, non-rigid registration of the entire volume is performed automatically, after which additional regional rigid registration can be performed in selected areas if required [11]. In the present study, automatic non-rigid registration was performed for the entire volume, followed by one additional regional rigid registration procedure for each stent. The conventional subtraction (C-sub) and rigid registration subtraction (R-sub) functions (head subtraction functions, Toshiba Medical Systems Corporation, Japan) provided in the CT system were also used to generate corresponding subtraction images (Figure 1). These three types of subtraction images were then transferred to a workstation (ziostation 2, Ziosoft, Japan) to generate MIP images (Figure 2). Two evaluators (MH and SK) independently assessed the subtraction effect using these MIP images. In the event of disagreement between the two evaluators, the final assessment result was reached by mutual discussion and consensus. |
| Stent subtraction scores and bone subtraction scores |
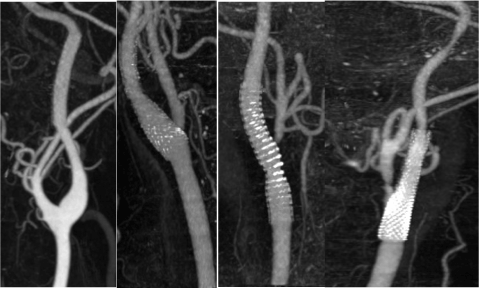
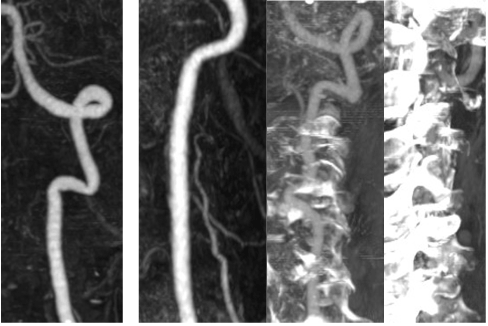
| The stent and bone subtraction effects were evaluated using a 4-grade scale as follows: 1=excellent (the stent and bone near the vertebral arteries are completely or almost completely eliminated), 2=good (the stent or bone near the vertebral arteries is still slightly visible), 3=fair (the stent or bone near vertebral arteries is quite noticeable, but stenosis in the lumen can be assessed), and 4=poor (the stent or bone near the vertebral arteries remains largely visible and stenosis in the lumen cannot be assessed) (Figures 3 and 4). |
| Evaluation Items |
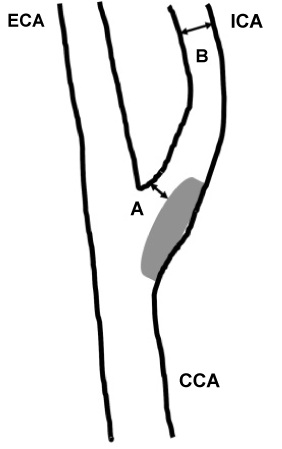
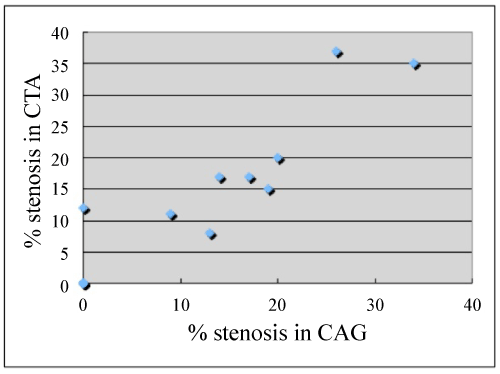
| The stent and bone subtraction scores were calculated for the NRsub, C-sub, and R-sub methods, and statistical analysis was performed to evaluate the differences in subtraction scores between these three subtraction methods. In 15 patients, CTA images acquired within 2 weeks after carotid artery stenting (CAS) were compared against X-ray angiography images. The most recent X-ray angiographic image acquired after CAS and an NR-sub MIP image with the same imaging direction as the angiographic image were used to calculate the stenosis ratio at the stent placement site using the NASCET method (percent stenosis was determined by calculating the ratio of two diameter, at the point of greatest stenosis/at the normal part of the artery beyond the carotid bulb) [1] (Figure 5), and the stenosis ratios obtained by the two methods were compared. |
| Statistical Analysis |
| With regard to the stent and bone subtraction scores, the kappa test was used to assess the degree of concordance between the two evaluators (κ>0.8: excellent, κ=0.6–0.8: good, κ=0.4–0.6: moderate, κ=0.2–0.4: fair, κ<0.2: poor). The distributions of the stent subtraction scores and bone subtraction scores in the NR-sub method, the average values of the scores for the three subtraction methods, and their standard deviations were calculated. The differences between the subtraction methods were statistically analyzed using the Friedman test and Dunn’s multiple comparison tests. For the correlation between the stenosis ratios determined using X-ray angiography and CTA, the Spearman’s concordance correlation coefficient was calculated. The level of significance was 0.05. The kappa test was calculated using inhouse written software. The other statistical analyses were calculated using a statistics software package (Prism 5, GraphPad Software, San Diego, California). |
| Results |
| The agreement rates between the evaluators were κ=0.74 for the stent subtraction score and κ=0.86 for the bone subtraction score, showing good and excellent agreement. With regard to the stent subtraction score, 22 cases (61%) were judged “good” or better and 32 cases (89%) were judged “fair” or better. The average score was 2.42 ± 0.81. With regard to the bone subtraction score, 35 cases (100%) were judged “good” or better. The average score was 1.29 ± 0.46. |
| In comparison with the C-sub and R-sub methods, the NRsub method was significantly superior with regard to both the stent subtraction score and the bone subtraction score (Table 1). The coefficient of the Spearman’s concordance correlation between the stenosis ratios determined using DSA and using NR-sub CTA was r=0.92 (Figure 6). |
| Discussion |
| Benefiting to recent advances in MDCT systems, extremely accurate CTA images of the arteries in all parts of the body can now be obtained. As a three-dimensional display method in CT, there are Multiplanar Reconstruction (MPR), curved MPR (CPR), Maximum Intensity Projection (MIP), Shaded Surface Display (SSD), Volume Rendering (VR) and a virtual endoscopy. Three-dimensional reconstructions are able to display complex arterial anatomy and the findings in a single view. MIP is a technique for projection at maximum signal value of the voxel line. MIP can display vessel lumen similar to angiography, and it is useful for determining the degree of the stenosis of arteries [7]. However, the volume rendering and MIP methods are unsuitable for visualizing arteries in regions surrounded by bones, such as the skull base, or arteries containing calcification or stents. It is therefore necessary to assess these arteries using the original images or multiplanar reconstruction (MPR) and curved planar reconstruction (CPR) images. For assessment using MPR images, images obtained from multiple directions are required, and for CPR images, the lumen must be accurately traced [5,6]. |
| For the assessment of arteries in regions surrounded by bones or arteries containing calcification or stents, methods in which a noncontrast CT image is subtracted from a contract CT image have been developed. The MIP method employing subtraction can provide images that are similar to those obtained by X-ray angiography, making it easier to objectively assess the degree of stenosis [9]. With regard to CTA of the head and neck, there have been many reports focusing on the assessment of calcified plaque subtraction images and bone subtraction images [8-10], but there have been few reports on the effectiveness of stent subtraction. The main reasons that it is difficult to perform stent subtraction are the strong pulsation of the carotid arteries (although not as strong as the heart), the difficulty in minimizing movement of the target region, and the generation of severe artifacts due to the strut thickness of the stents placed in the arteries. |
| The new subtraction method described in the present study permits additional regional position matching to be performed after automatic position matching of the entire volume [11]. In this study, after the registration in the entire volume, only re-registration of once was done for each stent. We did not instruct additional modifications for the bone. Therefore, the subtraction effect for the bone is the result of this subtraction method to the entire volume to be performed automatically. |
| In 320-MDCT, scanning in the volume mode to cover a wide range of Z-axis direction is possible. Width of the Z-axis direction, an operator can choose from among 6 cm, 8 cm, 10 cm, 12 cm, 14 cm and 16 cm. Because the data can be collected in one rotation in these ranges, there is no deviation in the time within the volume data. There is a possibility to improve the effect of subtraction, because 320-MDCT can collect the data in one rotation. We also compared the new subtraction method against the DSA method with regard to measurement of the stenosis ratio. The patients in the present study included many in whom the stenosis was relieved, which may have been the reason for the high correlation observed. Further studies involving a larger number of subjects with stenosis should be conducted to investigate this issue. |
| Conclusions |
| The new subtraction method for CTA is effective in eliminating stents and bones and is also useful for evaluating the arterial lumen after stent placement. |
| Acknowledgements |
| We thank Kanae Takahashi and Toshimitsu Hamasaki for statistically advice. This study is a joint research with Toshiba Medical Systems. Masahiro Higashi received a research grant from Toshiba Medical Systems. |
References |
|
Tables and Figures at a glance
| Table 1 |
Figures at a glance
 |
 |
 |
| Figure 1 | Figure 2 | Figure 3 |
 |
 |
 |
| Figure 4 | Figure 5 | Figure 6 |
Relevant Topics
- Abdominal Radiology
- AI in Radiology
- Breast Imaging
- Cardiovascular Radiology
- Chest Radiology
- Clinical Radiology
- CT Imaging
- Diagnostic Radiology
- Emergency Radiology
- Fluoroscopy Radiology
- General Radiology
- Genitourinary Radiology
- Interventional Radiology Techniques
- Mammography
- Minimal Invasive surgery
- Musculoskeletal Radiology
- Neuroradiology
- Neuroradiology Advances
- Oral and Maxillofacial Radiology
- Radiography
- Radiology Imaging
- Surgical Radiology
- Tele Radiology
- Therapeutic Radiology
Recommended Journals
Article Tools
Article Usage
- Total views: 16722
- [From(publication date):
December-2014 - Jul 14, 2025] - Breakdown by view type
- HTML page views : 12189
- PDF downloads : 4533
