Morphodynamic of Marudu Bay during North East Monsoon (NEM)
Received: 25-Mar-2019 / Accepted Date: 30-Apr-2019 / Published Date: 08-May-2019
Abstract
Marudu Bay is the largest bay in Malaysia where the opening of the bay mouth is about 34 km in width, and the bay territorial water area is estimated to be around 900 km2 while the digitized shoreline length measured about 246 km. The bay experiences mixed tidal forces from two (2) seas i.e. the South China Sea on the western region and the Sulu Sea on the eastern side. The geo-morphological features inside the bay is dynamically formed where sandy beaches dominated the foreshore of the bay mouth and muddy shores with escalating mangroves colonies the inner part of the bay. The dominant hydrodynamic forces acting on Marudu Bay is Northeast Monsoon (NEM) where it carries most rain from November until March every year. During Southwest monsoon, it carries drier air that flown through the bay. In this study primary physical marine data was collected inside Marudu Bay in order to understand the hydrodynamic condition inside the bay during NEM period. Since this measurement is the first primary record of physical parameters monitoring effort inside Marudu Bay to date, this finding will astonishingly become an important reference in understanding the dynamic of physical forces in relation with the ecosystem functions and the prominent role of the bay towards the socio – economic stability shared by the three (3) district around the bay, i.e. Kota Marudu, Kudat and Pitas.
Keywords: Marudu bay; Physical parameters; Hydrodynamic; Ecosystem; Wave; Current; Tide
Study Area
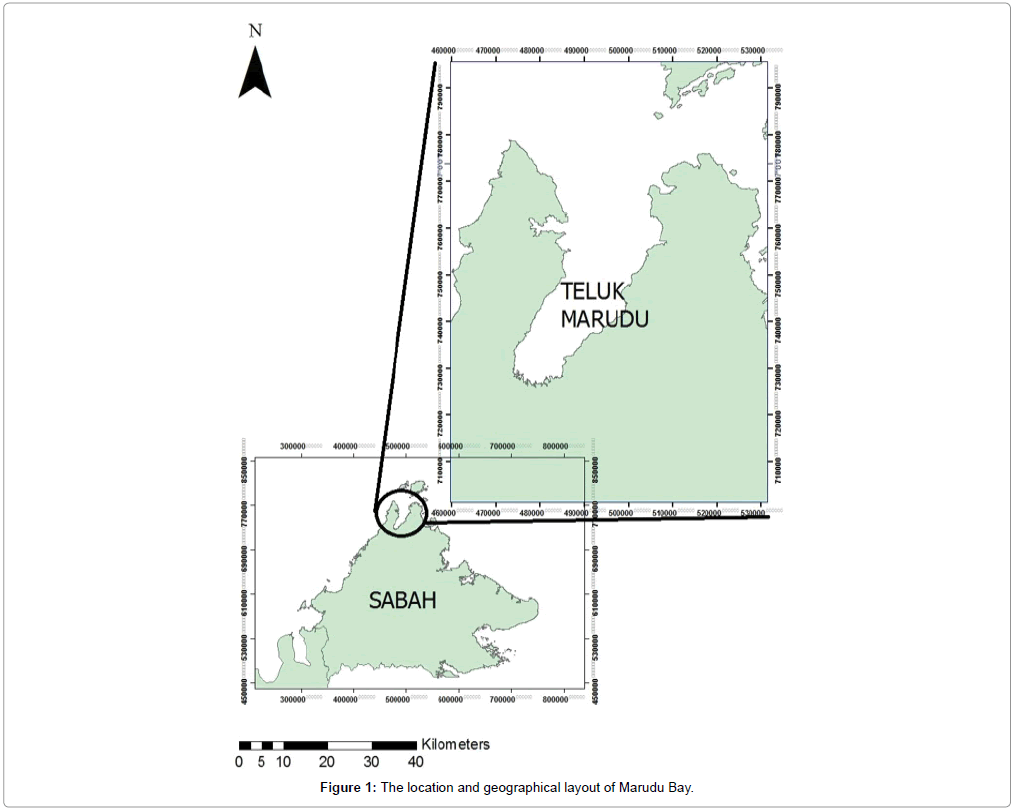
The study area covers Marudu Bay and Kudat Bay vicinity. An approximately 8 rivers flow into the Marudu Bay while 4 rivers flow into Kudat Bay. The largest and longest river system is Telaga River located at the north-easterly of the bay mouth. Meanwhile, in the inner part of the bay, Bandau River is the longest river, a tributary of water flowing from Mount Kinabalu. The uniqueness of Marudu Bay lies on its biodiversity wealth shared by three (3) districts; Kudat (West), Kota Marudu (South) and Pitas (East). The beach face and facies of Marudu Bay is also uniquely formed where they can be experienced while cruising from the inner part of the bay located at Kota Marudu district moving towards the bay mouth either to the Tip of Borneo (Kudat district) on the left edge and Malubang/Supirak beach (Pitas district) on the right edge. The Tip of Borneo is very popular tourist destination for it beautifully carved wave – cut platform metamorphic rocks formation type of coastal landform. Meanwhile, on the right edge of the bay, white crystallite sandy beaches with perfect sunset panorama can be experienced at Supirak Cursed Ship rocky island and Malubang Bay beaches. The residential area within Marudu Bay is concentrated in the vicinity of Kudat, Kota Marudu and Pitas urban area whereas isolated small scale villages are located along the coastal road connecting this three districts. From socio – economic point of view, the people who live along the bay coast have actively harvested the richness of the bay for generation from fisheries and aquaculture activities. Hence, this study is necessary to understand the relationship between physical and biological elements to better understanding the hydrodynamic condition of Marudu Bay. Figure 1 indicates the geographical location and layout of Marudu Bay.
Literature Review
From the literature review, there are very little information about Marudu Bay that is related to historical record of physical marine data and hydrodynamic modelling works. Fleming et al. [1] explained about the morphological landscape of Marudu Bay and emphasized on the integration of physical, biological and chemical processes as a requirement for holistic impact assessment. Meanwhile, Tan Kar Soon et al. [2] focused on aquaculture research and potentials of the Marudu Bay. Sabah Forestry Department (SFD) (2012) on the other hand, provided a statistical inventories of mangrove species abundance in the bay and updates the current conditions of the mangroves restoration and planting efforts done in the bay. Gassim et al. [3] and Faridah Hanum et al. [4] described the evolution process of tectonic activities inside the bay of coral reefs and other significant habitats such as nationally rare sea grass beds and extensive mangrove forest with large component of Rhizophora species. A comprehensive physico–chemical parameters of water sample analysis for Marudu Bay were extensively documented by Ahmad Zaharin Aris et al. [5].
Materials And Methods
The selection of site for marine data collection were carefully identified and site visit was carried out to ascertain the study objectives. Equipment used for data collection were tested and carefully calibrated in meeting the accuracy expectation for this study.
Marine data collection
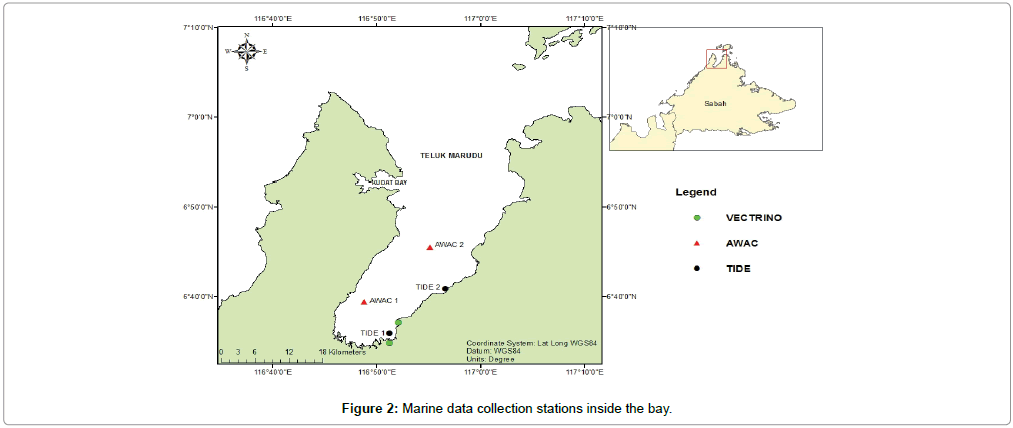
This study primary objective is to provide empirical evidence for physical parameters within the vicinity of Marudu Bay. The data collection period was carried out for two weeks from 10th to 22nd March 2015 to cater one (1) complete tidal cycle consist of 7 days neap and 7 days spring tides. Among the important data collected are water level fluctuation, bathymetry, wave parameter and current properties data. There are two locations for water level measurement and also two locations for wave and current measurements (Figure 2). The selection of site is based on depth profile and also taking into consideration the safety of the equipment. Water level data was recorded by RBRsolo and Schlumberger DIVER device, and bathymetric data was measured by using Hummingbird Echo – Sounder and SEASTAR DGPS. Meanwhile, wave and current data were measured using Acoustic Wave and Current profiler (AWAC) from NORTEK. For the measurement inside the intertidal zone of mangrove forest, VECTRINO were used to cater the rising tides together with ripple waves that protrude into mangrove forest. Figure 3 indicate the location for marine data collection inside the bay.
Hydrodynamic model configuration
The numerical model was simulated using MIKE 21 Flexible Mesh (FM) software and focus given to the localized forces acting towards the bay. The model boundary is 80 km × 90 km in measure where the dominant forces come from the Sulu Sea entering the bay mouth. Water level data to interpolate the bathymetry profile for the model were provided by the water file known as C – Map is available in the model repository where it is being frequently updated by the software developer. Hence, the measured bathymetry was overlayed to produce improved accuracy for the model bathymetry profile in the model. For the shallow water equations, a number of different boundary conditions can be applied. The flux, velocity, discharge and Flather boundary are all imposed using a weak approach. The water level is evaluated based on the value of the adjacent interior cell, and the velocity are evaluated based on the boundary information. The Flather (1976) [6] condition is one of the most efficient open boundary conditions. It is very efficient in connection with downscaling coarse model simulations to local areas [7]. Numerical simulations were performed using both the two – dimensional and the three – dimensional shallow water equations. An unstructured mesh was used containing 18311 triangular elements and 9537 nodes. The minimum edge length is 0.01906 m and the maximum edge length is 0.06125 m. The time step is 0.002 s. At the downstream boundary, a free outfall (absorbing) boundary condition is applied. The wetting depth, flooding depth and drying depth are 0.002 m, 0.001 m and 0.0001 m respectively.
Results
Dissemination of the result of this study was divided into recorded physical data at site and also the hydrodynamic model result and interpretation during NEM period.
Water level data
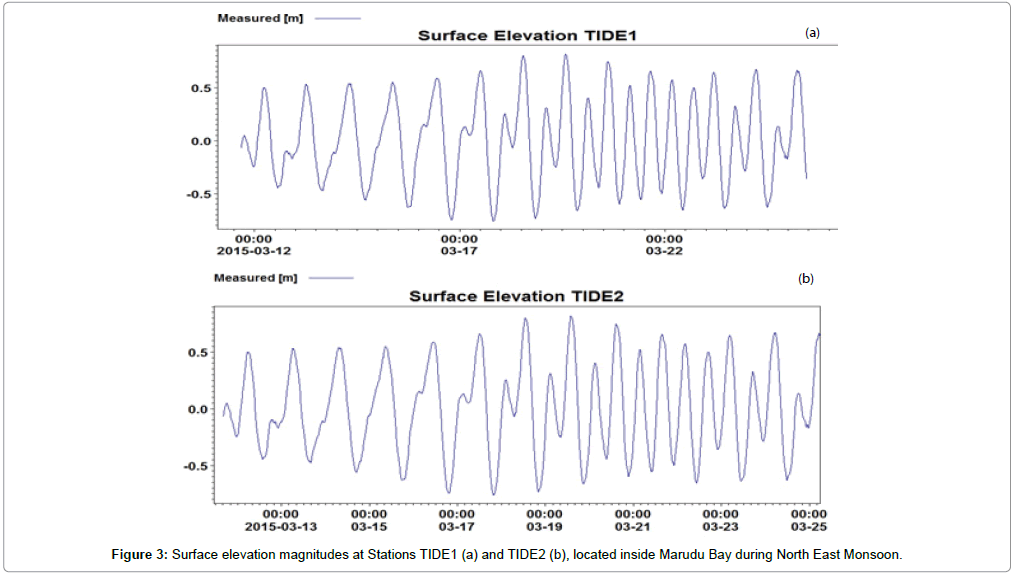
Marudu Bay is experiencing Mixed Tide for daily tidal cycle which have 1 high and 1 low in a day. For the duration of two weeks recording, it indicates the tidal level inside the bay ranges from 1.0 m during neap and 1.6 m during spring tide for both tidal stations deployed at site throughout the data collection period. The water level fluctuation profile for TIDE1 (a) and TIDE2 (b) station (Figure 2) depicted in Figure 3.
Bathymetry data
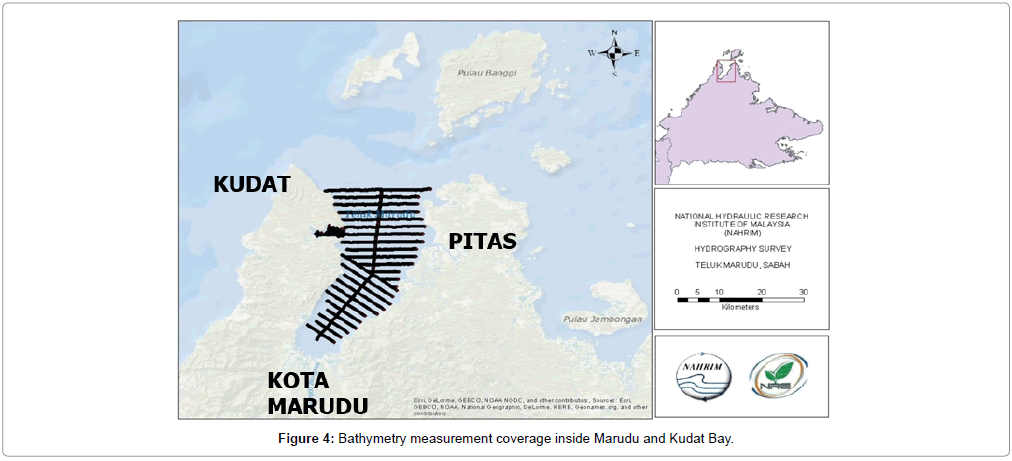
Bathymetry data measurement covered the territorial water inside Marudu Bay and Kudat Bay with the coverage area of approximately 900 km2. From the bathymetric measurement, it was indicated that the bed level profile is deeper at the bay mouth and incline proportionately towards the inner part of the bay where most of the river flow from Kota Marudu district. The deepest depth at the bay mouth is approximately ± 50 m and becomes shallower towards the inner part of the bay. Figure 4 portrayed the bathymetry measurement coverage inside Marudu Bay and b indicates the interpolated depth profile inside the bay.
Wave data
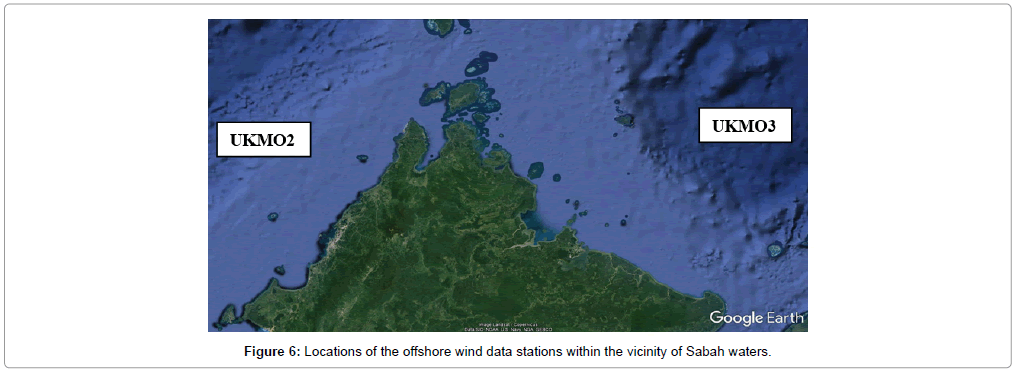
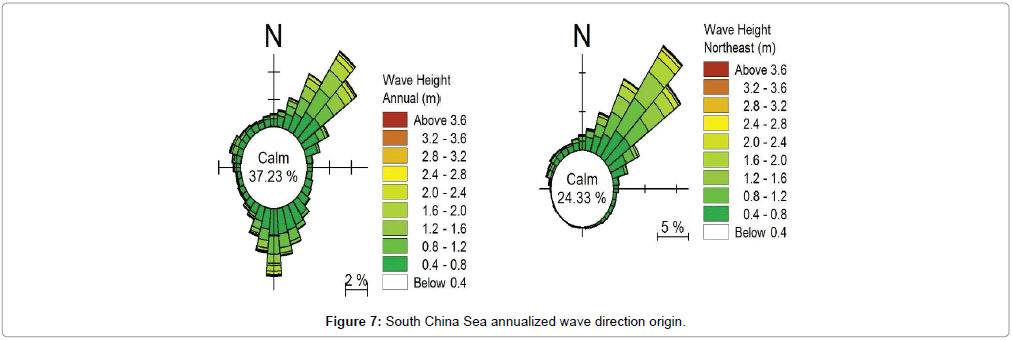
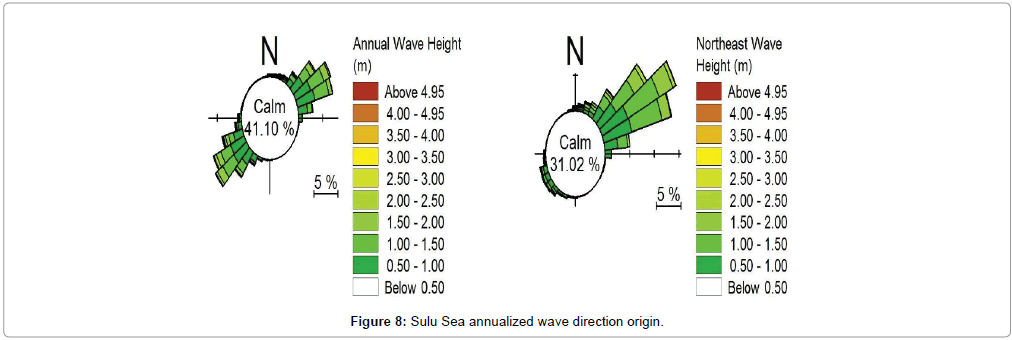
Wave data is an important parameter that governs the geological landscape and hydrodynamic regime inside Marudu Bay. For this particular study, a comparison between 10 years of historical wave data (1999 until 2008) from two stations located offshore far east at South China Sea (UKMO2) and far west at Sulu Sea (UKMO3) (Figure 6) with recent wave data recorded inside the bay on March 2015 were compared. From the historical records, the annual wave direction depicted from the South China Sea ranging from 30° to 60° during NEM period and originated from 150° to 210° during SWM period (Figure 7). Meanwhile, historical wave record extracted from the Sulu Sea indicated wave direction originating from 40° to 80° during the NEM period and from 210° to 260° during SWM (Figure 8). On the other hand, annual analysis shows significant wave height magnitudes and direction during NEM and SWM.
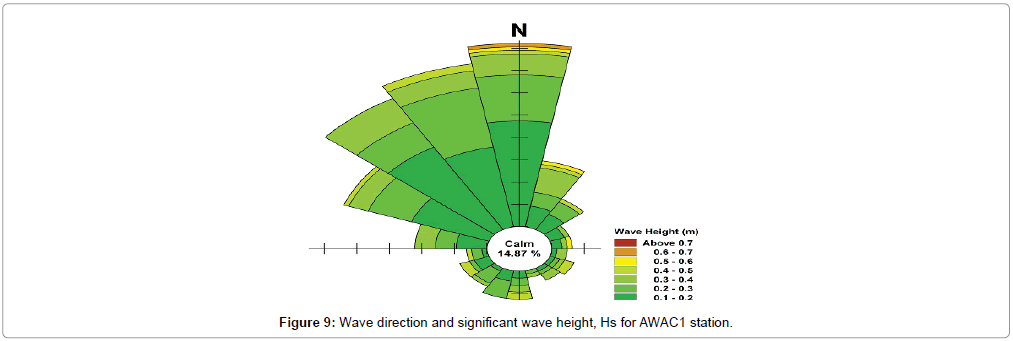
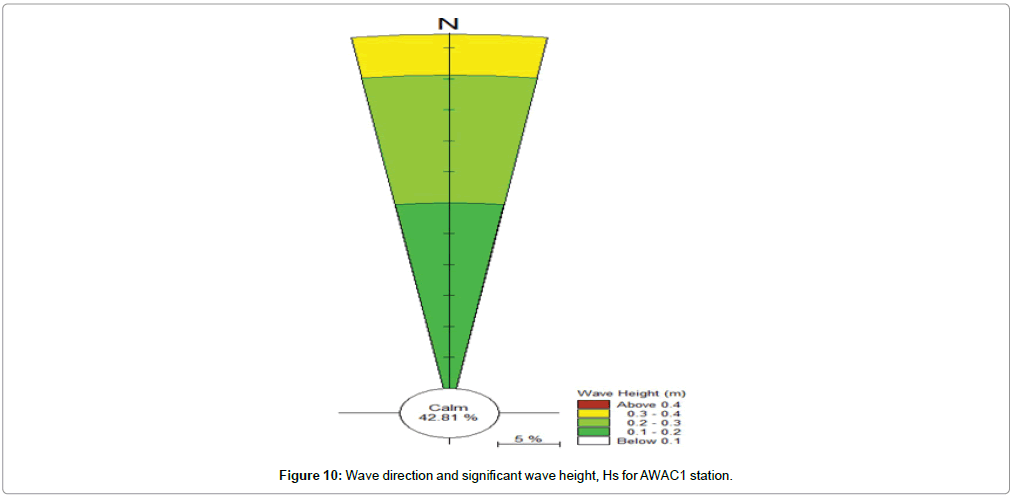
On the other hand, recent wave measurement inside the bay during NEM have shown dominant wave direction scattered from all directions but somehow dominant direction coming from 345° to 15° as extracted from AWAC1 (Figure 9) compared with direction extracted from AWAC2 where the direction came from 345° to 15° throughout the measurement period (Figure 10).
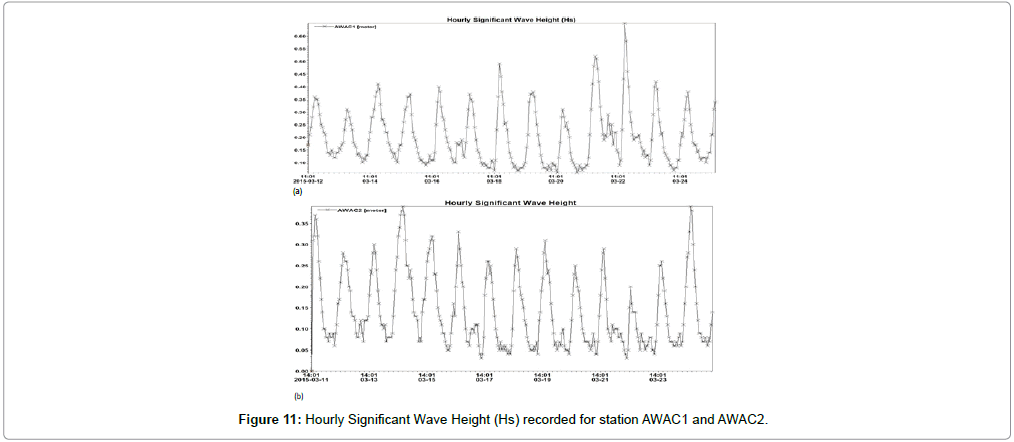
From the result comparison, Hourly Hs for AWAC1 and AWAC2 of the bay function as a wave barrier and provide shelter for settlement regardless of monsoonal season. AWAC1, the Hs during neap tide is about 0.10 m while during spring tide is about 0.6 m. Meanwhile, for Station AWAC2, the Hs recorded is around 0.05 m during neap and went up to more than 0.35 m during spring tide. It shows that the wave height inside Marudu Bay were bathymetry – induced characteristic or response. Figure 11 shows the Hs for Station AWAC1 (a) and AWAC2 (b).
Current data
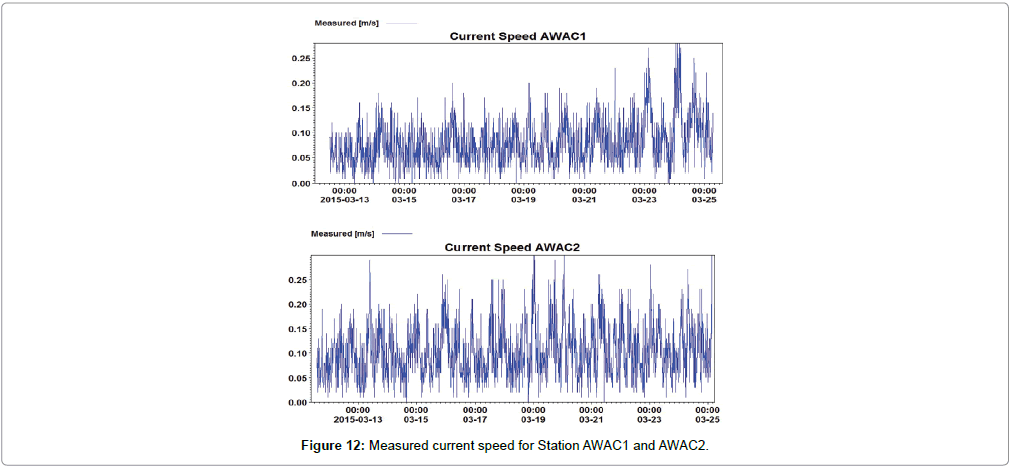
Currently, there are no available open source literatures for physical parameters data inside Marudu Bay. Hence, this primary data source can be referred to understand the dynamic current properties and profile inside the bay especially during NEM season. This study is also keen to obtain the optimum or presumably extreme current and wave conditions inside the bay where the shoreline dominated by mangroves forest and NEM period were considered dominant forces acting inside the bay. Hence, the location of the instrument was placed further inside the bay since the mangroves colonies abundances located further inside the bay. Figure 12 depicts the current speed measurement for AWAC1 (a) and AWAC2 (b) where it showed significant energy reduction moving from the open sea towards the bay. From the measured data record, it shows no significant difference for both measured data. Hence, it indicates that the bay is sheltered and suitable for the mangroves species to root stronger and grow as the characteristics for mangrove survival hood are emphasized by Nor Aslinda A, Lee et al. [8] where they stated that the maximum tolerable current speed ideal for mangroves growth in Malaysia is lesser (≤ ) 0.3 m/s. The average current speed inside the bay throughout the measurement period ranged from 0.05 to 0.15 m/s.
From the measured current speed using Vectrino meter, it shows that both stations recorded an average current speed between 0.05 m/s to 0.10 m/s during neap tide and 0.10 m/s to 0.15 m/s whereby 0.10 m/s to 0.20 m/s during spring tide. Hence, the dataset shows significant reduction caused by increasing sheer stress due to bed level changes as the water penetrate further towards the inner side of the bay. The needs of current velocity profile inside the mangroves intertidal zone were also carried out during this field measurement. The data is important to investigate the current speed within the intertidal zone of mangrove forest. Figure 13 indicates the measurement profile of current velocity recorded by Vectrino meter during tide rising in Tanjung Batu village (a) and Taritipan village (b) along the coastal road from Kota Marudu towards Pitas district inside the bay.
Hydrodynamic model interpretation
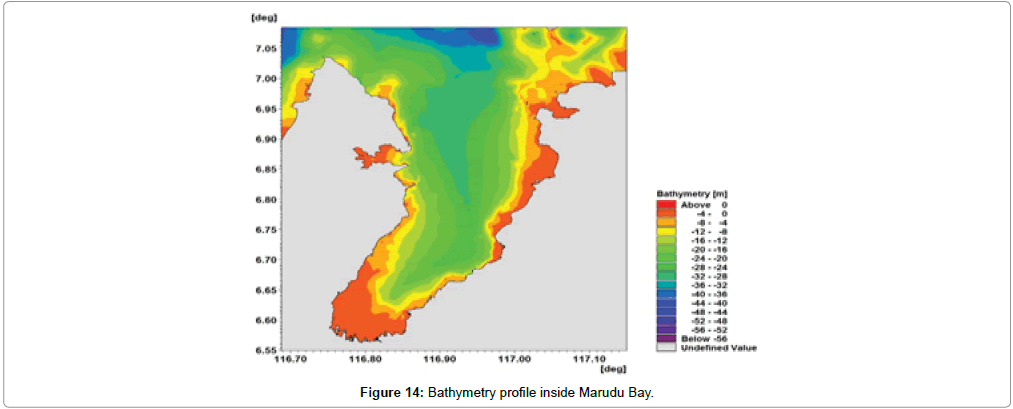
The need to understand the hydrodynamic condition inside the bay is crucial to understand the high survival rate of mangroves colonies inside the bay and to understand the transitional landscape from sandy beaches toward muddy coast from the bay mouth towards inner part of the bay. Figure 14 indicates the bathymetric profile inside the bay which have a great influence on energy dissipation entering the bay either from the Sulu or South China Seas.
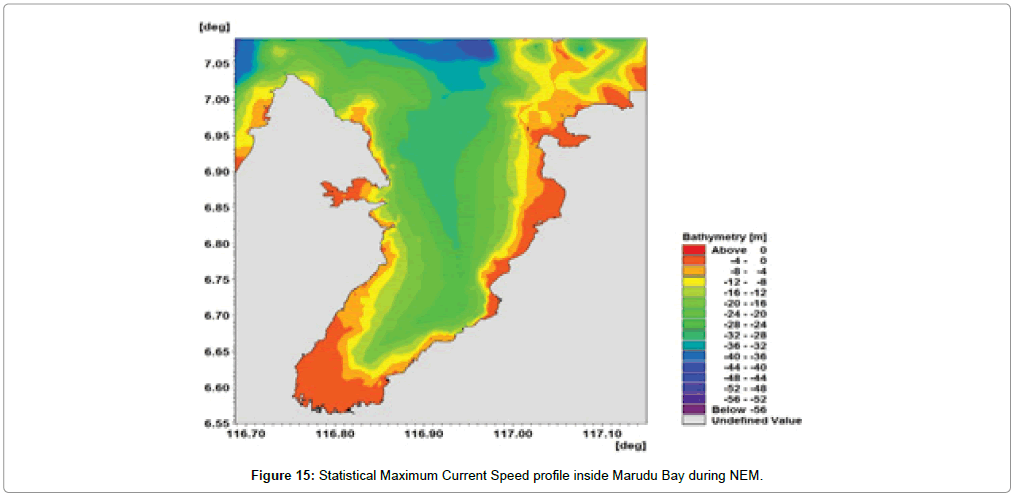
The bathymetry landscape inside the bay have shown sediment deposition occurrences at certain areas throughout the bay where they influence the morphological landscape across the bay. The thick orange colour at the very end of the bay indicates sediment deposition is thicker and the area coverage is wider where it provides good breeding ground for mangroves species to grow and anchored stronger. The bathymetric profile also has a great influence on the current profile inside the bay as depicted in Figure 15.
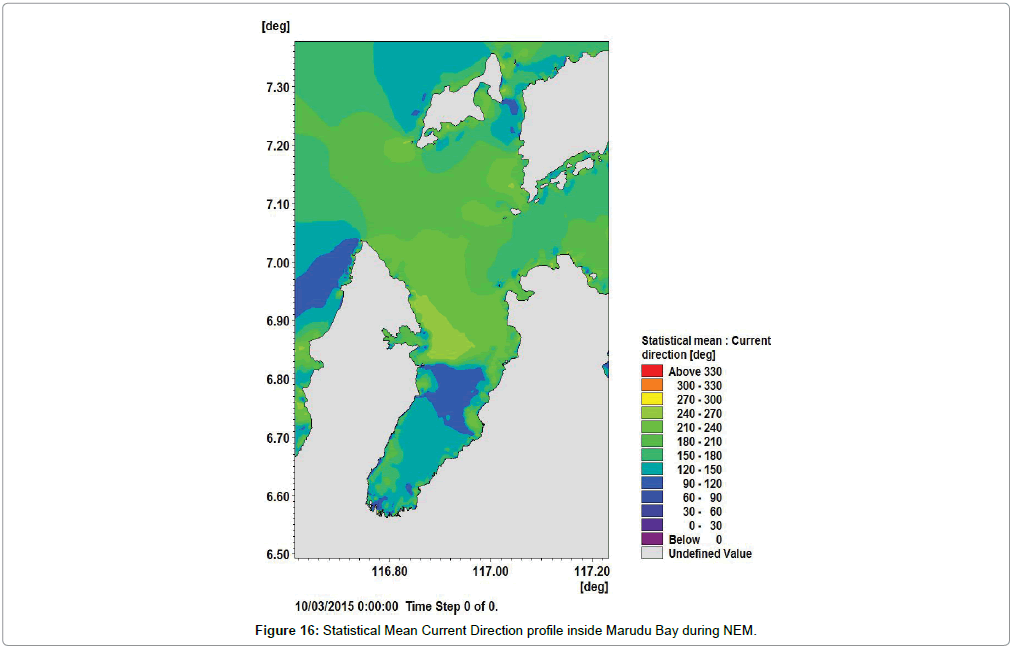
From the numerical simulation, it is clearly shown the water depth has a very strong influence on the velocity profile of the current. The deeper region from the bay mouth are much slower ranging from 0.1 m/s to 0.3 m/s meanwhile at the very end (deeper) of the bay it shows a fluctuation of the current speed and reaching the speed of 0.4 m/s to 0.6 m/s. Meanwhile, the mean current direction inside the bay seems to be calmer in the middle of the bay where the current is circulating between left and right edges. It indicates that there are collisions between the currents entering the bay and currents flowing from the inner part of the bay and created calmer vortex in the middle of the bay as depicted in Figure 16.
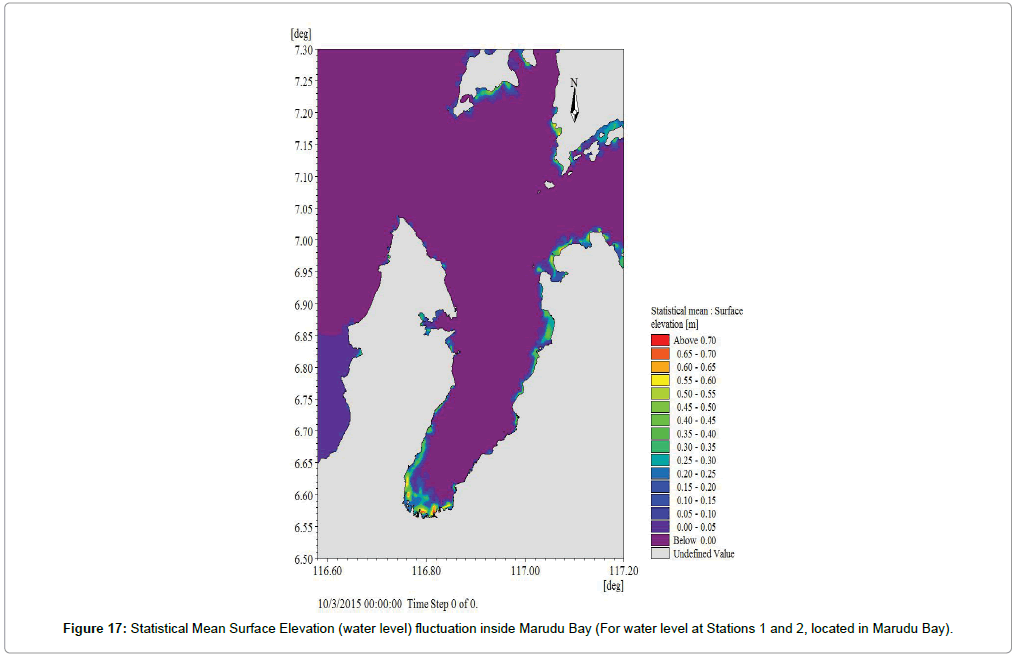
The water level fluctuation inside the bay is also among the crucial hydrodynamic factors that need to be investigated as it determines the stability of the bay as one of the important breeding ground for fisheries and aquaculture activities shared by the three (3) districts. Hence, the mean values were extracted to portray the drying depth inside the bay to locate the sediment deposition that will eventually provide significant evidence on the anchorage (stability) and species distribution of mangroves species inside the bay. Figure 17 portrays mean water level fluctuation inside the bay.
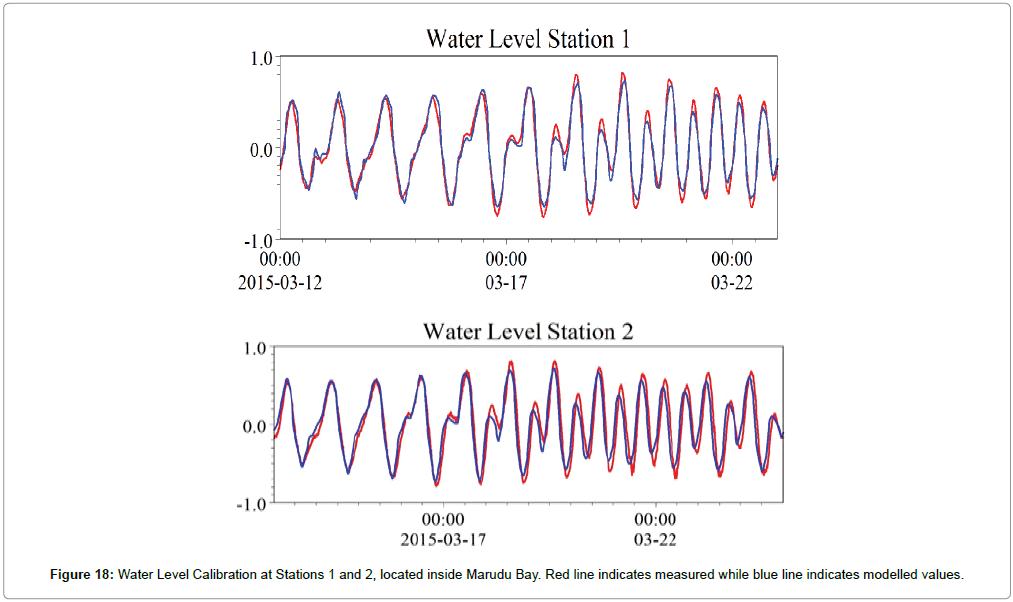
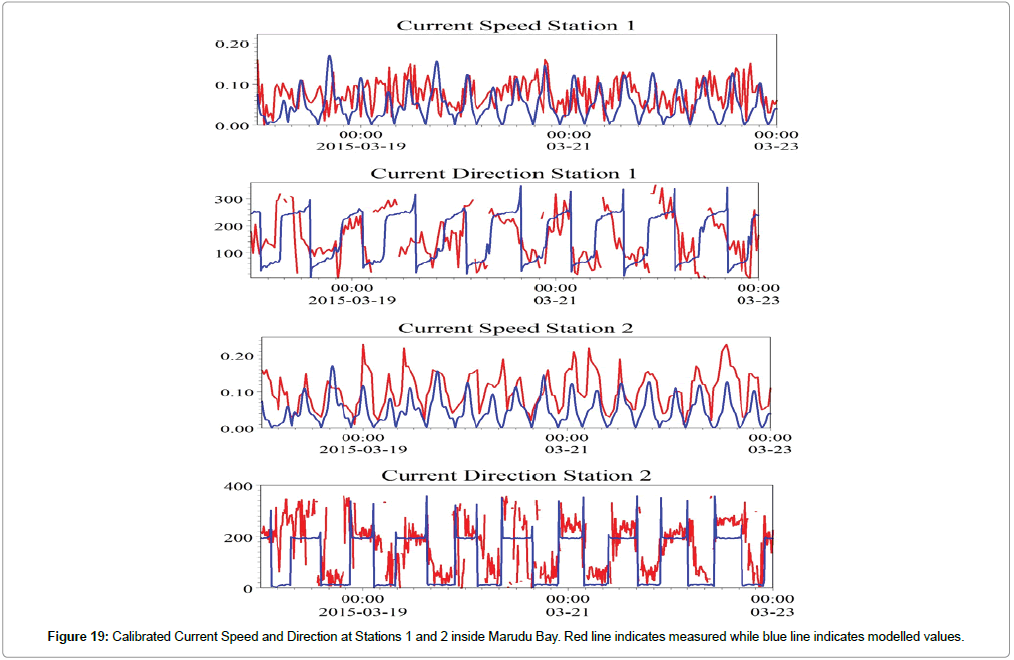
From the mean water level fluctuation model, it is certain that the flushing activities inside the bay were at the optimum level where the water can penetrate further in the intertidal area and the drying depth seems to be not extensively severe during inter-tidal period. Integrity of the model is also legitimate procedure in order to allow the use of the numerical model for references to understand the hydrodynamic process inside the bay. Hence, a series of calibration were carried out for water level and current properties in order to vividly verify the model integrity. Figure 18 shows the comparison of measured and model extracted profile.
Water level calibration inside Marudu Bay showed good agreement with the Root Mean Square Error (RMSE) where both Station 1 and Station 2 values were 7.5 and 11.93. Meanwhile, RMSE calculation for current speed produced exemplary results of 6.97 and 6.88, respectively. On the other hand, the current direction analysis surpassed the ≤ 20% mark for current profile [9]. This might be due to the enclosed bay environment and the fetch of the model boundary that need to be taken into consideration, where it should be regionally modelled. However, in this study, the model was simulated at local condition to reduce run time and also to minimize error since the calibration points are limited. Figure 19 shows the calibration for current speed and current direction of both stations.
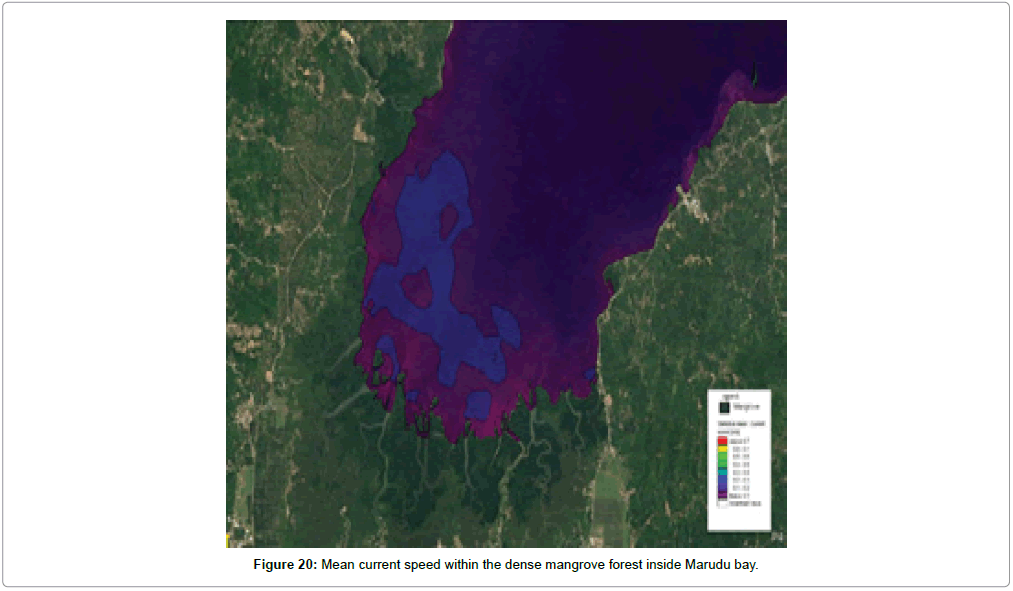
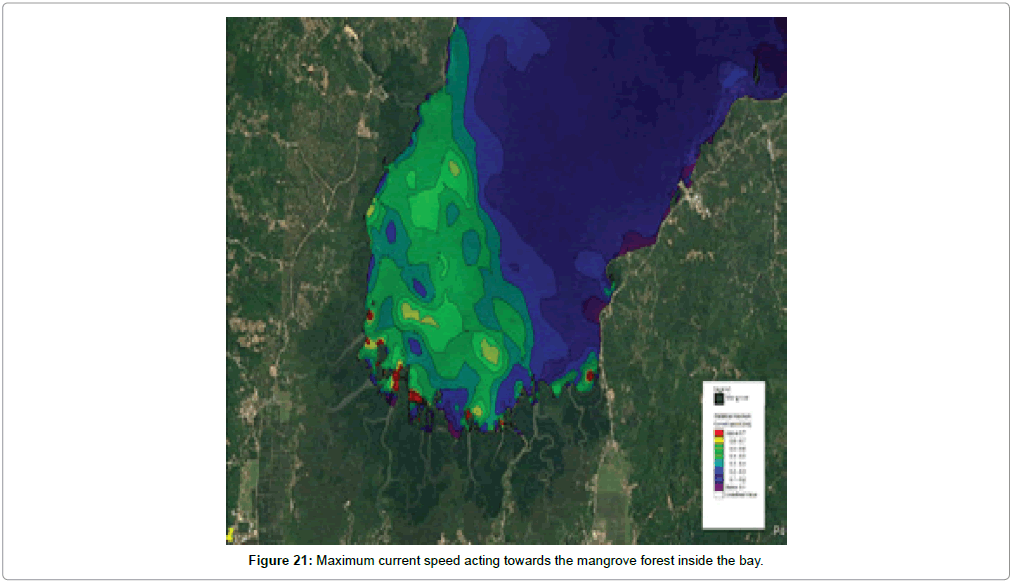
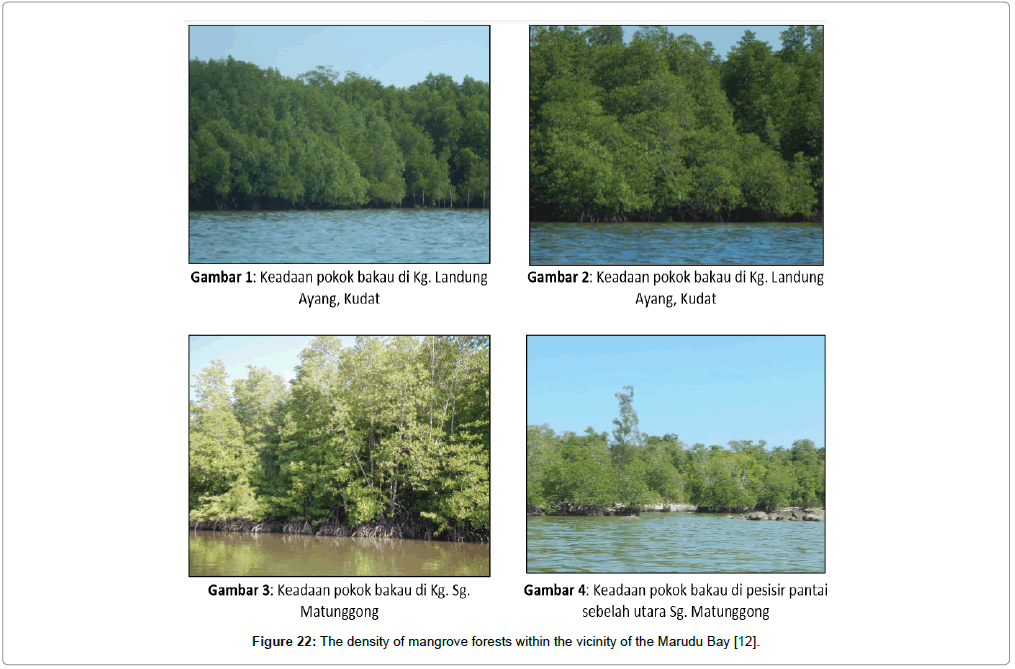
Figure 20 shows the modelled current speed (mean) within the dense mangrove forest inside the bay while Figure 21 indicates the modelled current speed (maximum) acting towards the mangrove forest inside the bay. Both figures have been overlayed with Google Earth Map to indicate the actual occurrences and density of mangrove forests in the bay while Figure 22 shows the condition of mangrove forests surrounding the Marudu Bay.
Figure 22: The density of mangrove forests within the vicinity of the Marudu Bay [12].
The modelling results from this study seems to agree with the findings of Nor Aslinda et al., Ikmalzatul et al. and Mohd Fauzi et al. [10-15], where muddy areas with current speeds between 0.02 m/s to 0.12 m/s are most conducive for mangrove growth and survival.
Conclusion
It is noteworthy to acknowledge the importance of physical marine data inside Marudu Bay for the benefit and usage of many plausible environmental and engineering research. The data is also required in physical and numerical simulation either as input or for model calibration. The collection of data during North East Monsoon is inevitably important since it is the most anticipated period that the bay receives the most extreme weather condition throughout the year. Efforts should be taken to undergo seasonal field measurement for physical parameters to better understand the hydrodynamic processes inside the bays. The continuous monitoring on physical parameters will provide exemplary evidence for sediment transport, bed level changes and water circulation study. Hence, the initiation of this physical data collection inside Marudu Bay is in dire need for the management, preservation and conservation of Marudu Bay since it plays an important role in the livelihood of the people from the three (3) districts of Kudat, Kota Marudu and Pitas.
References
- Jakobsen F, Hartstein N, Frachisse J, Tania G (2007) Sabah shoreline management plan (Borneo, Malaysia): Ecosystems and pollution. Oce Coa Man 50: 84-102.
- Kar ST, Julian R (2017) Effects of nutrients and zooplankton on the phytoplankton community structure in Marudu Bay Estuarine Coastal and Shelf Science 194: 16-29.
- Gassim MB, Tahir S, Brunotte DA (1993) Tectonic evolution of the Marudu Bay Sabah Malaysia. J Southeast Asian Earth Sciences 8: 513-527.
- Faridah Hanum I, Kudus KA, Saari NS (2012) Plant Diversity and Biomass of Marudu Bay Mangroves in Malaysia. Pak J Bot 44: 151-156.
- Aris AZ, Lim WY, Praveena SM, Yusoff MK, Ramli MF, et al. (2014) Water Quality Status of Selected Rivers in Kota Marudu Sabah Malaysia and its Suitability for Usage. Sains Malaysiana 43: 377-388.
- Flather RA (1976) A tidal model of the northwest European continental shelf. Mem Soc R Sci Liege 10: 141-164.
- Oddo P, Pinardi N (2008) Lateral open boundary conditions for nested limited area models: A scale selective approach. Ocean Mod-ell 20: 134-156.
- Nor Aslinda A (2010) Hydrodynamic modelling for mangrove afforestation at Haji Dorani. West Coast Peninsular Malaysia (Thesis, Master of Science (MSc)). The University of Waikato, Hamilton, New Zealand
- Department of Irrigation and Drainage Malaysia (DID) (2001) Guideline for Preparation of Coastal Engineering Hydraulic Study and Impact Evaluation (Fifth Edn) For Hydraulic Studies using Numerical Models.
- Nor Aslinda A, Anizawati A, Lee HL (2013) Hydrodynamics in Mangroves at Kelantan Delta: Numerical Analysis. Malaysian J Science 32: 179-194.
- Ikmalzatul A, Nor Aslinda A, Anizawati A, Shimatun Jumani I (2017) The Significance of Hydrodynamic Modelling for Mangrove Growth and Survival in Malaysia - E Proceedings of the 37th IAHR World Congress August 13-18, 2017. Kuala Lumpur, Malaysia.
- Mohd Fauzi M, Ikmalzatul A, Nor Aslinda A, Anizawati A (2018) The Significance of Hydrodynamic Modeling for Mangrove Replanting in Malaysia. Paper presented in the 7th Annual World Congress of Ocean 2018 at Weihai, China on 29th -30th October 2018.
- NAHRIM (2016) Final Report for Marine Data Collection inside Marudu Bay Sabah during Northeast Monsoon Period. Gedung Data NAHRIM (Unpublished).
- Lee HL, Nor Aslinda A, Khairul Azuan A, Tayalan M (2010) Identifying mangrove replanting plots from hydraulic assessments. Proceedings of the National Seminar on Coastal Morphology (COSMO) 2010 – the Muddy Coast of Malaysia, 17 June 2010. NAHRIM MINI Auditorium, Seri Kembangan, Selangor: 50-55.
Citation: Dunstan Anthony P, Nor Aslinda A, Ahmad Tarmizi A, Yannie AB, Zulazman ML, et al. (2019) Morphodynamic of Marudu Bay during North East Monsoon (NEM). J Earth Sci Clim Change 10: 515.
Copyright: © 2019 Dunstan Anthony P, et al. This is an open-access article distributed under the terms of the Creative Commons Attribution License, which permits unrestricted use, distribution, and reproduction in any medium, provided the original author and source are credited.
Share This Article
Recommended Journals
Open Access Journals
Article Usage
- Total views: 3500
- [From(publication date): 0-2019 - Apr 03, 2025]
- Breakdown by view type
- HTML page views: 2722
- PDF downloads: 778

