Research Article Open Access
Monitoring of Sheep Migration in Arid Region of Rajasthan, India Using EO Data
Gaur MK1*, Chand K2, Misra AK1, Roy MM3, Louhaichi M4 and Johnson DE51ICAR-Central Arid Zone Research Institute, Jodhpur, India
2ICAR-Indian Grassland Forest Research Institute, Jhansi, India
3ICAR- Indian Institute of Sugarcane Research, Lucknow, India
4International Center for Agricultural Research in Dry Area (ICARDA), Amman, Jordan
5Animal & Rangeland Sciences Department, Oregon State University, USA
- Corresponding Author:
- Gaur MK
ICAR-Central Arid Zone Research Institute, Jodhpur – 342003, India
Tel: +91 291 2786534 (Extn.: 254)
Fax: +91 291 2788706
E-mail: maheshjeegaur@yahoo.com
Received April 24, 2016; Accepted May 30, 2016; Published June 07, 2016
Citation: Gaur MK, Chand K, Misra AK, Roy MM, Louhaichi M, et al. (2016) Monitoring of Sheep Migration in Arid Region of Rajasthan, India Using EO Data. J Ecosys Ecograph 6:190. doi:10.4172/2157-7625.1000190
Copyright: ©2016 Gaur MK, et al. This is an open-access article distributed under the terms of the Creative Commons Attribution License, which permits unrestricted use, distribution, and reproduction in any medium, provided the original author and source are credited.
Visit for more related articles at Journal of Ecosystem & Ecography
Abstract
The annual aggregate spatially normal rainfall is extremely variable and most erratic in the western arid region of Rajasthan state. As a result, it frequently experiences spells of drought. Surface water resources are also meagre and distributed unevenly. Drought is a multi-dimensional phenomenon and its direct impacts include like withering of crops, drying of watering points, reduction in fodder for livestock, etc. Such crisis eventually compels Rebari pastoralists to migrate to other places and regions as a coping mechanism against the scarcity of fodder and water in the arid zone of Rajasthan. The scarcity of fodder at any time is a function of stocking rate and carrying capacity of the system at that time, which is affected mainly by the amount of precipitation and livestock population. This has been covered through analysing migration routes and determinants by using the data collected from the ATS plus GPS Collars. It has been found that biomass density changed following grazing across gradients and ground cover. Also, normalized difference vegetation index (NDVI) was 5-10% lower inside the grazing area than outside the grazing area.
Keywords
Small ruminants; Grazing lands; ATS plus global positioning system (GPS) collars; NDVI; Migration; Land degradation
Introduction
Grazing lands are declining due to agricultural intensification and increased livestock population, including small ruminants [1-3]. Further, these are not well-managed, and biologically degraded. As a result, pastoralists are compelled to undertake seasonal migration to improve the economic position of the household, save livestock or as a coping strategy [4] in arid part of India. Despite a global trend toward settlement, the incidence of pastoral migration is on the rise in the arid zone of Rajasthan, India [5]. The most ancient system (often involving long-distance, interstate and intrastate migration is the truly nomadic system where people and their livestock are frequently “on the move” [6] and the rebari pastoralists have a well- established mechanism as well as an integral part of coping, survival and livelihood strategies [7-9] and not just a response to emergencies. Coping migration has become accumulated over the period of time, as grazing condition improves only after the monsoon. But, issues of carrying capacity of land and migration are some of the phenomena that emerge from the interactions of the various agents with each other and the community lands [10]. So, as the availability of fodder and water in the village and surrounding areas decreases, pastoralists usually prepare themselves to migrate around the month of November.
Availability of area per livestock cattle unit has been in decline. It was 0.19 ha in 1972 that came down to 0.11 ha in 2003 in the semi-arid part, whereas there is a sharp decline in the arid part during the same period (from 0.86 ha to 0.31 ha). Common reasons are attributed to the increasing human population pressure, increase in herd size and decrease in grazing lands. Other important features identified are that pastoralists should have an easy access to markets and the procreative frequency of their herd through long, annual migration. This study was conducted by following two specific objectives: (a) to document and analyse sheep grazing and movement behaviour through the deployment of GPS collars, (b) to analyse their impact on the grazing lands in arid Rajasthan.
Material and Methods
Study area
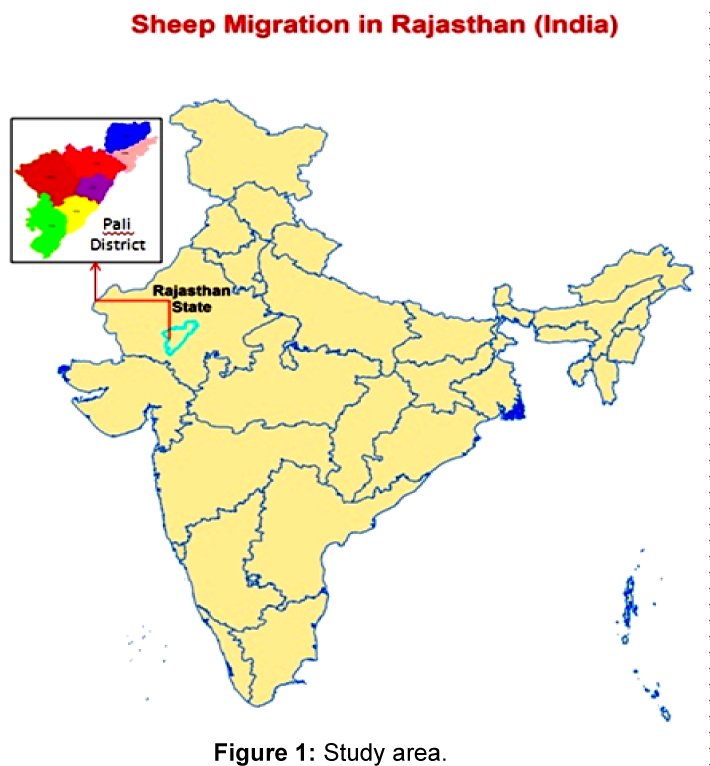
Village Nimbol lies in Jaitaran tehsil of Pali district (Rajasthan state, India). It is about 17 km away from the Jaitaran tehsil headquarters. Nimbol is part of the semi-arid zone of Rajasthan state (Figure 1). Majority of rainfall occurs during the monsoon period, i.e., June, July, August and September months. Occasionally, it may occur in the months of January and February. Average rainfall for 2006 was 73.6 mm and 48.58 mm in 2013. The annual maximum temperature of the village is 45°C and minimum 5°C.
As per the 2001 Census, human population of Nimbol was 4977 persons (2357 male and 2297 female) which has increased to 5573 persons (2639 male and 2572 female) in 2011 census. Pastoral and agro-pastoral communities in Nimbol constitute 10 to 12% of the total population. As per the 2007 and 2011 livestock census, there were about 4706 and 5285 livestock units in the village Nimbol. Sheep and goat accounted for 68 and 65 percent of the total livestock population for the respective years. It is estimated that on average, annual water demand of the village livestock is about 40174 m3/year.
There are one pond, one tanka1 and one nadi2 for human and livestock drinking. These have a storage capacity for 4-8 months. There are ten tube wells and five open wells in the village which are mostly used for agricultural purposes. About 6% area of the village has been earmarked for grazing of livestock population.
1tanka: These are underground rainwater harvesting tanks.
2nadi:These are local man-made pond for rainwater harvesting purposes and is a common feature in the Thar Desert [11].
Methodology
Two herd groups from the Nimbol village of Pali district (Rajasthan, India) were selected on the following basis for the deployment of GPS units:
1. Large flock size
2. Long–duration and long–distance migration to other states in search of fodder and water
3. The village falls in the agro-climatic transitional flood prone zone of Luni Basin, and
4. Permission given by the herders to deploy GPS Collars
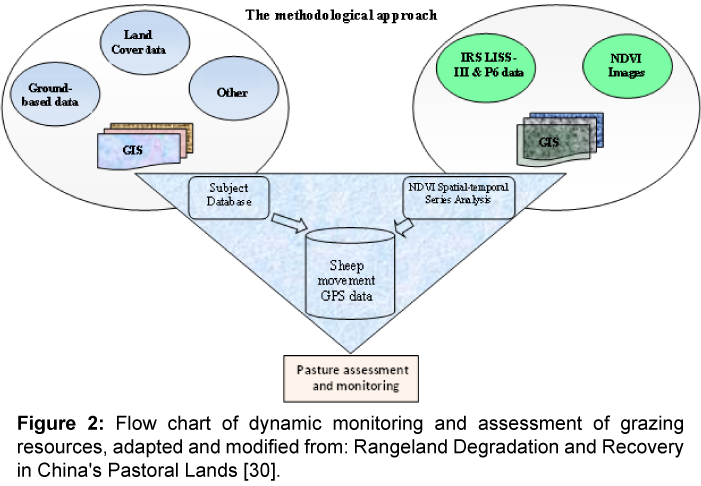
Timely and accurate remote sensing and GPS information are a major data source for monitoring dynamic behaviour of the local sheep and land use change in the extent of rangeland resources [12]. Three season IRS-P6 MX (5.8 m) (merged with Cartosat data of 2.5 m spatial resolution) data was used for this purpose in conjunction with livestock movement recorded GPS data. Normalized Difference Vegetation Index (NDVI), was calculated directly from the Landsat TM (Oct., 2013; spatial resolution 30 m) and IRS-LISS-III (Oct., 2006; spatial resolution 23.5 m) satellite data, which is related to vegetation density, such as biomass and percentage of vegetation cover. The approach and flowchart are shown in the Figure 2.
The following supporting information was collected; geographic coordinates, elevation, mean annual temperature (MAT), and mean annual precipitation (MAP), and movement of herds. Land use data was derived by combining this information with classified satellite images.
NDVI
The Normalized Difference Vegetation Index (NDVI) image data were stratified by land use polygons. Time-series NDVI statistics were calculated from the land use polygons that had been interpreted into high, medium, and low production rangelands.
NDVI [13], is calculated on a per-pixel basis as the normalized difference between the red and near infrared bands from an image:
NDVI = (NIR−R)/(NIR+R)
Where NIR is the near infrared band value for a cell and RED is the red band value for the cell. NDVI can be calculated for any image that has a red and a near infrared band [14]. The biophysical interpretation of NDVI is the fraction of absorbed photosynthetically active radiation [15]. Also, because it is a ratio of two bands [16,17] , NDVI helps compensate for differences both in illumination within an image due to slope and aspect, and differences between images due things like time of day or season when the images were acquired. Geospatial NDVI data layers were used to calculate the spatial patterns and temporal changes of above ground biomass.
Output: The output of NDVI is a new image file/layer. Values of NDVI can range from -1.0 to +1.0, but values less than zero typically do not have any ecological meaning, so the range of the index is truncated to 0.0 to +1.0 bands [16,17]. Higher values signify a larger difference between the red and near infrared radiation recorded by the sensor - a condition associated with highly photosynthetically-active vegetation [18]. Low NDVI values mean there is little difference between the red and NIR signals. This happens when there is little photosynthetic activity, or when there is just very little NIR light reflectance (i.e., water reflects very little NIR light) [19].
Fast tracking GPS collars and mapping the spatial and temporal dynamics of land use and movement
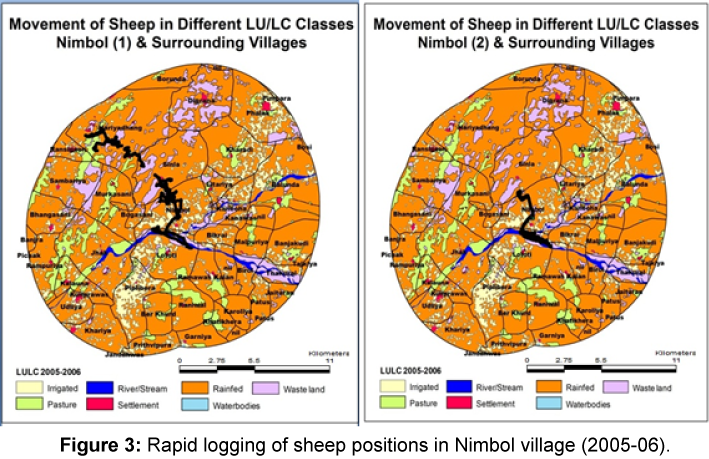
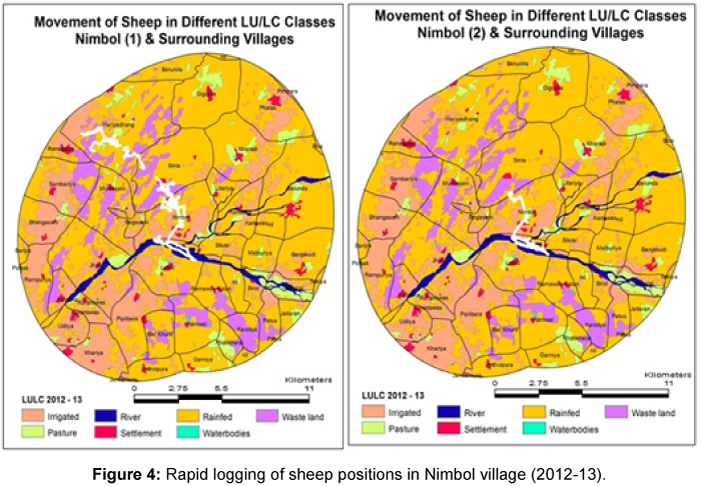
Two rapid GPS devices that logged at one-second interval was deployed in the two herds of sheep belonging to the village of Nimbol (Jaitaran tehsil, District Pali, Rajasthan). High resolution IRS-P6 data (2012-13) were procured from NRSC/DOS, Hyderabad. Land use mapping with a buffer of 10 kms were carried out. Thereafter, GPSrecords were plotted on the land use maps of 2005-06 and 2012-13 and are shown in the following Figures 3 and 4 and Tables 1 and 2.
An examination of the plotted GPS data indicates that sheep displayed a distinct daily diurnal behaviour pattern. They had two primary grazing periods during early morning and mid to late afternoon, with prominent rest periods following these two grazing bouts.
Results and Discussion
Correlation and trend analysis
NDVI, being a vegetation index makes it possible to compare images over time to look for ecologically significant changes in a landscape. NDVI values were in the range of 0.30 and 0.60 with an average of 0.45 in the study area. There was a total possible range of -1 to +1 for NDVI, 0.45 indicating relatively high photosynthesis activity. Biomass coverage in rainfed area was 52%, in irrigated areas 20% and in pasture areas 4% during 2006. Whereas in 2013, biomass coverage increased under irrigated to about 25%, but there has been a distinct decline in rainfed (46%) because of rains during 2012-13. So much of the biomass has been grazed by the freely roaming sheep herds. Interestingly, coverage of photosynthetic biomass in pasture areas has shown a relative increase from 4.05% in 2006 to 5.76% in 2013. Animal stay has increased from nil to 5.43% during the same period, indicating the availability of biomass for grazing in the pasture areas. It also shows that herders cautiously (or controlled) allowed their stocks to graze in pasture/grazing areas so that it could be utilized later during lean periods. Therefore, grazing has shown to significantly reduce nonphotosynthetic biomass on grazed land in comparison to non-grazed land use classes.
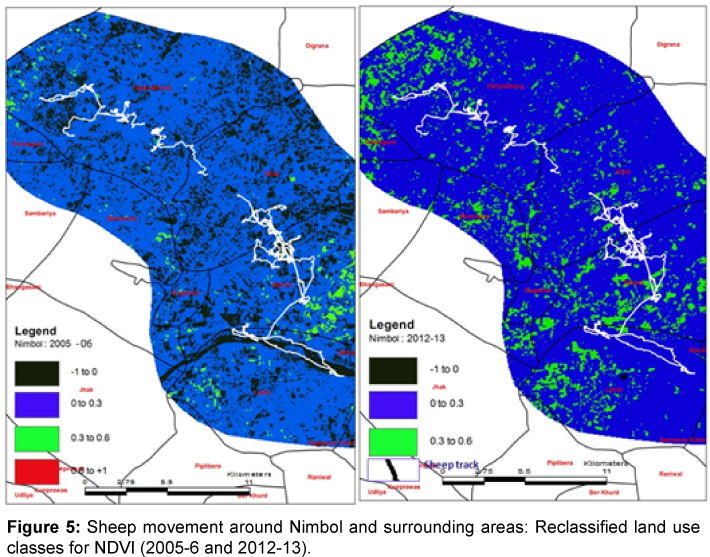
Further, another buffer of 1.5 km on either side of sheep movement was created to reclassify NDVI to understand grazing behaviour with respect to biomass availability (Figure 5). It indicated that the spectral reflectance in the range of –1 to 0 had drastically reduced in the reclassified NDVI of 2012-13. It was due to rain at regular intervals during September-October 2013. The rain helped in rapid regrowth of grazed areas. Such precipitation resulted in notable NDVI increases at all distance classes. However, there was still a detectable trend of increasing NDVI with distance from water. Further, spectral reflectance ranges of 0 to 0.3 and 0.3 to 0.6 showed a mild to moderate positive indication. That is, photosynthetic biomass coverage increased in the crop lands and wastelands. Relative NDVI values within these images have highlighted spatial patterns of vegetation, considering other background effects (like soil) remained fairly constant throughout the image. Grazing gradient persistence during periods of aboveaverage rainfall is an indicator of permanent landscape degradation [20]. This result suggests that the grazing gradient present around the water source is persistent, and that long-term landscape degradation is likely to occur [21]. These persistent patterns of increasing NDVI with distance from water are typical of the landscapes degraded by unmanaged grazing [22-24].
| 2005-06 | 2012-13 | ||||
|---|---|---|---|---|---|
| LU Class | Area (sq.km) | % Area | LU Class | Area (sq.km) | % Area |
| Cropland | 489.76 | 88.19 | Cropland | 451.01 | 81.27 |
| Pasture | 48.36 | 8.72 | Pasture | 29.52 | 5.32 |
| River | 8.27 | 1.56 | River | 12.97 | 2.34 |
| Settlement | 4.86 | 0.88 | Settlement | 9.47 | 1.71 |
| Water body | 0.40 | 0.07 | Water body | 0.61 | 0.11 |
| Wastelands | 3.23 | 0.58 | Wastelands | 51.34 | 9.25 |
Table 1:Land use/land cover in surrounding villages of Nimbol.
| Flock 1 | Flock 2 | |||||||
|---|---|---|---|---|---|---|---|---|
| 2005-06 | 2012-13 | 2005-06 | 2012-13 | |||||
| LU Class | Frequency | % Stay | Frequency | % Stay | Frequency | % Stay | Frequency | % Stay |
| Cropland | 62493 | 60.03 | 143041 | 39.26 | 42251 | 12.68 | 17330 | 5.20 |
| Pasture | - | - | 39605 | 5.43 | 3413 | 1.02 | 2590 | 0.78 |
| River | 38282 | 5.25 | 50224 | 6.89 | 39910 | 11.98 | 56223 | 16.88 |
| Settlement | 251864 | 34.56 | 256683 | 35.22 | 247551 | 74.31 | 249718 | 74.96 |
| Water body | 1152 | 0.16 | 649 | 0.09 | - | - | - | - |
| Wastelands | - | - | 47750 | 13.10 | - | - | 7265 | 2.18 |
Table 2: Frequency of visits / stay of sheep herd to each LU class (Flock 1 and 2).
The difference between the observed maximum NDVI and the reclassified maximum NDVI (referred to as residuals) was calculated pixel-by-pixel to identify the weather signal (the effect of precipitation). It indicates that once the weather signal is removed from the trends in vegetation activity, the remaining vegetation variations are attributed to human activities. Positive trends in the vegetation represented areas of vegetation recovery while negative trends constituted human-induced degradation of vegetation cover.
It is further clear that in spite of having a good pasture/grazing areas in nearby villages, herders did not venture there. Reasons may be attributed to (i) presence of a large livestock population in nearby villages; (ii) avoidance of inter-village and inter-community conflict for resource utilization; and (iii) keeping it as a reserve use, in case of any natural calamity or lean period.
Summary and Conclusion
When there is a favourable monsoon in the state, the sheep on transhumant migration decreases and incoming nomadic migratory sheep increases. During long-term drought, transhumant migration of sheep increases due to scarcity of fodder and water. Unfavourable monsoon conditions and continuous drought propels sheep migration as livestock suffers from scarcity of fodder and water [25].
Small ruminants, particularly sheep are mainly reared by the resource poor farmers relying on the communal pasture land and other grazing lands. While grazing land and its conditions determine the productivity of sheep stock and its by-products, overgrazing adversely affects the health condition of the common property resources as well as rainfed lands. Reduction of primary productivity is a reliable indicator of the decrease or destruction of the biological productivity, particularly in drylands. The reduction in forage, grasses and vegetative cover has adversely affected the health conditions of common property resources as well as rainfed lands.
Since the drought induced migration affects the poorest people much more than rich in the catchment area. Poor people draw their sustenance and graze their animals there. It is strikingly different from the catchment area from where the rich people draw the dry matter [26]. The results presented here suggest that routine assessment of grazing gradients and rangeland resources at large spatial scales is possible with existing GPS devices and classified satellite images [27-30]. NDVI induced by land degradation has been measured using remote sensing techniques, so remote sensing has become an essential tool for such local level studies of land degradation. Nimbol is an areas where biomass productivity depends on seasonal rainfall and years of below-normal rainfall significantly exhibits below-normal NDVI [31]. Land use change is a main driver of land degradation so it would be useful to undertake analysis of NDVI against change in land use and management and corresponding time series data for land use or land cover also indicates such dynamics [32,33].
Acknowledgement
The authors are grateful to the ICAR for granting permission to undertake this research study and ICARDA for funding and providing GPS Collars.
References
- Rathore JS (2004) Drought and household coping strategies:A case of Rajasthan.Indian Journal of Agricultural Economics 59: 689-708.
- Narain P, Kar A (2005) Drought in western Rajasthan: impact, coping mechanism and management strategies.Central Arid Zone Research Institute, Jodhpur.
- Rath N (1992) Economics of sheep and oat in Maharashtra. Indian Journal of Agricultural Economics 47: 62-78.
- Davies S (1996) Adaptable livelihoods: coping with food insecurity in the Malian Sahel, London: Macmillan Press.
- Robbins P (1998) Nomadization in Rajasthan, India: migration, institutions, and economy. Human Ecology 26: 87-112.
- Squires VR, Karami E (2015) Livestock management in the arid zone: coping strategies.Journal of Rangeland Science 5: 336-346.
- Rao GB (2001) Household coping/survival strategies in drought-prone regions: a case study of Anantapur District, Andhra Pradesh, India. Collaborative Research Project between NRI, SPWD and GIDS, Society for Promotion of Wastelands Development, New Delhi.
- Conroy C, Iyengar S, Lobo V, Rani U, Rao GB (2001) Household livelihood and coping strategies in semi-arid india: synthesis of macro- and micro-level findings. NRSP Project R7558. Chatham: Natural Resources Institute.
- Mosse D, Gupta S, Mehta M, Shah V, Rees J, et al. (2002) Brokered Livelihoods: debt, labour migration and development in tribal western India. Journal of Development Studies 38: 59-87.
- Epstein JM, Axtell R (1996) Growing Artificial societies: social science from the bottom up. Brookings Institute Press, Washington, DC.
- Mahesh KG, Gaur H (2004) Combating desertification: building on traditional knowledge systems of the Thardesert communities. J Environ Monit Assess 99: 89-103.
- Orra RJ, Katherine NT, Griffitha BA, Championa RA (2012) Foraging paths through vegetation patches for beef cattle in semi-natural pastures. ApplAnimBehavSci141: 1-8.
- Cooka JE, Steven Mark Rutter Rouse JW, Haas RH, Schell JA, Deering DW, et al. (1974) Monitoring the vernal advancements and retrogradation (greenwave effect) of nature vegetation. NASA/GSFC Final Report, NASA, Greenbelt, MD, p. 371.
- Gitelson AA, Kaufman YJ, Merzlyak MN (1996) Use of a green channel in remote sensing of global vegetation from EOS-MODIS. Remote Sens Environ 58: 289-298.
- Shopan AA, Tarekul Islam GM, Saiful Islam AKM, MunsurRahmanMd, L�¡z�¡r AN, et al. (2014) Temporalvariation of biomass concentration in the Bangladesh sundarbans using remote sensing techniques. InternatConf on Adv in Civil Engineering, 26 â��28 Dec, 2014 CUET, Bangladesh.
- Hobbs TJ (1995) The use of NOAA-AVHRR NDVI data to assess herbage production in the arid rangelands of Central Australia. International Journal of Remote Sensing 16: 1289-1302.
- Moleele N, Ringrose S, Arnberg W, Lunden B, Vanderpost C (2001) Assessment of vegetation indexes useful for browse (forage) production in semi-arid rangelands. International Journal of Remote Sensing 22: 741-756.
- http://www.aerialagimagery.com/ndvi.html
- Fuller DO (1998) Trends in NDVI time series and their relation to rangeland and crop production in Senegal, 1987-1993. International Journal of Remote Sensing 19: 2013-2018.
- Pickup G, Bastin GN, Chewings VH (1994) Remote-sensing-based condition assessment for nonequilibrium rangelands under large-scale commercial grazing. Ecological Applications 4: 497-517.
- Harris AT, Asner GP (2003) Grazing gradient detection with airborne imaging spectroscopy on a semi-arid range land. J Arid Environ 55: 391-404.
- Bastin GN, Sparrow AD, Pearce G (1993) Grazing gradients in central Australian rangelands: ground verification of remote sensing-based approaches. The Rangeland Journal 15: 217-233.
- Pickup G, Chewings VH (1994) A grazing gradient approach to land degradation assessment in arid areas from remotely sensed data. International Journal of Remote Sensing 15: 597-617.
- Pickup G, Bastin GN, Chewings VH (1998) Identifying trends in land degradation in non-equilibrium rangelands. Journal of Applied Ecology 35: 365-377.
- Baleshwar T, Pomeroy P, Chris C, Sudhir TK (2007) City, society, and planning: planning. Concept, New Delhi.
- Gupta AK (1986) How common is commons: Political economy of wasteland development. Paper prepared for seminar on Control of Drought, Desertification and Famine 17-18 May 1986, India International Center, New Delhi.
- Kawamuraa K, Akiyamaa T, Yokotab H, Tsutsumic M, Yasudad T, et al. (2002) Quantifying grazing intensities using geographic information systems and satellite remote sensing in the Xilingol steppe region, Inner Mongolia, China. Journal of Agriculture, Ecosystems and Environment107:83-93.
- Singh C, K�¶hler-Rollefson I (2005) Sheep pastoralism in Rajasthan: Still a viable livelihood option?. Work shop report, LokhitPashu-PalakSansthan, Sadri, Rajasthan, India.
- RouseJW,HaasRH,SchellJA, DeeringDW (1974) MonitoringvegetationsystemsintheGreatPlainswith ERTS.In:FradenSC,MarcantiEP, BeckerMA(eds.)ThirdERTS-1, NASA, Washington D.C,pp: 309-317.
- SquiresVR,Xinshi LU,Qi LU,Tao W, Youlin Y (2009) Rangeland degradation and recovery in China's pastoral lands. CABI, UK .
- SureshA,GuptaDC, MannJS (2011) Trends, determinants and constraints of temporary sheep migration in Rajasthan � an economic analysis. Agricultural Economics Research Review24: 255-265.
- ftp://mco.cfc.umt.edu/resources/MCO/Papers/MODIS_VI_UsersGuide_01_2012.pdf
- http://www.asprs.org/a/publications/proceedings/pecora17/0018.pdf
Relevant Topics
- Aquatic Ecosystems
- Biodiversity
- Conservation Biology
- Coral Reef Ecology
- Distribution Aggregation
- Ecology and Migration of Animal
- Ecosystem Service
- Ecosystem-Level Measuring
- Endangered Species
- Environmental Tourism
- Forest Biome
- Lake Circulation
- Leaf Morphology
- Marine Conservation
- Marine Ecosystems
- Phytoplankton Abundance
- Population Dyanamics
- Semiarid Ecosystem Soil Properties
- Spatial Distribution
- Species Composition
- Species Rarity
- Sustainability Dynamics
- Sustainable Forest Management
- Tropical Aquaculture
- Tropical Ecosystems
Recommended Journals
Article Tools
Article Usage
- Total views: 12604
- [From(publication date):
June-2016 - Jul 18, 2025] - Breakdown by view type
- HTML page views : 11598
- PDF downloads : 1006

