Research Article Open Access
Molecular Dynamics Investigation & Visualization on the Phase Transition of a Lennard-Jones Fluid
A. Sheikhi, M. Shariaty-Niassar*
School of Chemical Engineering, College of Engineering, University of Tehran, Iran
- *Corresponding Author:
- M. Shariaty-Niassar
Transport Phenomena and Nanotechnology Laboratory
School of Chemical Engineering, College of Engineering
University of Tehran, P.O. Box 11155-4563, Tehran, Iran
E-mail: mshariat@ut.ac.ir
Received Date: May 03, 2012; Accepted Date: August 02, 2012; Published Date: August 05, 2012
Citation: Sheikhi A, Shariaty-Niassar M (2012) Molecular Dynamics Investigation & Visualization on the Phase Transition of a Lennard-Jones Fluid. J Powder Metall Min 1:103. doi: 10.4172/2168-9806.1000103
Copyright: © 2012 Sheikhi A, et al. This is an open-access article distributed under the terms of the Creative Commons Attribution License, which permits unrestricted use, distribution, and reproduction in any medium, provided the original author and source are credited.
Visit for more related articles at Journal of Powder Metallurgy & Mining
Abstract
Two methods of ‘gradual cooling’ and ‘freezing’ were developed and hired to impose phase transition to nanoscale pure argon system as a general important example of Lenard-Jones fluids. Also, for more consideration two different duration of gradual cooling were applied to transmit the gaseous phase to liquid and then to the solid state. To investigate phase transition of liquid state argon to solid state more explicitly, the condensed phase was simulated by means of ‘freezing’ method and compared to above cooling ways. Moreover, MDS (molecular dynamics simulation) was introduced as an useful tool for visualization and better understanding connection of molecular phenomena behavior and macroscopic events. A great consistency between simulation results and previously reported data was observed which represented MDS studies and visualizations as a powerful tools for phase transition thermodynamic studies.
Keywords
Lenard-Jones fluid; Phase transition; Gradual cooling; MDS (Molecular Dynamics Simulation)
Introduction
Molecular Dynamics Simulation (MDS) is an excellent toolbox in modeling molecular phenomena which is used to ensure and understand the structure [1,2] dynamics and behavior of any matter with intense detail verbatim on scales where motion of individual atoms can be trailed [3-5]. “In the real world, this could eventually mean that most chemical experiments are conducted inside the silicon of chips instead of the glassware of laboratories” [6]. To do this, there is a variety of methods ranging from assuming groups of atoms as single units, reduction of corresponding coordinates to explain different aspects of motion, and molecular averaging using mean force potentials [7]. This can be combined with stochastic dynamics. To describe the dynamics using densities instead of atoms and fluxes rather than velocities as response to thermodynamic gradients or accelerations as a response to forces [5], MDS can be utilized.
Theory
Although modeling the motion of a molecule by solving the wave functions of the various subatomic particles would be accurate, but it would also be very hard to program and consume more computing memory and power than anyone has. Based on this idea, the starting point of MDS is to solve Newton’s equations of motion for a system of N interacting atoms [8].
 (1)
(1)
The forces are the negative derivatives of a potential function V (r1, r2… rN).
 (2)
(2)
Where F is the sum of the forces exerted on the molecule by the other molecules in the system, r is the position vector of the molecule, t is the time, and m is the mass of the molecule. Integrating Eq. (1) once in time yields the velocity of the molecule. Integrating once more results in its displacement. By integrating Eq. (1) for every molecule in the simulation domain step by step from some initial state, detailed information of the movement of every molecule could be obtained. This information can be further processed by time averaging, space averaging or both to provide the macroscopic physical properties over the entire simulation domain.
Clustering in Phase Transition
The formation of clusters of atoms and molecules is increasing interest both for experimental researchers and theoretical scientists. This field can be exactly related to many areas of physics and chemistry, such as, catalysis, nucleation, interface phenomena, phase transition etc. Most recent numerical and theoretical studies have dealt with cluster formation in the solid or liquid state but little has been done with regard to the gas phase [9]. In this present paper, the result of molecular modeling and simulation are compared and discussed with experimental results of other investigators. High potential of this method is shown competitive to expensive and difficult experimental studies.
Modeling
The simulation was performed with a specific number of argon atoms in a nanometric cubic box running with Periodic Boundary Conditions (PBC) for the particle motion to solve the problem of surface effects and keep up the number density in the central box and the whole system [5]. The interaction of the argon atoms could be calculated via combination of Lennard-Jones (LJ) and a three-body Axilrod-Teller (AT) potential by using VAT (Eq. 3, 4) [5].
 (3)
(3)
 (4)
(4)
Where σ = 3.405 Å and ε = 119.4 K, ν = 73.2E84 ergcm9, rij, rik, rjk and θ1, θ2, θ3 the sides and interior angles of a triangle formed by three particles. AT potential is attractive for blunt triangles and repulsive for sharp triangles so the AT potential is in shorter range than the LJ potential. Calculations were performed by developing two thermodynamic ways to impose phase transition to system: Gradual Cooling Method (GCM) and Freezing Method (FM).
Methods
Gradual Cooling Method (GCM)
A system of 100 argon atoms was defined at the initial state of 100 K and 1 bar (gaseous state). The Berendsen method of coupling temperature was hired to cool the system slowly. Simulations were conducted with two different time durations: 1000 (Gradual Cooling Method 1) and 5000 (Gradual Cooling Method 5) picoseconds (ps). The rate of cooling was 0.075 and 0.0149 K/ps for gradual cooling 1 and 5, respectively. The temperature was isotropic. For reaching these time periods, 5,00,000 and 2,50,0000 time steps carried out, each of 2 femtoseconds (fs), respectively. In the next step, we minimized the energy of system by steepest descents method with force tolerance and initial step-size of 10 and 0.01, respectively, 20 maximum number of iterations in relax shells, and a random start-up velocities for molecules. If a starting configuration is very far from equilibrium, the forces may be excessively large and the MD simulation may fail. In those cases a robust energy minimization is required. Another reason to perform an energy minimization is the removal of all kinetic energy from the system: if several snapshots from dynamic simulations must be compared, energy minimization reduces the thermal noise in the structures and potential energies, so that they can be compared better. Two different durations of gradual cooling empowered us to transmit the gaseous phase to liquid and then to the solid state.
Freezing Method (FM)
To study the phase transition of liquid argon to solid state more explicitly, condensed phase was simulated. A duplicated number of atoms at the initial state of 95 K and 10 bars (liquid state) were defined. Simulation was conducted in 5,00,000 time steps, each goes for 2 fs, with a linear mode for center of mass motion removal, and Berendsen method both for temperature and pressure. The temperature was reduced by the rate of 0.1 K/ps and other parameters are like as last section.
Results and Discussion
To study the specific changes in different parameters of the system during a phase transition process, molecular dynamics simulation using GROMACS© was conducted and a proper relationship between system parameters and what is seen beneath molecules behavior pursued. Pymol© (an open source software) and also an internal engine in GROMACS named ‘ngmx’, was applied for system visualization.
GCM analysis
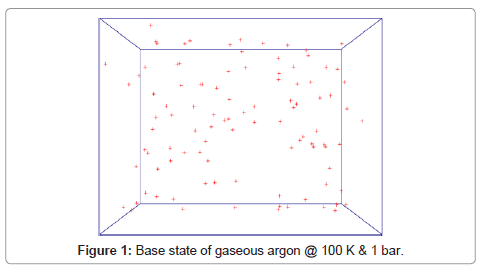
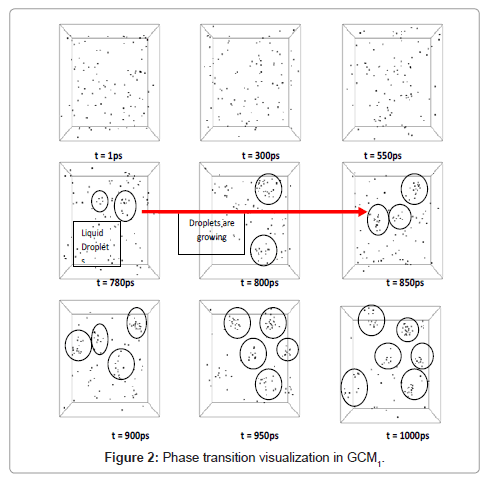
Base state of molecules at 100K and 1 bar is shown in Figure 1. Condensation of argon is visualized in Figure 2.
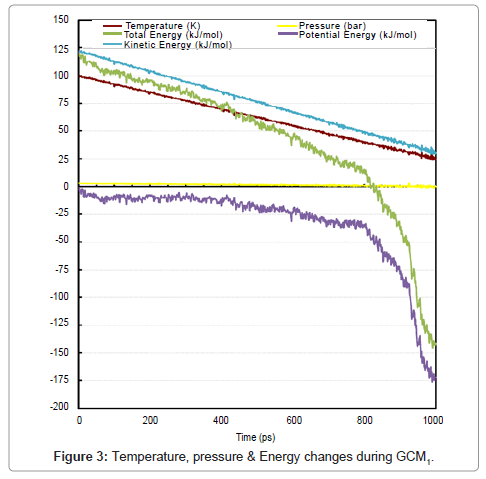
Formation of liquid droplets (are shown with circles in the pictures) begins as time reaches to about 780 ps. Vexations in properties prove the phase change at about 780 ps. A great accordance between visual events and change in properties of system was obvious. Figure 3 is declaring the change in temperature, pressure and energies.
Pressure of the system is highly dependent on the molecules in gas phase, by formation of liquid clusters pressure is starting to get lower and the fluctuations begin. Due to studying liquid phase in this section, we did not continue the simulation time. Directional pressures and Solvent Accessible Area (SAA) are shown in Figure 4. SAA is the available area of a specific substance which is present for a specific solvent. Here the solvent is an imaginary substance and there is no difference between hydrophobic and hydrophilic area because the total area is measured and reported.
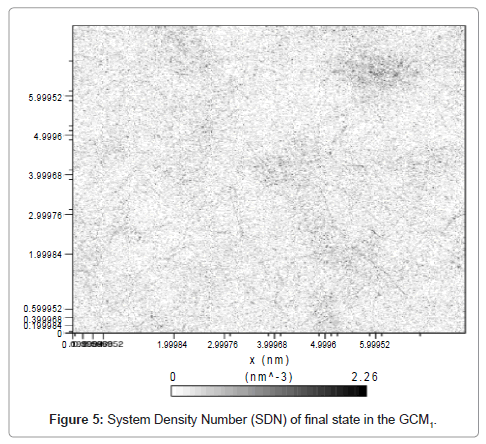
As it can be seen from (Figure 4), at time of about 780 ps the severe break down in accessible area is occurred. By formation of liquid phase the SAA is reduced greatly and that’s why the aggregation of molecules leads to less-accessible fluid. Solvent accessible area (surface) showed a great compatibility with the phase transition of the system. Also a deep reduction was observed at t ≈ 780 ps. SAA for liquid argon reached to 60 nm2. Study of directional pressure change could be useful in rheological treatment of fluids in millimeter channels and especially in micro channels whose application in engineering fields are fast rising and leading to supper-intensified unit operations such as micro -reactors, -columns, -heat exchangers etc. Figure 5 shows the density number of system after 1000 ps.
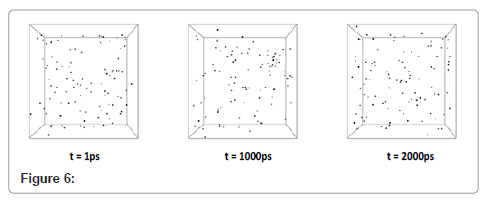
Dispersion of dark area in system density number (Figure 5) shows that the phase transitions had not led to solid state yet and there are nanodroplets all over the system. Moreover, the darker area indicates the more dense sections in the system which is related to liquid phase. With multiplying the time period of simulation by 5, cooling was begun. Step by step visual events are shown in Figure 6.
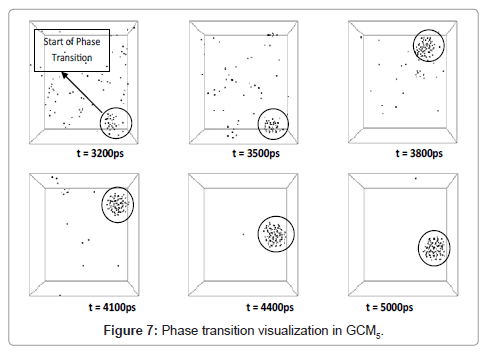
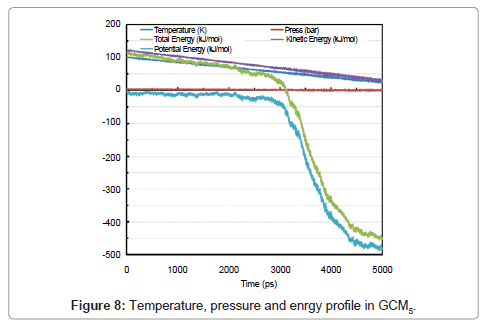
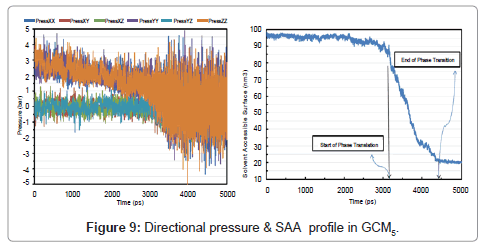
As discussed, beginning of the phase transformation occurred at about 3200 ps and a sharp slope of potential and therefore total energy could be a good proof of this physical condition.
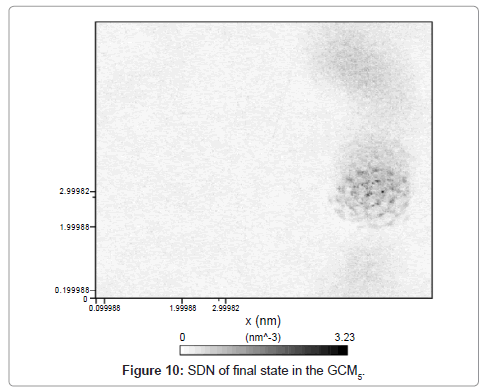
Directional pressures in (Figure 9) were severe fluctuations in comparison with GCM1. This is as a result of the advance to solid phase. Figure 8 shows the temperature, pressure and energy profile in GCM5. SAA is also plotted and 20 nm2 of surface was gained for a 100-molecule micro cluster of solid argon in (Figure 9) analysis.
System number density which indicates the conglomerate density, expresses the solid formation is presented in Figure 10.
FM analysis
In the gradual cooling simulation, we have not only perceived the condensation to the liquid phase, but at lower temperatures also the freezing towards the solid phase. To concentrate on this phase more specifically, to simulate the condensed phase, base state was selected as liquid phase (95 K & 10 bars). Step by step events in forming solid state is cleared in Figure 11.
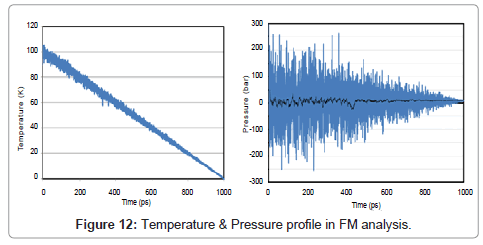
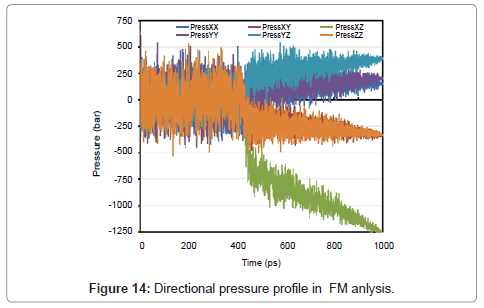
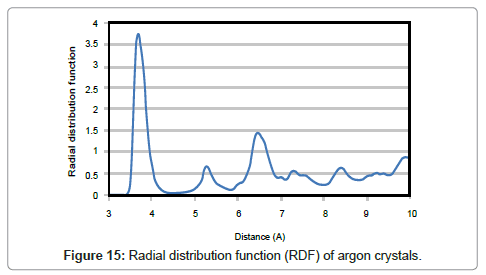
Just like as two previous sections, temperature, pressure, energy, directional pressures, RDF and also volume are shown in Figures 12- 15.
During the phase transition argon release latent heat, and therefore the volume change abruptly.
One of the best ways for analyzing structure of a matter is ‘Radial Distribution Function’ which describes the probability of finding a pair of particles with distance of r in a thin layer with thickness of dr. As the cooling took place slowly, the final form of solid argon would be crystalline and the atoms adopt positions in crystal lattices. Peaks in the radial distribution function which are characteristic for crystals, clearly show a shaped-structure substance. On the other hand, single peaks in the RDF indicate fixed distances as in crystals while more uniform distributions point to disordered states.
The probability of finding an atom center at a certain distance around an atom in solid state is higher than that of liquid. Having the value of about 3.8 for the largest peak means it is 3.8 times more likely that two molecules would be found at this specific separation. The nearest neighbor distance for two argon moleculs is about 3.7 Å. The radial distribution function then abates and passes through a minimum value around 5.8 Å. It means that the chance of finding two atoms with this separation is less.
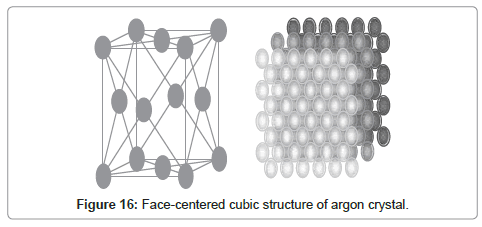
Real structure of argon crystals is shown in Figure 16. The radial distribution graph obtained from MDS is compatible with the crystalline structure of solid argon.
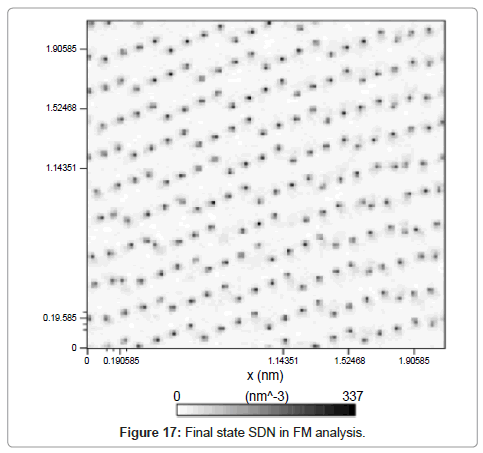
System density number is also shown in Figure 17. The in-line color intensity is a proof of crystalline solid argon structure.
Conclusion
It has been shown along this work that the molecular dynamics simulation is a practical method for analysis of properties of matter from a microscopic point of view. Additionally, the information provided by molecular dynamics simulation is not only very helpful for the growth of matter-of-fact physical models of the atomic behaviour but also may be a precious aid for interpretation of different kind of experiments. We have extended the MDS discussed in this paper to the consideration of relating visual events in molecular world to properties in macroscopic world. Hence, two different gradual cooling duration results discussed and visualized. Moreover, freezing method investigated for phase transition investigation and results were compared to the above mentioned gradual cooling methods. All outcomes are in good consistancy with experimental and macroscopic findings. In as much as clusters of atoms are the bridges between microscopic and macroscopic particles, study of clusters should also offer reasonable results for the phase transition processes from a microscopic point of view. Furthermore, by means of the developed methods, having experimentally-difficult conditions was achieved and a great consistency between the simulation results and previous reported data was observed. On the other hand, the MDS is very useful tool for the study of phase transitions and interfacial systems.
Acknowledgements
The authors wish to thank Dr. A. Omumi, University of Guelph, Canada for having drawn his attention to the paper and for his helpful comments.
References
- Rafat M, Fong KW, Goldsipe A, Stephenson BC, Coradetti ST, et al. (2008) Association (micellization) and partitioning of aglycon triterpenoids. J Colloid Interface Sci 325: 324-330.
- Palleschi A, Bocchinfuso G, Coviello T, Alhaique F (2005) Molecular dynamics investigations of the polysaccharide scleroglucan: first study on the triple helix structure Carbohydr Res 340: 2154-2162.
- Carlsson AF, Madix RJ (2000) The dynamics of argon and methane trapping on Pt (111) at 30 and 50 K: energy scaling and coverage dependence. Surf Sci 458: 91-105.
- Case FH, Brennan J, Chaka A, Dobbs KW, Friend DG (2008) The fourth industrial fluid properties simulation challenge. Fluid Phase Equilibria 274: 2-9.
- Lindahl E, Hess B, van der Spoel D (2001) Gromacs 3.0: A package for molecular simulation and trajectory analysis. J Mol Mod 7: 306-317.
- The Economist (1998) The 1998 Nobel prizes Picking winners.
- Steinhauser MO, Hiermaier S (2009) A review of computational methods in materials science: Example from shock-wave and polymer physics. Int J Mol Sci 10: 5135-5216.
- Pani Yi, Poulikakos D, Walther J, Yadigaroglu G (2002) Molecular dynamics simulation of vaporization of an ultra-thin liquid argon layer on a surface. Heat Mass Transfer 45: 2087-2100.
- Polymeropoulos EE, Brickmann J (1982) Molecular dynamics study of the formation of argon clusters in the compressed gas. Chem Phys Lett 92: 59-63.
Relevant Topics
- Additive Manufacturing
- Coal Mining
- Colloid Chemistry
- Composite Materials Fabrication
- Compressive Strength
- Extractive Metallurgy
- Fracture Toughness
- Geological Materials
- Hydrometallurgy
- Industrial Engineering
- Materials Chemistry
- Materials Processing and Manufacturing
- Metal Casting Technology
- Metallic Materials
- Metallurgical Engineering
- Metallurgy
- Mineral Processing
- Nanomaterial
- Resource Extraction
- Rock Mechanics
- Surface Mining
Recommended Journals
Article Tools
Article Usage
- Total views: 7779
- [From(publication date):
November-2012 - Apr 03, 2025] - Breakdown by view type
- HTML page views : 3141
- PDF downloads : 4638

