Research Article Open Access
Molecular and Morphological Characterisation of Back Cross Generations for Yield and Blast Resistance in Rice
Divya Balakrishnan1*, Robin S2, Rabindran R2 and John Joel A21National Professor Project, Crop Improvement Section, Directorate of Rice Research-ICAR, Hyderabad, India
2Department of Rice, Centre for Plant Breeding and Genetics, Tamil Nadu Agricultural University, India
- Corresponding Author:
- Dr. Divya Balakrishnan
Scientist (Plant Breeding and Genetics)
National Professor Project, Crop Improvement Section
Directorate of Rice Research-ICAR, Rajendranagar-30, Hyderabad, India
Tel: +918374499907
E-mail: divyabalakrishnan05@gmail.com or divyab0005@gmail.com
Received Date: January 18, 2016; Accepted Date: August 15, 2016; Published Date: August 25, 2016
Citation: Mbamalu ON, Antunes E, Silosini N, Samsodien H, Syce J (2016) HPLC Determination of Selected Flavonoid Glycosides and their Corresponding Aglycones in Sutherlandia frutescens Materials. Med Aromat Plants 5:246. doi:10.4172/2167-0412.1000246
Copyright: © 2016 Balakrishnan D, et al. This is an open-access article distributed under the terms of the Creative Commons Attribution License, which permits unrestricted use, distribution, and reproduction in any medium, provided the original author and source are credited.
Visit for more related articles at Rice Research: Open Access
Abstract
Blast caused by Pyricularia oryzae is one of the major constraints limiting rice production globally. Study was undertaken at TNAU, India using a set of selected genotypes including cultivated varieties and (Near Isogenic Lines) NILs and they were screened for blast resistance both genotypically and phenotypically. Genetic diversity was studied among the genotypes and those which are diverse in blast resistance but had similar morphological and quality traits were selected as parents for breeding programme. Selected genotypes were crossed and advanced to further generations up to BC4F1 by marker assisted back crossing. Genetic variability and heritability parameters were assessed among these segregating generations for yield and resistance traits and their trend in each generation was analysed. The disease resistance traits showed high variability in segregating generations as the parents were selected based on the diversity in disease reaction and therefore gives scope for improvement through selection. High heritability coupled with low genetic advance was found in all characters in the segregating generations except single plant yield and panicle length.
Keywords
Genetic advance; Heritability; Molecular markers; Yield; Blast resistance
Introduction
Rice (Oryza sativa L.) being one of the prime staple crops of the world has a crucial role in the global food security and contributes for the livelihood of majority of the Asian population. Rice production and productivity are constrained by biotic and abiotic stresses in the growing areas. Rice blast caused by the fungus Pyricularia oryzae has been recognized as one of the most serious diseases and is distributed across 85 countries globally. Host plant resistance has been recognized as an important strategy to manage blast disease compared to chemical control measures. More than 100 blast resistance genes have been identified in rice [1,2] but effective and durable use of these reported genes has been limited because of evolution of new virulent races of the fungus [3]. Enhancing host plant resistance through pyramiding of multiple resistance genes is one of the useful strategies to avoid frequent breakdown of resistance. In addition to overlapping resistance, it could provide cross protection by minimizing the race evolution in the fungus. Combining many resistant traits or resistant genes without appropriate study of their effect on the genetic background may derive undesirable genotypes.
The application of molecular tools in identification of resistance sources and selection of desirable genotypes in segregating generations can accelerate the development of blast-resistant cultivars in an adapted genetic background. Simple Sequence Repeats (SSRs) linked to report resistance have been used for screening the parents and to identify the polymorphism between the genotypes because of their quantity and high polymorphism among rice varieties [4-8]. Rice genetic diversity on the basis of morphological characterization has been studied previously and used in selection of parents in breeding programs [9-13].
Along with this, genetics of resistance traits and their effect on yield is to be assessed to obtain high yielding resistant lines. Study on inheritance and genetic basis of the resistance traits is of high importance, in initial segregating generations or prior to crop improvement programs. It will be helpful in implementing appropriate breeding strategy, and precise screening of advanced generations. Variability parameters for different morpho-agronomic as well as resistance traits were estimated in the segregating generations. It is evident that assessing the variability in the segregating lines under varying environmental conditions is essential for the improvement of popular varieties with stable yield potential. Study was conducted to improve blast resistance in popular Indian rice varieties through marker assisted backcross breeding approach [14]. The parental genotypes were screened for identifying suitable genotypes to develop a high yielding variety with blast resistance. Each segregating populations generated from selfing and back crossing of the selected cross were phenotyped for yield and resistance traits. Information on the phenotypic data of different generations was subjected to analysis of variability and heritability parameters and the trend in each generation was assessed.
Materials and Methods
In this study, a group of blast susceptible and resistant genotypes (Table 1) were subjected to diversity analysis and they were crossed to obtain F1s. The parental genotypes and advanced generations obtained from a selected cross (ADT43 × CT13432-3R) were screened for blast resistance and yield parameters using both genotypic and phenotypic measures. Popular Indian cultivar, ADT 43 was selected as recurrent parent for improvement because of its wide adaptability and acceptability in South India owing to its high yield, short duration and grain quality, but it is highly susceptible to blast disease. CO 39 near isogenic line (NIL), CT13432-3R pyramided with four blast resistance genes [15] developed from CIRAD was selected as resistant donor in this study. Parental genotypes and advanced generations were raised during 2009 to 2012 in the experimental plots of the Paddy Breeding Station (PBS), Coimbatore and at Hybrid Rice Evaluation Centre (HREC), Gudalur which is an endemic location for blast disease. Advanced generations from the cross of ADT 43 × CT13432-3R viz., F2, F3, BC1, BC2 and BC3 were raised and screened in normal as well as epiphytotic conditions. The data obtained from the segregating generations were assessed statistically for various yield and disease related traits viz., plant height, number of tillers, productive tillers, leaf length, leaf width, panicle length, days to first flowering, days to maturity, filled grains per panicle, total grains per panicle, spikelet fertility, 100 grain weight, single plant yield, lesion number, infected leaf area, potential disease incidence percentage, leaf blast and lesion type (Supplementary Table 1). The experimental details are given in Supplementary Figure 1.
| Sl No. | Parents | Blast Response | Pedigree | Varietal group | Origin | Features |
|---|---|---|---|---|---|---|
| P1 | ADT 43 | Susceptible | IR 50 × Improved White Ponni | Indica | TRRI, Aduthurai, Tamil Nadu | High yielding, semi dwarf popular rice variety in Tamil Nadu (110 days) |
| P2 | Improved White Ponni | Susceptible | Selection from Ponni | Indica | TNAU, Coimbatore, Tamil Nadu | High yielding, tall, medium slender rice variety (125-130 days) |
| P3 | BPT 5204 | Susceptible | GEB 24/ TN1/ Mahsuri | Indica | ANGRAU, Bapatla, Andhra Pradesh | High yielding, semi dwarf, fine medium slender grain variety grown across India for its high yield and quality. (140-145 days) |
| P4 | CO 39 | Susceptible | Cul. 340 × Kannagi | Indica | TNAU, Coimbatore, Tamil Nadu | High yielding short duration variety Blast susceptible |
| P5 | CT 13432-3R | Resistant | CO 39 NIL | Indica | CIRAD | Blast resistant NIL with genes Pi1, Pi2, Pi33 |
| P6 | C101 A51 | Resistant | CO 39 × A5173 NIL | Indica | CIRAD | Blast resistant NIL with genes Pi2/Piz5 |
| P7 | CI01 PKT | Resistant | CO 39 × Pai-kan-tao NIL | Indica | CIRAD | Blast resistant NIL with genes Pi4a, Pi-3 |
| P8 | CI01 LAC | Resistant | CO 39 × Lac23 NIL | Indica | CIRAD | Blast resistant NIL with genes Pi1, Pi33 |
| P9 | TORIREI | Resistant | CO 39 NIL | Indica | CIRAD | Blast resistant NIL with genes Pizt |
| P10 | CO 39 (CIRAD) | Resistant | CO 39 NIL | Indica | CIRAD | |
| P11 | TETEP | Resistant | Indica | Vietnam | Semi dwarf, Blast resistant variety with genes Pikh/ Pi54,Pi ta (130-135 days) | |
| P12 | MOROBOREKAN | Resistant | Japonica | Guinea (West Africa) | Blast resistant variety with genes Pi 5(t), Pi7(t) |
Table 1: Description of the genotypes used in the study.
Diversity analysis
The parental genotypes were screened for reported molecular markers linked to blast resistance (Supplementary Table 2). For the microsatellite assay, twenty markers linked to four blast resistance genes Pi1, Pi2, Pi33 and Pi54 were used viz., RM 224, RM 1223, RM 5926, RM 1233, PR 10, RM 527, RM 136, RM 549, RM6836, AP5659- 3, RM 72, RM 331,RM 404, RM 483, RM 3374, RM 284 and RM 25 (Figure 1). The allelic variation of these markers were surveyed at the parental level was and the polymorphic SSR markers were selected for the further screening of the crosses and segregating populations. Diversity of the parental genotypes were studied using phenotypical data and molecular marker information using NTSYs-pc UPGMA cluster analysis and Jaccard’s coefficient [16].

Figure 1: Parental polymorphism of blast resistant genes linked markers along with CO 39 NILs.
Estimation of genetic parameters
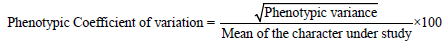
The various genetic parameters like variability, genotypic co-efficient of variation (GCV), phenotypic co-efficient of variation (PCV), heritability and genetic advance were calculated by adopting the given formulae [17]. The average variance observed in the genotypes was considered as environmental variance. The genotypic variance of each progeny was estimated by subtracting the estimated environmental variance from the phenotypic variance.
Environmental variance (VE) = Average phenotypic variance of both the parents
Phenotypic variance (VP) = VG + VE
Genotypic variance (VG) = VP - VE
Data on quantitative characters were analysed for variances and significance of treatments. The genotypic co-efficient of variation (GCV) and phenotypic co-efficient of variation (PCV) were estimated.
The PCV and GCV values were categorized as follows [18].
| PCV and GCV | Category |
|---|---|
| <10% | Low |
| 10-20% | Moderate |
| >20% | High |
Heritability
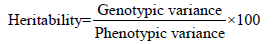
Heritability in the broad sense was calculated according to the formula [17] suggested as follows
The heritability was categorized as follows.
| Heritability in per cent | Category |
|---|---|
| <30 | Low |
| 31 - 60 | Medium |
| >60 | High |
Genetic advance
Genetic advance was estimated by following formula [17] given as Genetic advance = k × h × σp
where,
h2 = Heritability in broad sense
σp = Phenotypic standard deviation
k = Selection differential (2.06 at 5% selection intensity)
Genetic gain
Expected genetic gain under selection was calculated by the following formula [17] suggested as
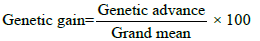
Genetic gain was categorized as
| GA per cent value | Category |
|---|---|
| <10% | Low |
| 10-20% | Moderate |
| >20% | High |
Results and Discussion
Estimation of diversity among parental genotypes
The parents ADT 43 and CT13432-3R were grouped into different clusters based on blast resistance parameters, but came under similar cluster on morpho-agronomic trait (Table 2) information (Figure 2). The F1s of these parents were selected for further advancement, so that recovery of the parental genotype was faster with not much compromise on local adaptability and acceptability. Among the parents, resistant donor CT13432-3R was having alleles of all the Pi genes and the susceptible lines were devoid of those alleles which confirmed the linkage of markers to the resistance genes. Many workers employed the technique of molecular analysis along with morpho-agronomic studies and their association in rice [19-21] for the simultaneous improvement of various traits.
| GENOTYPES | PH | NT | PRT | LL | LW | PL | DFF | DM | FGP | TGP | SPF | SPS | 100GW | SPY | GL | GB | LBR | LN | ILA | PDI% |
|---|---|---|---|---|---|---|---|---|---|---|---|---|---|---|---|---|---|---|---|---|
| ADT 43 | 62.30 | 28.00 | 25.33 | 27.17 | 0.97 | 23.13 | 86.00 | 111.00 | 186.00 | 191.00 | 97.38 | 2.69 | 1.52 | 25.72 | 8.00 | 2.00 | 4.00 | 35.00 | 80.00 | 100.00 |
| CT 13432-3R | 87.33 | 23.00 | 21.00 | 28.00 | 1.30 | 20.67 | 82.67 | 107.67 | 157.00 | 184.00 | 85.33 | 17.20 | 2.31 | 24.58 | 6.83 | 3.17 | 2.16 | 5.00 | 3.00 | 11.11 |
| IMP. W. PONNI | 113.67 | 19.33 | 19.00 | 30.67 | 1.03 | 24.70 | 119.33 | 144.33 | 121.00 | 175.00 | 69.14 | 44.63 | 2.43 | 50.50 | 7.00 | 1.67 | 4.20 | 22.00 | 60.00 | 77.78 |
| BPT 5204 | 65.00 | 22.00 | 21.00 | 26.00 | 1.20 | 21.00 | 125.33 | 150.33 | 113.00 | 171.00 | 66.08 | 51.33 | 2.13 | 35.87 | 7.17 | 1.83 | 3.91 | 25.00 | 75.00 | 55.56 |
| TETEP | 133.33 | 23.67 | 23.67 | 30.00 | 0.83 | 25.53 | 114.00 | 139.00 | 125.00 | 158.00 | 79.11 | 26.40 | 2.06 | 29.68 | 6.33 | 2.33 | 2.71 | 5.00 | 5.00 | 11.11 |
| MOROBOREKAN | 117.33 | 9.33 | 9.33 | 33.00 | 1.50 | 26.67 | 109.00 | 134.00 | 143.00 | 148.00 | 96.62 | 3.50 | 2.84 | 32.56 | 8.17 | 3.17 | 2.58 | 15.00 | 10.00 | 33.33 |
| TORIREI | 61.00 | 14.33 | 10.33 | 17.00 | 0.63 | 16.40 | 75.00 | 100.00 | 50.00 | 69.00 | 72.46 | 38.00 | 2.02 | 35.17 | 6.57 | 3.00 | 2.19 | 25.00 | 10.00 | 22.22 |
| CIOI A51 | 62.67 | 12.00 | 7.33 | 23.53 | 0.67 | 17.50 | 77.00 | 102.00 | 80.00 | 94.00 | 85.11 | 17.50 | 2.71 | 31.09 | 7.33 | 3.17 | 2.32 | 3.00 | 5.00 | 11.11 |
| CIO1 PKT | 58.33 | 14.00 | 9.33 | 14.00 | 0.57 | 15.63 | 69.67 | 94.67 | 66.00 | 79.00 | 83.54 | 19.70 | 2.34 | 35.14 | 7.00 | 2.50 | 2.80 | 10.00 | 10.00 | 33.33 |
| CIOI LAC | 55.00 | 7.33 | 5.33 | 18.77 | 0.57 | 15.33 | 70.00 | 95.00 | 71.00 | 91.00 | 78.02 | 28.17 | 2.35 | 35.53 | 7.00 | 3.00 | 2.33 | 15.00 | 50.00 | 55.56 |
| CO 39 CIRAD | 56.67 | 10.67 | 9.00 | 17.50 | 0.53 | 15.70 | 69.67 | 94.67 | 70.00 | 73.00 | 95.89 | 4.29 | 2.11 | 39.99 | 6.00 | 3.00 | 2.00 | 25.00 | 10.00 | 44.44 |
| CO 39 | 68.33 | 10.00 | 6.67 | 21.00 | 0.97 | 20.17 | 69.67 | 94.67 | 49.00 | 53.00 | 92.45 | 8.16 | 2.16 | 13.51 | 7.00 | 3.00 | 2.33 | 45.00 | 85.00 | 77.78 |
| MEAN | 78.41 | 16.14 | 13.94 | 23.89 | 0.90 | 20.20 | 88.95 | 113.95 | 102.58 | 123.83 | 83.43 | 21.80 | 2.25 | 32.45 | 7.03 | 2.65 | 2.79 | 19.17 | 33.58 | 44.44 |
| MAX | 55.00 | 7.33 | 5.33 | 14.00 | 0.53 | 15.33 | 69.67 | 94.67 | 49.00 | 53.00 | 66.08 | 2.69 | 1.52 | 13.51 | 6.00 | 1.67 | 2.00 | 3.00 | 3.00 | 11.11 |
| MIN | 133.33 | 28.00 | 25.33 | 33.00 | 1.50 | 26.67 | 125.33 | 150.33 | 186.00 | 191.00 | 97.38 | 51.33 | 2.84 | 50.50 | 8.17 | 3.17 | 4.20 | 45.00 | 85.00 | 100.00 |
| SD | 27.58 | 6.78 | 7.39 | 6.17 | 0.32 | 4.12 | 21.61 | 21.61 | 44.77 | 51.62 | 10.81 | 16.39 | 0.34 | 9.01 | 0.61 | 0.56 | 0.79 | 12.83 | 33.41 | 29.59 |
| VAR | 760.86 | 45.96 | 54.57 | 38.11 | 0.10 | 16.96 | 466.89 | 466.89 | 2004.27 | 2664.70 | 116.83 | 268.56 | 0.12 | 81.27 | 0.38 | 0.32 | 0.62 | 164.52 | 1115.90 | 875.51 |
| SKEWNESS | 1.00 | 0.36 | 0.37 | -0.12 | 0.48 | 0.22 | 0.63 | 0.63 | 0.42 | 0.01 | -0.15 | 0.45 | -0.23 | -0.05 | 0.02 | -0.18 | 0.11 | 0.50 | 0.51 | 0.52 |
| KURTOSIS | -0.62 | -1.25 | -1.56 | -1.29 | -0.94 | -1.38 | -1.29 | -1.29 | -1.02 | -1.69 | -1.21 | -0.97 | 0.35 | -0.65 | -1.10 | -0.79 | -1.07 | -0.55 | -1.52 | 0.64 |
| CV% | 33.68 | 40.22 | 50.73 | 24.74 | 34.07 | 19.52 | 23.26 | 18.16 | 41.78 | 39.91 | 12.40 | 71.98 | 14.51 | 31.82 | 37.46 | 30.75 | 16.06 | 64.07 | 95.23 | -0.74 |
| S.E | 7.62 | 1.87 | 2.04 | 1.71 | 0.09 | 1.14 | 5.97 | 5.97 | 12.37 | 14.27 | 2.99 | 4.53 | 0.09 | 3.27 | 2.15 | 1.71 | 0.05 | 3.55 | 9.23 | 1.23 |
Table 2: Mean performance of the parental genotypes in field conditions. Plant height (PH) in cm, number of tillers (NT), number of productive tillers (PRT), leaf length (LL) in cm, leaf width (LW) in mm, panicle length (PL) in cm, days to first flowering (DFF), days to maturity(DM), filled grains per panicle (FGP), total grains per panicle (TGP), spikelet fertility (SPF), spikelet sterility (SPS), 100 grain weight (100GW), single plant yield (SPY), lesion number(LN), infested leaf area (ILA), potential disease incidence percentage (PDI%), grain length (GL), grain breadth (GB),length-breadth ratio (LBR).

Figure 2: Dendrogram of parental genotypes by cluster analysis.
Cluster analysis based on SSR marker data on parental genotypes revealed that four susceptible genotype (ADT 43, Improved White Ponni, BPT 5204 and CO39) and moderately resistant genotypes (C101PKT, CO39 CIRAD, C101A51 and Tetep) were grouped into cluster I. Three other blast-resistant genotypes (Moroborekan, C101 LAC, and TORIDE1) were grouped into cluster II, and Cluster III had only one genotype, CT 13432-3R which is highly resistant with four pyramided Pi genes. The susceptible and resistant genotypes exhibited polymorphic alleles for Pi gene linked SSR markers. Efficiency of detecting blast-resistance gene depended on genotypes and genelinked markers. These results indicated scope for utilization of blastresistant genotypes with detected gene-linked markers in markerassisted selection. CO 39 NILs were screened for blast resistance using SSR markers linked to 14 Pi genes and obtained similar results [15]. Advanced backcross population consisting of 80 BC3F3 lines derived from rice vars. Vandana/Moroborekan were genotyped for blast resistance with 50 candidate genes and 23 SSR markers and cluster analysis was carried out [22]. Similarly eight genotypes of rice were studied for genetic analysis with 85 gene linked SSR markers for rice blast resistance and relatedness among eight genotypes were examined through clustering analysis [23].
Estimation of variability parameters
The values of variability parameters like genotypic variance (GV), phenotypic variance (PV), genotypic coefficient of variation (GCV), phenotypic coefficient of variation (PCV), heritability (h2) and genetic advance as per cent of mean for plant height, number of tillers, productive tillers, leaf length, leaf width, panicle length, days to first flowering, days to maturity, filled grains per panicle, total grains per panicle, spikelet fertility, 100 grain weight, single plant yield, lesion number, infected leaf area, potential disease incidence percentage, leaf blast and lesion type pertaining to different segregating populations of the cross ADT 43 × CT13432-3R are presented in Tables 3 and 4. The co-efficient of variations at genotypic (GCV per cent) and phenotypic level (PCV per cent) calculated for the morphological characters observed in various segregating generations are presented in Table 4. In general, the PCV was higher than the corresponding GCV for all the traits under study. The percentage of GCV was less than 20 per cent (low variability) for plant height, leaf length, leaf width, panicle length, days to 50 per cent flowering days to maturity, spikelet fertility, 100 grain weight, single plant yield; 20 to 25 per cent (medium variability) for number of tillers and productive number of tillers; above 25 per cent (high variability) for grains per panicle, lesion number, infected leaf area, potential disease percentage, leaf blast and lesion type.
| PH | NT | PRT | LL | LW | PL | DFF | DM | FGP | TGP | SPF | SPS | 100GW | SPY | LN | ILA | PDI% | LB | LT | ||
|---|---|---|---|---|---|---|---|---|---|---|---|---|---|---|---|---|---|---|---|---|
| Mean | F2 | 78.96 | 24.89 | 21.78 | 27.67 | - | 20.49 | - | - | 119.64 | 143.91 | 83.26 | 16.74 | - | - | - | - | - | - | |
| F3 | 79.94 | 15.31 | 11.29 | 26.06 | 0.89 | 22.28 | 89.71 | 114.71 | 128.64 | 143.16 | 90.72 | 10.82 | 2.10 | 25.00 | 31.60 | 45.82 | 78.52 | 7.07 | 6.51 | |
| B1 | 78.99 | 25.56 | 22.89 | 26.87 | - | 20.53 | - | - | 190.13 | 207.56 | 91.70 | 9.62 | 1.82 | 22.06 | - | - | - | - | ||
| B2 | 78.36 | 24.96 | 22.02 | 27.73 | - | 20.67 | - | - | 190.13 | 207.56 | 91.70 | 9.62 | 1.82 | - | 13.13 | 23.27 | 29.14 | 2.62 | 3.13 | |
| B3 | 63.02 | 27.78 | 27.67 | 25.78 | 0.90 | 18.09 | 95.18 | 120.18 | 120.84 | 136.64 | 88.22 | 11.78 | 1.57 | 46.25 | - | - | - | - | - | |
| SD | F2 | 8.23 | 5.78 | 5.61 | 3.83 | - | 2.40 | - | - | 27.43 | 30.36 | 8.54 | 8.54 | - | - | - | - | - | - | - |
| F3 | 8.74 | 3.97 | 3.27 | 4.26 | 0.19 | 2.46 | 1.89 | 1.89 | 42.73 | 51.57 | 6.36 | 8.60 | 0.29 | 10.51 | 11.70 | 31.48 | 24.89 | 2.24 | 2.30 | |
| B1 | 8.38 | 6.33 | 6.10 | 3.75 | - | 2.34 | - | - | 54.72 | 58.58 | 6.22 | 8.67 | 0.25 | 10.22 | - | - | - | - | - | |
| B2 | 8.33 | 5.80 | 5.50 | 3.80 | - | 2.41 | - | - | 54.72 | 58.58 | 6.22 | 8.67 | 0.25 | - | 10.05 | 21.40 | 19.29 | 1.74 | 2.11 | |
| B3 | 7.93 | 11.06 | 10.96 | 4.21 | 0.13 | 2.26 | 1.86 | 1.86 | 34.70 | 35.66 | 7.27 | 7.27 | 0.18 | 21.13 | - | - | - | - | - | |
| VAR | F2 | 67.70 | 33.46 | 31.45 | 14.68 | - | 5.76 | - | - | 752.64 | 921.76 | 72.94 | 72.94 | - | - | - | - | - | - | - |
| F3 | 76.40 | 15.76 | 10.66 | 18.17 | 0.03 | 6.07 | 3.57 | 3.57 | 1825.60 | 2659.54 | 40.45 | 74.00 | 0.08 | 110.43 | 136.79 | 991.10 | 619.53 | 5.02 | 5.30 | |
| B1 | 70.24 | 40.07 | 37.24 | 14.07 | - | 5.48 | - | - | 2993.98 | 3431.34 | 38.69 | 75.11 | 0.06 | 104.55 | - | - | - | - | - | |
| B2 | 69.42 | 33.68 | 30.25 | 14.43 | - | 5.82 | - | - | 2993.98 | 3431.34 | 38.69 | 75.11 | 0.06 | - | 101.07 | 458.11 | 371.99 | 3.01 | 4.44 | |
| B3 | 62.96 | 122.36 | 120.14 | 17.72 | 0.02 | 5.13 | 3.47 | 3.47 | 1204.18 | 1271.73 | 52.88 | 52.88 | 0.03 | 446.66 | - | - | - | - | - | |
| %CV | F2 | 10.42 | 23.22 | 25.76 | 13.84 | 11.71 | - | - | 22.93 | 21.10 | 10.26 | 51.02 | - | - | - | - | - | - | - | |
| F3 | 10.93 | 25.93 | 28.96 | 16.35 | 21.35 | 11.04 | 2.11 | 1.65 | 33.22 | 36.02 | 7.01 | 79.48 | 13.81 | 42.04 | 37.03 | 68.70 | 31.70 | 31.68 | 35.33 | |
| B1 | 10.61 | 24.77 | 26.65 | 13.96 | 11.40 | - | - | 28.78 | 28.22 | 6.78 | 90.12 | 13.74 | 46.33 | - | - | - | - | - | ||
| B2 | 10.63 | 23.24 | 24.98 | 13.70 | 11.66 | - | - | 28.78 | 28.22 | 6.78 | 90.12 | 13.74 | - | 76.54 | 91.96 | 66.20 | 66.41 | 67.41 | ||
| B3 | 12.58 | 39.81 | 39.61 | 16.33 | 14.44 | 12.49 | 1.95 | 1.55 | 28.72 | 26.10 | 8.24 | 61.71 | 11.46 | 45.69 | - | - | - | - | - | |
Table 3: Variability parameters in Segregating generations for different quantitative traits. Plant height (PH) in cm, number of tillers (NT), number of productive tillers (PRT), leaf length (LL) in cm, leaf width (LW) in mm, panicle length (PL) in cm, days to first flowering (DFF), days to maturity(DM), filled grains per panicle (FGP), total grains per panicle (TGP), spikelet fertility (SPF), spikelet sterility (SPS), 100 grain weight (100GW), single plant yield (SPY), lesion number(LN), infested leaf area (ILA), potential disease incidence percentage (PDI%), leaf blast (LB), lesion type (LT).
| PH | NT | PRT | LL | LW | PL | DFF | DM | FGP | TGP | SPF | SPS | 100GW | SPY | LN | ILA | PDI% | LB | LT | ||
|---|---|---|---|---|---|---|---|---|---|---|---|---|---|---|---|---|---|---|---|---|
| PCV | F2 | 10.42 | 23.24 | 25.75 | 13.85 | - | 11.71 | - | - | 22.93 | 21.10 | 10.26 | 51.03 | - | - | - | - | - | - | - |
| F3 | 10.93 | 25.93 | 28.93 | 16.35 | 20.86 | 11.06 | 2.11 | 1.65 | 33.21 | 36.02 | 7.01 | 79.54 | 13.74 | 42.03 | 37.01 | 68.70 | 31.70 | 31.70 | 35.36 | |
| B1 | 10.61 | 24.77 | 26.66 | 13.96 | - | 11.40 | - | - | 28.78 | 28.22 | 6.78 | 90.05 | 13.95 | 46.35 | - | - | - | - | - | |
| B2 | 10.63 | 23.26 | 24.97 | 13.70 | - | 11.67 | - | - | 28.78 | 28.22 | 6.78 | 90.05 | 13.95 | - | 76.55 | 91.99 | 66.20 | 66.20 | 67.22 | |
| B3 | 12.59 | 39.82 | 39.62 | 16.33 | 14.08 | 12.52 | 1.96 | 1.55 | 28.72 | 26.10 | 8.24 | 61.71 | 11.13 | 45.69 | - | - | - | - | - | |
| GCV | F2 | 10.22 | 21.90 | 24.30 | 9.86 | - | 4.49 | - | - | 22.69 | 20.06 | 8.99 | 44.75 | - | - | - | - | - | - | - |
| F3 | 10.75 | 22.63 | 23.81 | 12.68 | 19.10 | 4.84 | 1.94 | 1.59 | 33.07 | 35.42 | 5.36 | 69.90 | 12.49 | 15.51 | 32.08 | 68.22 | 29.61 | 29.61 | 32.00 | |
| B1 | 10.41 | 23.58 | 25.40 | 9.73 | - | 3.69 | - | - | 28.70 | 27.86 | 5.10 | 79.31 | 12.29 | 13.71 | - | - | - | - | - | |
| B2 | 10.43 | 21.92 | 23.51 | 9.67 | - | 4.62 | - | - | 28.70 | 27.86 | 5.10 | 79.31 | 12.29 | 62.36 | 90.58 | 58.75 | 58.75 | 59.51 | ||
| B3 | 12.33 | 39.21 | 39.05 | 12.56 | 11.37 | 2.59 | 1.79 | 1.49 | 28.53 | 25.17 | 6.80 | 50.94 | 8.09 | 40.52 | - | - | - | - | - | |
| h2 | F2 | 96.22 | 88.76 | 89.06 | 50.69 | - | 14.73 | - | - | 97.91 | 90.38 | 76.91 | 76.91 | - | - | - | - | - | - | - |
| F3 | 96.65 | 76.15 | 67.74 | 60.15 | 83.87 | 19.15 | 84.33 | 93.28 | 99.14 | 96.67 | 58.36 | 77.24 | 82.58 | 13.62 | 75.14 | 98.59 | 87.25 | 87.25 | 81.89 | |
| B1 | 96.36 | 90.62 | 90.76 | 48.55 | - | 10.47 | - | - | 99.47 | 97.42 | 56.46 | 77.58 | 77.59 | 8.75 | - | - | - | - | - | |
| B2 | 96.31 | 88.84 | 88.63 | 49.82 | - | 15.64 | - | - | 99.47 | 97.42 | 56.46 | 77.58 | 77.59 | 66.36 | 96.94 | 78.76 | 78.76 | 78.36 | ||
| B3 | 95.93 | 96.93 | 97.14 | 59.15 | 65.28 | 4.30 | 83.85 | 93.08 | 98.69 | 93.03 | 68.15 | 68.15 | 52.87 | 78.64 | - | - | - | - | - | |
| GA | F2 | 2.51 | 10.58 | 2.50 | 1.71 | - | 0.45 | - | - | 4.02 | 5.71 | 3.21 | 3.21 | - | - | - | - | - | - | - |
| F3 | 2.52 | 6.23 | 1.90 | 2.03 | 0.47 | 0.59 | 1.50 | 1.35 | 4.07 | 6.11 | 2.44 | 3.22 | 0.59 | 0.88 | 3.74 | 3.93 | 5.36 | 1.61 | 1.67 | |
| B1 | 2.51 | 11.82 | 2.55 | 1.64 | - | 0.32 | - | - | 4.08 | 6.16 | 2.36 | 3.24 | 0.55 | 0.56 | - | - | - | - | - | |
| B2 | 2.51 | 10.62 | 2.49 | 1.68 | - | 0.48 | - | - | 4.08 | 6.16 | 2.36 | 3.24 | 0.55 | 3.30 | 3.86 | 4.84 | 1.45 | 1.60 | ||
| B3 | 2.50 | 22.09 | 2.73 | 2.00 | 0.37 | 0.13 | 1.49 | 1.34 | 4.05 | 5.88 | 2.84 | 2.84 | 0.38 | 5.06 | - | - | - | - | - | |
| GA(%) | F2 | 3.18 | 42.50 | 11.47 | 6.19 | - | 2.20 | - | - | 3.36 | 3.97 | 3.85 | 19.18 | - | - | - | - | - | - | - |
| F3 | 3.15 | 40.68 | 16.84 | 7.80 | 52.91 | 2.64 | 1.68 | 1.17 | 3.16 | 4.27 | 2.68 | 29.80 | 28.13 | 3.51 | 11.83 | 8.57 | 6.82 | 22.75 | 25.65 | |
| B1 | 3.18 | 46.24 | 11.12 | 6.11 | - | 1.56 | - | - | 2.15 | 2.97 | 2.57 | 33.64 | 30.44 | 2.55 | - | - | - | - | - | |
| B2 | 3.20 | 42.56 | 11.29 | 6.07 | - | 2.32 | - | - | 2.15 | 2.97 | 2.57 | 33.64 | 30.44 | 25.13 | 16.60 | 16.60 | 55.34 | 50.99 | ||
| B3 | 3.97 | 79.51 | 9.85 | 7.75 | 40.78 | 0.73 | 1.57 | 1.12 | 3.35 | 4.30 | 3.22 | 24.13 | 23.99 | 10.95 | - | - | - | - | - |
Table 4: Heritability and GA in segregating generation for different quantitative traits. Plant height (PH) in cm, number of tillers (NT), number of productive tillers (PRT), leaf length (LL) in cm, leaf width (LW) in mm, panicle length (PL) in cm, days to first flowering (DFF), days to maturity(DM), filled grains per panicle (FGP), total grains per panicle (TGP), spikelet fertility (SPF), spikelet sterility (SPS), 100 grain weight (100GW), single plant yield (SPY), lesion number(LN), infested leaf area (ILA), potential disease incidence percentage (PDI%), leaf blast (LB), lesion type (LT).
Selection of parents is one of the most important steps in any breeding program and will helps to extract good cultivars if the parents used in the program were suitable. Therefore, emphasis was given to choose appropriate parents in order to obtain useful segregants. Inclusion of at least one agronomically superior, locally adapted, popular cultivar as parent (ADT 43) in the breeding programme will largely help to ensure the recovery of a high proportion of progenies with adaptation and quality that were acceptable to farmers. The variability in parental genotypes was studied for different morpho-agronomic as well as resistance traits. Mean, standard deviation and variance values for all the traits under study were exhibited less difference in the segregating generations of the cross ADT 43 × CT13432-3R (F2, F3, BC1F1 and BC2F1). But in BC3F1 a reduction in mean plant height, leaf length, panicle length, total grain per panicle and 100 grain weight was observed. Similarly, there was an increase in single plant yield, number of tillers and productive tillers which indicate the maximum restoration of the desirable parent in the third backcross generation as the population mean was more towards the recurrent parent ADT 43 compared to previous generations.
In the segregating generations of the cross ADT 43/ CT13432- 3R, co-efficient of variations, PCV and GCV were classified following the low, moderate and high scale [18]. In the segregating populations variability for plant height, panicle length, spikelet fertility and 100 grain weight was low as it was evident from low GCV and high variability was exhibited by filled grains per panicle, spikelet sterility and disease parameters like lesion number infested leaf area, potential disease incidence per cent, leaf blast and lesion type. All other characters have shown an intermediate genotypic component of variation. The disease resistance traits showed high variability in segregating generations as the parents were selected based on the diversity in disease response. The high GCV gives an indication of justifiable variability among the genotypes with respect to these characters and therefore gives scope for improvement through selection. In general, the PCV was higher than the corresponding GCV for all the traits under study (Figure 3). The minor variation between values of GCV and PCV shows the limited role of environment in these characters and the heritability was very high for these traits. Selection for improvement of such characters will be rewarding in this situation. Similar results were reported by Bisne et al. [24-27] in rice.

Figure 3: Genotypic and phenotypic components of variance for yield and resistance traits in BC3 generation.
Estimation of heritability (h2) and genetic advance
Broad sense heritability was estimated for different traits and computed across five generations (Table 4). The trait such as plant height, number of tillers, days to 50 per cent flowering, number of grains per panicle, spikelet fertility per cent and 100 grain weight had high heritability (h2) values in all the segregating generations. The blast scoring traits viz., lesion number, infected leaf area, potential disease percentage, leaf blast and lesion type also recorded the high h2 values of 75.14, 98.59, 87.25, 87.25 and 81.89 respectively, under stress condition. Other traits such as leaf length and leaf width have medium heritability and panicle length was having low heritability (14.73) values. Among those traits single plant yield recorded low h2 values of 13.62 and 8.75 in F3 and BC1F1 respectively but high heritability was recorded in (78.64) BC3F1 generation. Genetic advance was higher in case of number of tillers (10.58) and all other traits exhibited lower genetic advance value. Genetic gain or genetic advance per cent value was highest for number of tillers (42.50) and leaf width (52.91); medium value was exhibited by number of productive tillers (11.47), spikelet sterility (19.18), 100 grain weight (28.13), lesion number (11.83), leaf blast (22.75) and lesion type (25.65) and all other traits were recorded a lower genetic gain of less than 10 per cent. The heritability percentage was categorized [28]. The genetic advance as per cent of mean was categorized as low, moderate or high [17]. High heritability coupled with low genetic advance was found in all characters in the segregating generations except single plant yield and panicle length. This is the indication of predominance of epistasis and dominant gene action. The traits like number of tillers, spikelet sterility, 100 grain weight, and leaf blast and lesion type recorded simultaneous higher heritability and genetic gain compared to other traits and could be further improved through individual line selection (Figure 4). Frequency distribution curve of different agronomic yield and resistance traits were made in segregating generations with the normal distribution and given in the Figure 4. Similarly high heritability for most of the yield contributing traits was reported in rice [25,27,29,30].

Figure 4: Heritability and genetic advance in percentage for yield and resistance traits in BC3 generation.
Conclusion
Clustering of the parental genotypes on morphological traits on yield parameters grouped the major parents under study ADT 43 and CT13432-3R into same cluster but came under different clusters when grouped based on leaf blast score and molecular marker data generated using polymorphic SSR markers. In the segregating populations high variability was exhibited by filled grains per panicle, spikelet sterility and disease parameters like lesion number, infested leaf area, potential disease incidence percent, and leaf blast and lesion type. In general, the PCV was higher than the corresponding GCV for all the traits under study. Traits like number of tillers, spikelet sterility, 100 grain weight, leaf blast and lesion type recorded simultaneous higher heritability and genetic gain compared to other traits indicating the predominance of epistasis and dominant gene action.
Selection of genetically divergent parents and clear understanding of genetics of the selected traits have brought forth gene introgressed lines in adapted genetic background. Any marker assisted breeding programme has to be initiated with a detailed phenotypic and genotypic study of parental genotypes. It is essential to understand the behaviour of reported markers in the novel genetic background of the parents for a successful breeding programme for varietal development. It is also important to understand the genetics of the traits involved and their interactions in advanced segregating generations for the simultaneous improvement of various traits in an existing variety. In this study both the phenotypic and genotypic information was equally employed for the development of a high yielding blast resistant variety with better adaptability and acceptability.
Acknowledgments
We acknowledge Dr. D. Tharreau, CIRAD, France for providing pyramided donor line, CT13432-3R for this research work. First author thanks Indian council of agriculture research (ICAR) for Senior Research Fellowship awarded for her PhD work. We thank Centre for Plant Molecular Biology and Biotechnology, Centre for Plant Protection Studies (CPPS) and Hybrid rice Evaluation Centre, Gudalur, TNAU for providing facilities to support this work.
Conflict of Interest
Authors declare no conflict of Interest.
References
- Koide Y, Kobayashi N, Xu D, Fukuta Y (2009) Resistance Genes and Selection DNA Markers for Blast Disease in Rice (Oryza sativa L.). Japan Agriculture Research 43: 255-280.
- Koizumi S (2007) Durability of resistance to rice blast disease. JIRCAS Working Report. 53: 1-10.
- Sharma TR, Gupta SK, Vijayan J, Devanna BN, Ray S (2012) Review: Rice Blast Management Through Host-Plant Resistance: Retrospect and Prospects. Agriculture Research 1: 37-52.
- Temnykh S, Park WD, Ayers N, Cartinhour S (2000) Mapping and genome organization of microsatellite sequences in rice (Oryza sativa L.). Theoretical Applied Genetics 100: 697-712.
- Gao LZ, Zhang CH, Chang LP, Jia JZ, Qiu ZE, et al. (2005) Microsatellite diversity within Oryza sativa with emphasis on indica-japonica divergence. Genet Res 85: 1-14.
- Zhang H, Sun J, Wang M, Liao D, Zeng Y, et al. (2007) Genetic structure and phylogeography of rice landraces in Yunnan, China, revealed by SSR. Genome 50: 72-83.
- Thomson MJ, Polato NR, Prasetiyono J, Trijatmiko KR, Silitonga TS, et al. (2009) Genetic diversity of isolated populations of Indonesian landraces of rice (Oryza sativa L.) collected in East Kalimantan on the island of Borneo. Rice 2: 80-92.
- Wang XQ, Kwon SW, Park YJ (2013) Evaluation of genetic diversity and linkage disequilibrium in Korean-bred rice varieties using SSR markers. Electronic Journal of Biotechnology. 16: 1-20.
- Brondani C, Caldeira KS, Borba TCO, Rangel PN, Morais OP, et al. (2006) Genetic variability analysis of elite upland rice genotypes with SSR markers. Crop Breeding and Applied Biotechnology 6: 9-17.
- Moukoumbi YD, Sie M, Vodouhe R, Bonou W, Toulou B, et al. (2011) Screening of rice varieties for their weed competitiveness. African Journal of Agricultural Research 6: 5446-5456.
- Bhadru D, Tirumala RV, Chandra MY, Bharathi D (2012) Genetic variability and diversity studies in yield and its component traits in rice (Oryza Sativa L.) Society for the Advancement of Breeding Researches in Asia and Oceania. Journal of Breeding and Genetics 44: 129-137.
- Behera L, Mohanty S, Pradhan SK, Singh S, Singh ON, et al. (2013) Assessment of genetic diversity of rainfed lowland rice genotypes using microsatellite markers. Indian Journal of Genetics 73: 142-152.
- Das B, Sengupta S, Parida SK, Roy B, Ghosh M, et al. (2013) Genetic diversity and population structure of rice landraces from Eastern and North Eastern States of India. BMC Genet 14: 71.
- Divya B, Robin S, Rabindran R, Senthil S, Raveendran M, et al. (2014)Marker assisted backcross breeding approach to improve blast resistance in Indian rice (Oryza sativa) variety ADT43. Euphytica 200: 1-17.
- Yanoria TMJ, Koide Y, Fukuta Y, Imbe T, Tsunematsu H, et al. (2011) A set of near-isogenic lines of Indica-type rice variety CO 39 as differential varieties for blast resistance. Molecular Breeding 27: 357-373.
- Rohlf FJ (2002) NTSYS-pc: Numerical taxonomy and multivariate analysis system. Setauket, NY: Exeter Software.
- Johanson HW, Robinson HF, Comstock RE (1955) Genotypic and genotypic correlations in soybean and their implications in selection. Agronomy Journal 47: 314-318.
- Subramanian S, Menon MP (1973) Genotypic and phenotypic variability in rice. Madras Agricultural Journal 60: 1093-1096.
- Kumar V, Sharma S, Sharma KA, Sharma S, Bhat KV (2009) Comparative analysis of diversity based on morphoagronomic traits and microsatellite markers in common bean. Euphytica 170: 249-262.
- Selvaraj CI, Nagarajan P, Thiyagarajan K, Bharathi M, Rabindran R (2011) Genetic parameters of variability, correlation and path coefficient studies for grain yield and other yield Attributes among rice blast disease resistant genotypes of rice (Oryza sativa L.). African Journal of Biotechnology 10: 3322-3334.
- Gowda SJM, Randhawa GJ, Bisht IS, Firke PK, Singh AK, et al. (2012) Morpho-agronomic and simple sequence repeat-based diversity in colored rice (Oryza sativa L.) germplasm from peninsular India. Genetics Resources and Crop Evolution 59: 179-189.
- Wu JL, Sinha PK, Variar M, Zheng KL, Leach JE, et al. (2004) Association between molecular markers and blast resistance in an advanced backcross population of rice. TheorAppl Genet 108: 1024-1032.
- GirijaRani MG, Adilakshmi D (2011) Genetic analysis of blast resistance in rice with simple sequence repeats (SSR). Journal of Crop Improvement 25: 232-238.
- Bisne R, Sarawgi AK, Verulkar SB (2009) Study of heritability, genetic advance and variability for yield contributing characters in rice. Bangladesh Journal of Agriculture Research 34: 175-179.
- Laxuman P, Salimath PM, Shashidhar HE, Mohankumar HD, Patil SS, et al. (2010) Analysis of genetics variability in interspecific backcross inbred lines in rice (Oryza sativa L.). Karnataka Journal of Agricultural Science 23: 563-565.
- Anandrao SD, Singh CM, Suresh BG, Lavanya GR (2011) Evaluation of rice hybrids for yield and yield component characters under North East Plain Zone. The Allahabad Farmer 67: 63-68.
- Prajapati M, Singh CM, Suresh BG, Lavanya GR, Jadhav P (2011) Genetic parameters for grain yield and its component characters in rice. Electronic Journal of Plant Breeding 2: 235-238.
- Robinson HF, Comstock RE, Harvey PH (1949) Estimates of heritability and degree of dominance in Corn. Agronomy Journal 41: 353-359.
- Seyoum M, Sentayehu A and K assahun B (2012) Genetic variability, heritability, correlation coefficient and path analysis for yield and yield related traits in upland rice. Journal of plant science 7: 13-22.
- Kumar A, Gupta S, Pandey A, Pattanayak A, Ngachan SV (2014) Studies on Aluminium Tolerance and Morphological Traits in Rice Lines from North Eastern India. ProcNatlAcadSci India Sect B BiolSci 86: 71-81.
Relevant Topics
- Basmati Rice
- Drought Tolerence
- Golden Rice
- Leaf Diseases
- Long Grain Rice
- Par Boiled Rice
- Raw Rice
- Rice
- Rice and Aquaculture
- Rice and Nutrition
- Rice Blast
- Rice Bran
- Rice Diseases
- Rice Economics
- Rice Genome
- Rice husk
- Rice production
- Rice research
- Rice Yield
- Sticky Rice
- Stress Resistant Rice
- Unpolished Rice
- White Rice
Recommended Journals
Article Tools
Article Usage
- Total views: 12918
- [From(publication date):
August-2016 - Apr 04, 2025] - Breakdown by view type
- HTML page views : 11849
- PDF downloads : 1069