Modelling Time to Death of Under-five Pneumonia Patients in Tercha General Hospital, Dawro Zone, South West Ethiopia
Received: 01-Aug-2019 / Accepted Date: 19-Feb-2020 / Published Date: 26-Feb-2020 DOI: 10.4172/2161-0711.1000679
Abstract
Background: Pneumonia is the number one largest infectious cause of death in children worldwide and it kills about 2,500 children every day. It is most prevalent in South Asia and sub-Saharan Africa and it is a leading single disease killing under-five children in Ethiopia. The aim of this study was to examine the risk factors of time to death of under-five pneumonia patients.
Methods: Retrospective study was conducted from September 2016 up to August 2017 and included 281 underfive pneumonia patients. The Cox PH and parametric survival models (Weibull, log-logistic and lognormal) were used and compared for examining survival rate of pneumonia patients.
Results: From out of 281 participants in the study 16.73% were died and 83.27% were alive at the end of the study. Based on AIC value the Weibull model is selected as the good model to fit pneumonia dataset compared to candidate models. The results implied that Sex, residence, Season of Diagnosis, Comorbidity, Severe Acute Malnutrition (SAM), Patient refer status and Patient to Nurse Ratio (PNR) were major factors related to survival time of under-five pneumonia patients in these study.
Conclusion: The patients from urban and patients admitted to hospital when Patient Nurse Ratio (PNR) was small were prolong timing death of under-five pneumonia patients, while Spring and summer season, comorbidity and Severe Acute Malnutrition (SAM) were shorten timing of death of under- five pneumonia patients. The concerned body should work on these factors to decrease the death of under- five due to pneumonia.
Keywords: Pneumonia; Under-five; Parametric models; Risk factors
Abbreviations
AIDS: Acquired Immune Deficiency Syndrome; AFT: Accelerating Failure Time; CHERG: Child Health Epidemiology Reference Group; AIC: Akaikie Information Criteria; HIV: Human Immune Virus; JUSH: Jimma University Specialized Hospital; TGH: Tercha General Hospital; WHO: World Health Organization
Introduction
Pneumonia is an acute illness in which the alveolar air spaces of the lung become inflamed and filled with fluid. It is the single largest infectious cause of death in children worldwide and accounts for 16% of all deaths of children under five years old and also it affects children and families everywhere, but is most prevalent in South Asia and sub- Saharan Africa [1]. It can be caused by bacterial, viral, or parasitic infection as well as by noninfectious agents and Most severe cases of pneumonia are caused by bacteria, of which the most important are Streptococcus pneumonia (pneumococcus) and Haemophilus influenza [2].
The mortality rates of children under the age of five years in most developing countries ranges from 60 to 100 per 1000 live births, one fifth of these deaths are due to pneumonia [1].
According to estimates from the World Health Organization Pneumonia kills about 2,500 children every day and more than 150 million cases of pneumonia occur in children under-five in each year, of which 20 million cases require hospitalization [3]. Sub-Saharan Africa takes the lead in having half of its under-five deaths resulting from pneumonia compared to other regions. Also, regional disparities exist in the percentage of under-five deaths resulting from pneumonia with 5% of deaths occurring in developed regions and 17% of deaths in Sub-Saharan Africa [4].
In Ethiopia 88 in 1,000 children under age 5 die before their fifth birthday from those death Acute respiratory infection (ARI) and particularly pneumonia, accounts for 18% [5]. Pneumonia is the major killer of children under the age of five years than any other diseases known to affect children, more than the death shares of Acquired Immune Deficiency Syndrome (AIDS), Malaria and Measles combined [1]. In 2016 United Nations Children’s Fund (UNICEF) reported that there is 1 out of 6 childhood deaths were due to pneumonia globally in 2015. Nearly 50% of pneumonia deaths take place in only six densely populated and poorest countries: India, Nigeria, Democratic republic of Congo, Pakistan, Angola and Ethiopia.
In Ethiopia pneumonia is a leading single disease killing under-five aged children and it was estimated that 3,370,000 children encounter pneumonia annually which contributes to 20% of all causes of death killing over 40,000 under-five children every year [6].
Several studies have been conducted to identify important risk factors of under-five mortality due to Pneumonia. Many researchers used logistic regression and Multi-level logistic regression models to identify the risk factors of pneumonia [7,8]. These statistical methodologies are not capable to consider the survival time of the patients in the hospital and also Logistic regression does not account the censoring observations, that is, it does not hold for time-to-event data. It is necessary to use another model that explores the important risk factors of under-five child survival time due to pneumonia.
Therefore; Survival analysis is introduced in order to investigate the survival time of patients and to consider the censoring observations in the study. Kaplan Meier survival curves and log rank test were used to compare the survival experience of different category of patients, Cox PH model and Accelerating failure time (AFT) models were used to model data. The study use parametric survival models when the assumption of Cox-PH model should not be fulfilled. Parametric survival models are statistically more powerful than nonparametric or semi-parametric models [9].
A survival analysis helps us to understand the distribution of failure time which is often described by using Weibull, Log-logistic and lognormal distributions. This study is, therefore, aimed to investigate the survival time of under-five children hospitalized due to pneumonia observed at Tercha General hospital and identify risk factors associated with under-five children survival time due to pneumonia.
Methods
Study area and study design
The study was taken place in Dawro Zone Tercha General Hospital around 491 km away from Addis Ababa capital city of Ethiopia. The survival data used for this study was obtained from Tercha General Hospital. During the study period, the pediatric registration chart and the patient’s identification cards were used to select the variables in the study by trained clinicians. All under- five children registered due to pneumonia with full information in the specified time interval of study was included and patients less than one month was excluded from the study. The response variable in this study was the survival time (time to death) of under-five pneumonia patients measured in days from the date of admission until the date of patients’ death or discharge from hospital. The status variable is coded as 1 if an event occur (death) and 0 for censored in the given time interval. Explanatory variables considered in this study were listed below in Table 1 with their corresponding codes and those variables were selected based on the previous studies conducted at Hawassa city by [7], at Tanzania Lake Zone ’ s public hospitals by Kristina L and at Jimma university specialized hospital by Firaol [10].
| S.no | Variables | Coding for categorical variables | Description | |
|---|---|---|---|---|
| 1 | Sex | Female=0 | male=1 | Sex of children |
| 2 | Age | 1-11=0 | 36-47=3 | Age of children |
| 12-23=1 | 48-59=4 | |||
| 24-35=2 | ||||
| 3 | Residence | Rural=0 | Urban=1 | Residence of children |
| 4 | Season | Autumn=0 | Winter=1 | Season of Diagnosis |
| Spring=2 | Summer=3 | |||
| 5 | Co-morbidity | No=0 | Yes=1 | Co-morbidity (CAP complicated) |
| 6 | SAM | No=0 | Yes=1 | Sever Acute Malnutrition |
| 7 | Treatment types | Penicillin=0, Ampicillin=2 | Ceftriaxone=1, Combined=3 | Treatment types taken at time of Diagnosis |
| 8 | Patients refer | No=0 | Yes=1 | Patient refer status from other |
| 9 | weight | Weight of the children | ||
| 10 | Bed Occupancy Rate (BOR) | The percentage of official beds occupied by hospital Inpatients for a given period of time; | ||
| BOR= (Total length of hospital stay in a given month)∗ 30×Number of beds in that month | ||||
| 11 | Patient: Physician Ratio (PPhR) | Ratio of patient to physician counted in a given month; | ||
| PPhR=Number of patients admitted in a given month Number of physician on service in a given month | ||||
| 12 | Patient: Nurse Ratio (PNR) | Ratio of patient to nurse counted in a month | ||
| PNR=Number of patients admitted in a given month Number of nurse on service in a given month | ||||
* Length of Hospital stay is the number of calendar days from the days of patient admission to the day of discharged/died.
Table 1: Description of variables in the study.
Non-parametric survival method
The Kaplan-Meier (KM) estimator is the standard non-parametric estimator of the survival function S (t) proposed by Kaplan and Meier which is not based on the actual observed event and censoring times, but rather on the ordered in which events occur. Let ordered survival times are given by 0 ≤ t1≤ t2 ≤ tj ≤ ∞, then:
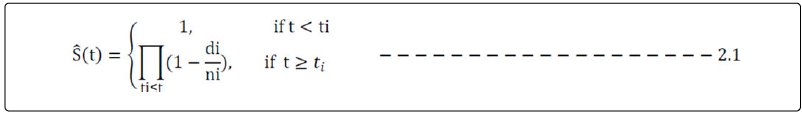
Where: di=number of under-five aged children with pneumonia died at ti
ni=number of under-five aged children with pneumonia at risk before ti
Cox PH regression model
The non-parametric method does not control for covariates and it requires categorical predictors. One of very popular model in survival data analysis is the Cox PH model which is introduced by Cox [11] and is a broadly applicable and the most widely used method of survival analysis. A model based on the exponential distribution may be parameterized as follows:
hi (, , β)=exp (α + β1Xi1 + β2Xi2 + ...... + βkXik)=exp (α) (βtX) − − − − − − − − − −2.2 In this case the constant α represents the log-baseline hazard since loghi (t)=α when all the x’s are zero. The Cox PH model is a semi-parametric model where the baseline hazard α (t) is allowed to vary with time.
hi (, , β)=h0 (t)exp (Xtβ) − − − − − − − − − − − − − − − − − − − − − − − − − −2.3
Where: h0 (t)is the baseline hazard function; Xi is a vector of covariates and β is a vector of parameters for fixed effects.
There different ways of checking the assumption of proportional hazard models from those the researcher used the graphical method which is scatter plots using the Schoenfeld residual [12] to verify that the model fit the data well or not. Under the proportional hazard assumption for the respective covariate, a scatter plot of Schoenfeld residuals against event times is expected to scatter in a nonsystematic way about the zero line, and the polygon (Lowess curve) connecting the values of the smoothed residuals should have a zero slope and cross the zero line several times [9]. If this plot shows some trend the assumption is violated.
Parametric survival models
The Cox proportional hazards model, by contrast, is not a fully parametric model. Rather it is a semi-parametric model because even if the regression parameters (the betas) are known, the distribution of the outcome remains unknown. The baseline survival (or hazard) function is not specified in a Cox model. A parametric survival model is one in which survival time (the outcome) is assumed to follow a known distribution. Many parametric models are acceleration failure time (AFT) models in which survival time is modeled as a function of predictor variables and the parametric survival models used in this studies are presented in Figure 1 [9].

Figure 1: Parametric distributions for the baseline hazards used in these studies.
Model assessment
Every step during model fitting uses the upcoming statistical procedures and later at the end the investigator checks all the assumptions needed for the model. In these study the Adequacy of Parametric Baselines and the Cox-Snell Residuals plots are used to check the goodness of fits.
Model comparison and selection
Akaikie informative criterion (AIC): Akaikie proposed as an informative criterion (AIC) statistic to compare classical models with different number of parameters is used to compare models in this study. For each model the value is computed as: AIC=−2loglikelihood + 2 (k + c), where: k is the number of parameters and c is the number of model specific distributional parameters. The preferable model is the one with the lowest value of the AIC [13].
Results
Descriptive statistics
Descriptive statistics is the beginning of any statistical analysis before proceeding to more complicated models. In this study, the total of 281 under-five pneumonia patients were considered. Among those patients 234 (83.27%) had been alive or censored and 47 (16.73%) were died at the end of study. Based on Table 2, out of 281 under-five pneumonia patients included in the study, 44.84% of the patients were females and 55.16% are males, the death proportion for female is 42.55% which is lower than that of male patients which is 57.45%. Considering age groups included in the study 49.82%, 22.06%, 11.39%, 10.32% and 6.41% of patients were from age group 1-11, 12-23, 24-35, 36-47 and 48-59 respectively and the death proportion for the age group were 44.68%, 23.40%, 14.89%, 10.64% and 6.38% respectively. Of the total patients 69.04% were from rural area and 30.96% from the urban. Death proportions of patients with residences were 72.34% and 27.66% respectively. Out of the total patients in the study, 28.83% were admitted in Autumn, 11.74% were admitted in Winter, 31.67% were admitted in Spring and 27.76% were admitted in Summer. The death proportions of patients in Autumn, Winter, Spring and Summer patients were 14.89%, 12.77%, 34.04% and 38.30% respectively.
| Status of Patient | ||||
|---|---|---|---|---|
| Variable | Category (codes) | Number of Event (%) | Number of Censored (%) | Total (%) |
| Sex | Female (0) | 20 (42.55%) | 106 (45.30%) | 126 (44.84%) |
| Male (1) | 27 (57.45%) | 128 (54.70%) | 155 (55.16%) | |
| Age | 1-11 (0) | 21 (44.68%) | 119 (50.85%) | 140 (49.82%) |
| 12-23 (1) | 11 (23.40%) | 51 (21.79%) | 62 (22.06%) | |
| 24-35 (2) | 7 (14.89%) | 25 (10.68%) | 32 (11.39%) | |
| 36-47 (3) | 5 (10.64%) | 24 (10.26%) | 29 (10.32%) | |
| 48-59 (4) | 3 (6.38%) | 15 (6.41%) | 18 (6.41%) | |
| Residence | Rural (0) | 34 (72.34%) | 160 (68.38%) | 194 (69.04%) |
| Urban (1) | 13 (27.66%) | 74 (31.62%) | 87 (30.96%) | |
| Season of Diagnosis | Autumn (0) | 7 (14.89%) | 74 (31.62%) | 81 (28.83%) |
| Winter (1) | 6 (12.77%) | 27 (11.54%) | 33 (11.74%) | |
| Spring (2) | 16 (34.04%) | 73 (31.20%) | 89 (31.67%) | |
| Summer (3) | 18 (38.30%) | 60 (25.64%) | 78 (27.76%) | |
| Co-morbidity | No (0) | 33 (70.21%) | 137 (58.55%) | 170 (60.50%) |
| Yes (1) | 14 (29.79%) | 97 (41.45%) | 111 (39.50%) | |
| Sever Acute Malnutrition (SAM) | No (0) | 30 (63.83%) | 195 (83.33%) | 225 (80.07%) |
| Yes (1) | 17 (36.17%) | 39 (16.67%) | 56 (19.93%) | |
| Treatment types taken by patients | Penicillin (0) | 8 (17.02%) | 45 (19.23%) | 53 (18.86%) |
| Ceftriaxone (1) | 9 (19.15%) | 36 (15.38%) | 45 (16.01%) | |
| Ampicillin (2) | 14 (29.79%) | 78 (33.33%) | 92 (32.74%) | |
| Combined (3) | 16 (34.04%) | 75 (32.05%) | 91 (32.38%) | |
| Patient refer status | No (0) | 40 (85.11%) | 172 (73.50%) | 212 (75.44%) |
| Yes (1) | 7 (14.89%) | 62 (26.50%) | 69 (24.56%) | |
| Continuous variables | Mean | Standard deviation | ||
| Weight of patient | 9.626 | 3.253 | ||
| BOR | 0.513 | 0.08 | ||
| PPhR | 13.9 | 2.764 | ||
| PNR | 3.42 | 1.13 | ||
Table 2: Descriptive summary of under-five pneumonia data in TGH (2016-2017).
Non-parametric survival analysis
Non-parametric methods in survival analysis is very important to visualize the survival time of patients under different groups of covariates; the Kaplan-Meier Estimate is used to compare the survival rates of two or more groups of under-five pneumonia patients. According to Figure 2, survival probability for patients who were come from urban had better survival time than those who were come from rural. The K-M survival time plot for sex in Figure 2, showed that female patients had better survival time than male patients.
Figure 2: K-M plot for sex and residence of under-five pneumonia patients.
Cox PH regression model analysis
In any data analysis it is always a great idea to do some univariable analysis before proceeding to more complicated models. Single covariate Cox proportional hazards model analysis is used to screen out potentially important variables before directly included in the multivariable analysis. The predictor’s such as sex, residence, season of diagnosis, comorbidity, severe acute malnutrition (SAM), patient refer status and patient nurse ratio (PNR) were passed the first filtration of variables for multiple covariates analysis. In the cox PH final model sex, residence, season of diagnosis, co- morbidity, severe acute malnutrition (SAM), patient refer status and patient nurse ratio (PNR) were significantly associated with survival time of under-five pneumonia patient.
Statistical test for proportional hazards model assumptions
Based on the Figure 3 Scaled Schoenfeld residual plots the assumption of cox PH model is not satisfied for two explanatory variables and is strengthened by the global test p-value which is less than 0.05. Therefore; the parametric survival models are used.

Figure 3: The plot of scaled schoenfeld residuals for season of diagnosis and PNR assumption.
Accelerated Failure Time model (AFT)
When Cox PH assumptions were not satisfied, alternatively parametric AFT models were used instead of the Cox PH model [9]. Therefore; For survival time of under-five pneumonia patients data, multivariable AFT models of Weibull, log-logistic and log-normal distribution were fitted by including all the covariates those are significant in the univariable analysis at 5% level of significance. To compare the efficiency of different models AIC is used.
A model having the minimum AIC and BIC value were selected as good model. Accordingly, from the Table 3 above Weibull AFT model has (AIC=334.128) which is selected as good model to fit survival time of under-five pneumonia data set. The final model results are shown in Table 3.
| Model types | Log-Likelihood | AIC | BIC |
|---|---|---|---|
| Weibull | -146.064 | 334.1282 | 324.8574 |
| Lognormal | -160.572 | 363.1433 | 335.6928 |
| Log-logistic | -149.943 | 341.8852 | 331.0583 |
AIC=Akaike Information criteria, BIC=Bayesian Information criteria
Table 3: Classical AFT models comparison.
According to the Table 4, under the Weibull AFT model, when the effect of other factor keep fixed, the estimated acceleration factor for male patient is estimated to be 0.878 with [95% CI: 0.782, 0.987]. The confidence interval for the acceleration factor did not include one and p- value is small (p=0.029). This indicates that male patients have less survival time than female patients or in the other way female patients survived 12.2% longer than male patients. The acceleration factors for patients whose residence was urban were estimated to be 1.158 with [95% CI: 1.010, 1.328]. The confidence interval for the acceleration factor did not include one and p- value is small (p=0.035). This indicates that patients whose residence was urban had prolonged survival time than patients from rural residence at 5% level of significance. Patients diagnosed at spring season and summer season acceleration factor were 0.845 and 0.813 with [95% CI: 0.720, 0.991 and 0.683, 0.966] respectively. The confidence intervals for both acceleration factor did not include one and p-values were small (p=0.003 and 0.001) respectively. Patients who were diagnosed at spring and summer season had less survival time than patients who was diagnosed at autumn season.
| Covariates | Categories | β | SE | z | sign | γ | [95% CI] 𝛾 |
|---|---|---|---|---|---|---|---|
| Sex | Female | Ref | ------- | ------- | ------- | ------- | ------- |
| Male | -0.13 | 0.06 | -2.18 | 0.029* | 0.878 | [0.782, 0.987] | |
| Residence | Rural | Ref | ------- | ------- | ------- | ------- | ------- |
| Urban | 0.147 | 0.07 | 2.11 | 0.035* | 1.158 | [1.010, 1.328] | |
| Season of Diagnosis | Autumn Winter Spring | Ref | ------- | ------- | ------- | ------- | ------- |
| Summer | -0.06 | -0.115 | -0.52 | -0.602 | -0.942 | ------- | |
| Spring | -0.169 | 0.088 | -2.07 | 0.003* | 0.845 | [0.751, 1.181] | |
| Summer | -0.207 | 0.088 | -2.35 | 0.001* | 0.813 | [0.720, 0.991] | |
| Co-Morbidity | No | Ref | ------- | ------- | ------- | ------- | ------- |
| Yes | -0.127 | 0.068 | -1.88 | 0.007* | 0.881 | [0.640, 0.916] | |
| SAM | No | Ref | ------- | ------- | ------- | ------- | ------- |
| Yes | -0.139 | 0.066 | -2.09 | 0.036* | 0.87 | [0.764, 0.901] | |
| Patient refer status | No | Ref | ------- | ------- | ------- | ------- | ------- |
| Yes | 0.174 | 0.07 | 2.48 | 0.013* | 1.19 | [1.038, 1.366] | |
| PNR | 0.091 | 0.037 | 2.44 | 0.015* | 1.095 | [1.018, 1.177] | |
| Intercept | 2.316 | 0.295 | 7.86 | 0.000* | [1.738, 2.893] | ||
Scale=0.189
γ Indicates Acceleration factor; *indicate: Significance at 5% level; 95%CI𝛾: 95% confidence interval for acceleration factor; SE: standard error for estimates; Ref: Reference
Table 4: Final multivariable analysis for classical weibull AFT model.
The acceleration factor for patients suffered co-morbidity were estimated to be 0.881 with [95% CI: 0.640, 0.916]. The confidence interval did not includes one and p-values is small (p=0.007). This implies that patients who were not suffered co-morbidity had longer survival time than patients who were suffered co-morbidity. Patients who were not suffered severe acute malnutrition (SAM) had longer survival time than patients who were suffered severe acute malnutrition (SAM). Acceleration factor for patient nurse ratio was estimated to be 1.095 with [95% CI: 1.018, 1.177]. The confidence interval did not include one and p-value is small (p=0.015). This indicates that patient nurse ratio had significant effect on the survival time of patients at 5% level of significance.
Model diagnostic
To check whether the fitted model adequately describes the data or not two graphical methods were used Adequacy of Parametric Baselines plot and Cox-Snell residual plot.
From Figures 4 and 5, the Weibull baseline distribution plot and Cox-Snell residual plot makes approximately the straight line through the origin than log-logistic and lognormal. So this plot suggests that Weibull AFT model is an appropriate model.

Figure 4: Weibull baseline distribution.

Figure 5: Cox-Snell residual plots for Weibull.
Discussion
The objective of this study was to identify the risk factors of mortality of under-five pneumonia patients in Tercha General Hospital. For determining the risk factors of the mortality of underfive pneumonia patients; a total of 281 patients were included in the study out of which 16.7% were died and this study is agree with study conducted at Bushulo Major Health Center that is 18.79% by Teka et al. [14] and with the Global, regional and national causes of child mortality report that is 14.1% by Liu et al. [15]. This study revealed that male patients were more exposed to pneumonia than female patients; this result is in line with other study conducted in JUSH by Firaol and in Pakistan by Christa [6] and also children in the age group 1-11 months were more exposed than other age groups and this study agrees with study conducted in Sidama Zone Wondo Genet District by Teshome [16], patients in the rural residence were more exposed than urban residence agrees with study conducted in JUSH by Firaol et al. [10] and in China by Feng et al. [17] and the prevalence of pneumonia in season of spring and summer were higher than other seasons and is in line with studies in Hawassa city by Tariku [7], in Malawi by Ellubey [18] and in Southern Israel by Lieberman.
In this study nonparametric methods, semi-parametric and parametric survival models are applied. None parametric method is used to compare the difference between each categorical covariate based on Kaplan-Meier estimation method. The semi-parametric survival analysis using Cox PH model was fitted and the assumptions were checked for each covariate and for overall model fitted, and assumptions were violated for Cox PH model. Then the researcher introduced an alternative model for Cox PH model which is parametric AFT survival model to fit the pneumonia data in TGH based by Kalbfleisch et al. [19]. The researcher used different types of the baseline distributions to fit AFT models for pneumonia dataset in TGH. The baseline distributions used in this study were Weibull, Lognormal and Log-logistic. The Weibull AFT model was selected as good AFT model than lognormal and log-logistic model based on comparison criteria with smaller AIC value [13]. Based on the Weibull AFT model the study showed that the survival time of under-five pneumonia patients was significantly and strongly associated with Sex of children, Residence of children, Season of Diagnosis patients were admitted to hospital, Comorbidity, Severe Acute Malnutrition (SAM), Patient refer status from other health center and Patient to Nurse ratio (PNR). The current study is consistent with other findings by Tariku [7].
The findings of this study was revealed that female patients and patients whose residence was urban had prolonged the timing death of pneumonia while male and patients whose residence was rural had shorten timing death of pneumonia, the study agrees with study conducted at Pakistan [6] and study conducted at JUSH and also with the report of Integrated community case management of childhood illness in Ethiopia [20]. In this study it was found that Patients who were admitted in summer and spring season have shorter survival time and had high risk of dying from CAP as compared with autumn and winter seasons; this result agrees with study conducted in Hawassa city by Tariku [7] and in southern Israel Hospital by Lieberman reported that there is high incidence of CAP during spring and summer seasons. The findings of this study also showed that the patients who were suffered comorbidity or any other disease had shorter survival time than patients without comorbidity and also patients suffered Severe acute malnutrition (SAM) had shorter survival time than that of patients without severe acute malnutrition (SAM) the studies that support this results were conducted in Pakistan by Duke et al. [21], in Malawi by Ellubey [18], in JUSH by Firaol, in southern Israel Hospital by Lieberman and the Child Health Epidemiology Reference Group (CHERG) report by Fischer. Patients who admitted during patients to nurse ratio (PNR) was high had high risk of dying from pneumonia and patients who admitted during ratio of patient to nurse is high has less chance to survive as it is compared to others patients the study agrees with study conducted at Hawassa city by Tariku [7] and in Europe by Andrea [22-25].
Conclusion
This study used survival time of under-five pneumonia patients’ dataset of those who were registered and treated from September, 2016-August, 2017 with the aim of investigating the survival rate of under-five pneumonia patients in Tercha General Hospital. Due to violation of Cox PH model assumptions; parametric AFT models were fitted. From different types of AFT models fitted using different baseline distributions, Weibull AFT model is selected as the good model based on the AIC value. The results of this study showed that sex, residence, season of diagnosis, comorbidity, severe acute malnutrition (SAM), patients refer status and patient nurse ratio (PNR) were found to be significant predictors for survival time of patients. Of which patients whose residence was urban is prolong timing death of pneumonia patients. Similarly male patients, season of diagnosis Spring and summer, patients with comorbidity and patients with severe acute malnutrition (SAM) were statistically significantly shorten timing of death of under-five pneumonia. All concerned body should work on awareness by giving health promotions on appropriate and effective treatment in home and early diagnosis to the community to reduce under-five pneumonia mortality. All stakeholders in the health center need to improve Health facilities in hospitals and should be handled with effective management. The researchers who interested to investigate on the same area are recommended to introduce frailty modeling to account the correlation in the cluster.
Acknowledgement
The Authors would like to acknowledge Jimma University and Mizan-tepi University for their sponsorship and financial support for these study and the Dawro zone department of Health staffs in TGH to undertake this study with their cooperation and permission in using the data with special thanks for Mr. Abashaw Ayele, Dr. Yonatan Fikadu and Dr. Tamirat Tekle for their willingness to help us.
Ethical Consideration
The Research Ethics Review Board of Jimma University has provided an ethical clearance for this study. The data was collected from Tercha General Hospital based on official letter written to the Hospital. The study conducted without individual informed consent because it relied on retrospective data.
Authors’ Contribution
Lema Abate conceived and designed the study, analyzed and interpreted data, and wrote the initial draft of the paper. Megersa Tadesse provided overall technical and academic guidance and reviewed the final paper for important intellectual content. Prof. Adiveppa. S. Kadi helped by reviewing the paper. All authors read and approved the final paper.
References
- Williams BG, Gouws E, Boschi-Pinto C, Bryce J, Dye C (2002) Estimates of world-wide distribution of child deaths from acute respiratory infections. Lancet Infect Dis 2: 25-32.
- Leung DT, Chisti MJ, Pavia AT (2016 ) Prevention and control of childhood pneumonia and diarrhoea. Pediatr Clin North Am 63: 67-79.
- Liu L, Oza S, Hogan D, Chu Y, Perin J, et al. (2016) Global, regional, and national causes of under-5 mortality in 2000–15: An updated systematic analysis with implications for the sustainable development goals. Lancet 388: 3027-3035.
- CSA (2012) Central statistical agency, addis ababa, Ethiopia. Measure DHS, ICF Macro Calverton, Maryland, USA. Ethiopia Demographic and Health Survey.
- Christa LFW (2013) Childhood pneumonia and diarrhoea: Global burden of childhood pneumonia and diarrhea. Lancet 381: 1405-1016.
- Tariku T (2017) Modelling under-five mortality among hospitalized pneumonia patients in Hawassa City: A cross-classified multilevel analysis. Ann Data Sci 5: 111-132.
- Crighton E, Elliott SJ, Moineddin R, Kanaroglou P, Upshur R ( 2007) A spatial analysis of the determinants of pneumonia and influenza hospitalizations in Ontario (1992-2001). Soc Sci Med 64: 1636-1650.
- Cilloniz C, Ewig S, Gabarrus A, Ferrer M, Puig de la Bella Casa J, et al. (2005) Seasonality of pathogens causing community-acquired pneumonia. Respirology 22: 778-785.
- Firaol B, Sinaga M, Quadri JA, Kumar A, Shariff A, et al. (2017). Factors associated with outcomes of severe pneumonia in children aged 2 months to 59 months at jimma university specialized hospital. Curr Pediat Res 21: 3.
- Cox D (1972) Regression models and life tables (with discussions). J Royal Statistical Soc 34: 187-220.
- Schoenfeld D ( 1982) partial residuals for the proportional hazard regression model. Biometrika 69: 238-241.
- Munda M, Rotolo F, Legrand C (2012) Parametric frailty models in R. J Ame Assoc 55: 1-21
- Teka Z, Taye A, Gizaw Z (2014) Analysis of risk factors for mortality of in-hospital pneumonia patients in Bushulo major health center, Hawassa, Southern Ethiopia. Sci J Public Health 2: 373-377.
- Li Liu, Johnson HL, Cousens S, Perin J, Scott S, et al. (2012) Global, regional, and national causes of child mortality: An updated systematic analysis for 2010 with time trends since 2000. Lancet 379: 2151-2161.
- Teshome A (2017) Prevalence of pneumonia and factors associated among children 2-59 months old in Wondo Genet district, SNNPR, Ethiopia. Curr Pediatr Res 21: 19-25.
- Feng X, Theodoratou E, Liu L, Chan KY, Hipgrave D, et al. (2012) Social, economic, political and health system and program determinants of child mortality reduction in China between 1990 and 2006: A systematic analysis. J Glob Health 2: 010405.
- Ellubey RM (2009) Pneumonia case fatality rate in children under-five: Understanding variations in district hospitals in Malawi. Duo Research Archive 1: 134-138.
- Kalbfleisch JD, Prentice RL (2002) The statistical analysis of failure time data. (2nd edn.) New York, Wiley.
- Miller NP, Amouzou A, Tafesse M, Hazel E, Legesse H, et al. (2014) Integrated community case management of common childhood illness in Ethiopia: Implementation strength and quality of care. Am J Trop Med Hyg 91: 424-434.
- Duke T, Poka H, Dale F, Michael A, Mgone J, et al. (2002) Chloramphenicol versus benzylpenicillin and gentamicin for the treatment of severe pneumonia in children in Papua New Guinea: A randomized trial. Lancet 359: 474-480.
- Andrea D (2017) The effect of nurse-to-patient ratios on nurse-sensitive patient outcomes in acute specialist units: A systematic review and meta-analysis. Eur J Cardiovasc Nurs 17: 6-22.
- Penyoyer D (2010) Nurse staffing and patient outcomes in critical care: A concise review. Crit Care Med 38: 1521-1528.
- Hakim IE, Uthman MA (2009) Squamous cell carcinoma and keratoa canthoma of the lower lip associated with “Goza†and “Shisha†smoking. Int J Dermatol 38: 108-110.
- Lugangira K, Kazaura M, Kalokola F (2017) Morbidity and mortality of children aged 2–59 months admitted in the Tanzania Lake Zone’s public hospitals: a cross-sectional study. BMC Res Notes 10: 1-4.
Citation: Abate M, Tadesse M, Kadi AS (2020) Modelling Time to Death of Under-five Pneumonia Patients in Tercha General Hospital, Dawro Zone, South West Ethiopia. J Community Med Health Educ 10: 679. DOI: 10.4172/2161-0711.1000679
Copyright: © 2020 Abate L, et al. This is an open-access article distributed under the terms of the Creative Commons Attribution License, which permits unrestricted use, distribution, and reproduction in any medium, provided the original author and source are credited.
Select your language of interest to view the total content in your interested language
Share This Article
Recommended Journals
Open Access Journals
Article Tools
Article Usage
- Total views: 3058
- [From(publication date): 0-2020 - Oct 18, 2025]
- Breakdown by view type
- HTML page views: 2127
- PDF downloads: 931