Research Article Open Access
Modelling Biogas Fermentation from Anaerobic Digestion: Potato Starch Processing Wastewater Treated Within an Up flow Anaerobic Sludge Blanket
Philip Antwi1*, Jianzheng Li1, En Shi1, Portia Opoku Boadi2 and Frederick Ayivi31State Key Laboratory of Urban Water Resource and Environment, School of Municipal and Environmental Engineering, Harbin Institute of Technology, 73 Huanghe Road, Harbin 150090, PR China
2School of Management, Harbin Institute of Technology, 92 West Dazhi Street, Nan Gang District, Harbin 150001, PR China
3Department of Geography, University of North Carolina, 237 Graham building, 1009 Spring Garden St, Greensboro, NC27412, USAX
- *Corresponding Author:
- Philip Antwi
State Key Laboratory of Urban Water Resource
and Environment, School of Municipal and Environmental
Engineering, Harbin Institute of Technology
73 Huanghe Road, Harbin 150090, PR China
Tel: +8645186283761
Fax: +8645186283761
E-mail: kobbyjean@yahoo.co.uk
Received Date: March 07, 2017 Accepted Date: March 16, 2017 Published Date: March 20, 2017
Citation: Antwi P, Li J, Shi E, Boadi PO, Ayivi F (2017) Modelling Biogas Fermentation from Anaerobic Digestion: Potato Starch Processing Wastewater Treated Within an Up flow Anaerobic Sludge Blanket. J Bioremediat Biodegrad 8: 388. doi: 10.4172/2155-6199.1000388
Copyright: © 2017 Antwi P, et al. This is an open-a ccess article distributed under the terms of the Creative Commons Attribution License, which permits unrestricted use, distribution, and reproduction in any medium, provided the original author and source are credited.
Visit for more related articles at Journal of Bioremediation & Biodegradation
Abstract
Herein, a modeling approach to predict biogas yield within a mesophilic (35 ± 1°C) upflow anaerobic sludge blanket (UASB) reactor treating potato starch processing wastewater (PSPW) for pollutant removal was conducted. HRTs and seven anaerobic process-related parameters viz; chemical oxygen demand (COD), ammonium (), alkalinity, total Kjeldahl Nitrogen, total phosphorus, volatile fatty acids (VFAs) and pH with average concentration of 4028.91, 110.09, 4944.67, 510.47, 45.20, 534.44 mg/L and 7.09, respectively, were used as input variables (x) to develop stochastic models for predicting biogas yield from the anaerobic digestion of PSPW. Based on the prediction accuracy of the models, it was established that, prediction of biogas yield from the UASB with the combination of COD, NH4+ and HRT, or COD, NH4+, HRT and VFAs as input variables proved more efficient as opposed to HRT, alkalinity, total Kjeldahl Nitrogen, total phosphorus and pH. Highest coefficient of determination (R2) observed was 97.29%, suggesting the efficiency of the models in making predictions. The developed models efficiencies concluded that the models could be employed to control the dynamic anaerobic process within UASBs since prediction of biogas obtained in the UASB agreed with the experimental result.
Keywords
Up flow anaerobic sludge blanket (UASB); Potato starch processing wastewater; Biogas yield; Modeling; Multiple non-linear regression
Introduction
Potato is one of the most valuable food crop grown in many countries [1]. It has been reported that, a considerable proportion of the potato cultivated globally consumed through starch processing which subsequently generates tons of wastewater that goes to pollute water bodies [1-3]. Wastewater of raw potato processed into starch are classified as complex wastewater [4,5], and its concentration of chemical oxygen demand (COD), total suspended solid (TSS) and volatile suspended solid of (VSS) can yield concentrations of 50000, 9700 and 9500 mg/L, respectively [6]. Arhoun et al. argued that recovering valuable resource such as bioenergy (biogas) from such wastewater to supplement energy needs will be beneficial to humans and society at large [6,7]. Anaerobic digestion has severally been reported as a successful bioprocess treating various organic wastewaters and subsequently generating biogas [7-12]. However, the biological mechanism of anaerobic digestion is not well understood due to the complexity of the bacterial community structure and bioconversion [13]. Hu et al. asserted that process modeling is a good tool for predicting and describing the performance of biological processes [13]. Other reports also confirmed that process modeling based on previously acquired data is one technical route to enhancing the performance of anaerobic processes. These process models are often developed [14,15]. Nonetheless, modeling of anaerobic digestion is quite challenging and tough because performance of anaerobic systems is complex and varies considerably with influent characteristics and operational conditions [16].
Some predictive models have been developed in the past decades for biogas estimation during anaerobic treatment processes. For instance, a regression analysis model for estimating biogas generated in a landfill leachate treatment process was developed by Akaya et al. using several leachate parameters [17]. In another study, Ozkaya et al. presented a neural network model for predicting the methane fraction in landfill gas originated from field-scale landfill bioreactors [18]. These models had provided more detail insight into the biological mechanism in anaerobic digestion [4].
Deterministic models also provide a good insight into the mechanism of biological relationships, but fluctuation of kinetic parameters and wastewater characteristics normally results in a laborious calibration, comprehensive computer analysis as well as laboratory work [14]. The International Water Association (IWA) Anaerobic Digestion Model No.1 (ADM1), a typical deterministic model, has been successfully used for modeling the whole anaerobic digestion process [19]. However, its mathematical complexity associated with extreme analytical difficulty of measuring kinetic parameters turns out to be laborious and time consuming [20,21]. On the other hand, stochastic based non-linear multiple regression model is preferably easy to handle as well as capable to estimate the relation between variables and numerical parameters [22,23]. The advantage of a regression based model compared to other models such as neural networks is its ability to write down relationships and to relate with underlying processes, whereas neural networks only produce an approximation that is opaque.
In this study, the evaluation, feasibility and efficiency of biogas production from anaerobic digestion of PSPW within an upflow anaerobic sludge blanket (UASB) reactor was conducted. Thereafter, dynamic multiple non-linear regression models were developed for the timely prediction of biogas yield from the UASB. The proposed models could identify the most influential parameter(s) that could guide the control and operation of anaerobic systems. Based on residual analysis and diagnostic statistics, the best fit models were identified and their output performance compared with that of experimental data.
Materials and Methods
Feed and inoculum
Potato starch processing wastewater (PSPW) was collected from a local starch producing factory in Heilongjiang province, China and kept under 4°C in the State Key Laboratory of Urban Water Resources of Harbin Institute of Technology. The characteristics of the raw wastewater were as follows (averages): pH 5.0, total chemical oxygen demand (COD) 49179 mg/L, total organic carbon 9831 mg/L, ammonium (NH4+) 96 mg/L, total Kjehdahl nitrogen (TKN) 1023 mg/L, total nitrogen (TN) 1439 mg/L, total phosphorus (TP) 190 mg/L, TSS 25345 mg/L, VSS 24855 mg/L and alkalinity (ALK) 4945 mg/L. The raw wastewater was diluted with the pH adjusted to an average of 7.09 by sodium bicarbonate NaHCO3, and then fed into the UASB. The feed was characterized by a COD, NH4+, TKN, TP, ALK and total volatile fatty acids (VFAs) of 4029, 111, 511, 45, 9177 and 534 mg/L, respectively.
The activated sludge for inoculation of the reactor was collected from a local municipal wastewater treatment plant operating in an anaerobic-anoxic-oxic (A2/O) condition and were characterized as 11.5 g/L mixed liquor suspended solids (MLSS) and 5.6 g/L mixed liquor volatile suspended solids (MLVSS).
Experimental setup and reactor operation
The experiments were conducted in an UASB that was constructed with Plexiglas (Figure 1). The reactor was 120 cm high with an internal diameter of 10 cm. There were a conical bottom of about 0.4 L and a gas-solid-liquid separator at the upper part. The total volume and the effective working volume was 8.8 and 7 L, respectively. Five sampling ports at 25 cm interval from each other were allocated along the vertical height of the reactor. The first sampling port was 1 cm above the conical bottom whiles the topmost port was 3 cm below the reactor’s head.

Figure 1: Schematic diagram of the upflow anaerobic sludge bed reactor: (1) Influent tank; (2) Peristaltic pump; (3) Heat conducting wire; (4) Temperature control; (5) Sludge bed; (6) Water seal; (7) Wet gas meter; (8) Effluent tank; (9) Flow pipes.
The UASB was operated under mesophillic condition (35 ± 1°C) and the heating source was obtained from a heat conducting wire wound around the stem. The heat conducting wire was connected to a temperature controller. The diluted raw PSPW was fed to the reactor by a peristaltic pump (BT100-2J, Langer Instruments, United Kingdom). The evolved biogas was collected by the gas-solid-liquid separator and was measured daily using the wet gas meters (Model LML-1, Changchun Filter Co., Ltd., China). The reactor was started up with an inoculum of 3.52 g/L MLVSS and a hydraulic retention time (HRT) of 48 h was kept during the first 49 days. The reactor was continuously operated with a decreased HRT of 24 h since the 50th day.
Analytical methods
The influent and the effluent of the reactor were sampled daily for the analysis of COD, ALK (in terms of CaCO3), TKN, NH4+ and TP in accordance with the Standard Methods for the Examination of Water and Wastewater, APHA [24]. pH was determined using a DELTA 320 (Mettler Toledo, USA).
Volatile fatty acids (VFAs) were measured by a gas chromatograph (SP6890, Shandong Lunan Instrument Factory, China) equipped with a 30 m capillary column (Stabilwax-DA, i.d. 0.32 mm, 11054, Restek) and a flame ionization detector (FID). The operational temperatures of the injection port, oven and detector were 210°C, 180°C, and 210°C, respectively. Nitrogen gas was used as the carrier gas, with a 0.75 MPa column head pressure. The split ratio was 1:50. Liquid sample of 1 mL collected from the top most sampling port was centrifuged at 13000 rpm for 3 min, and 0.5 mL of the supernatant was pipetted and acidified with 25% H3PO4 and then 1 μL of the final solution was injected. The VFAs were measured in terms of CH3COOH.
A 0.5 ml of biogas was sampled from the headspace of the reactor to determine CH4 and CO2 fractions. Fraction of CH4 was analyzed by another gas chromatograph (SP-6800A, Shandong Lunan Instrument Factory, China) equipped with a thermal conductivity detector (TCD) and a 2 m stainless column packed with Porapak Q (60/80 mesh). Temperatures of the injector, column and the TCD were 80°C, 50°C and 80°C, respectively.
Data preparation and correlation analysis
The experimental data was used as an open database connectivity data source for the regression analysis. MINITAB (version 17) and Sigmaplot (version 13) statistical computing environment were used to carry out Pearson's correlation analysis. The few irregular biogas yield data were omitted prior to further analysis. Significances were corrected to avoid multiple comparisons [25]. A probability (p-value) less than 0.05 was used to determine the statistical significance of the regression coefficients during the correlation analysis and the prediction.
Model description
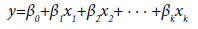
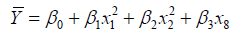
The general form of the models used in this study is expressed as Eq.1 [26-30]. The output variable y, written as a function of k, has input variables (x1, x1, …, xk) and a random error term εˆ that is added to make the model probabilistic rather than deterministic. In particular, the value of the coefficient βi determines the contribution of the independent variable xi, given that the other (k−1) independent variables are held constant. β0 represents the y-intercept. The coefficients β0 β1, …, βk are usually unknown since they represents population parameters.
 (1)
(1)
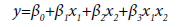
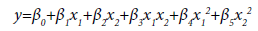
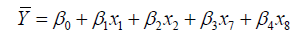
The input variables can represent higher-order terms for quantitative predictors. Since most statistical tests are reliant on assumptions about the variables used [31], 5 assumptions were considered in this study which included linearity, independence among errors, nonmulticollinearity, homoscedasticity and non-autocorrelation [32]. The first-order model (Eq.2), second-order model (Eq.3) and complete second-order model (Eq.4) were used in the model development. These models comprised two or more independent variables in different combinations and interactions among the input variables and the estimated unknown coefficients (β0 β1, …, βk) [26,33].
 (2)
(2)
 (3)
(3)
 (4)
(4)
where β0 is the y-intercept of (k+1); β1 is change in y for one unit increase in x1 when x2, x3, …, xk are fixed; β2 is change in y for one unit increase in x2 when x1, x3, …, xk are held; βk is change in y for one unit increase in xk when x1, x2, …, xk-1 are held. β3x1x2 is the interaction term. For Eq.3 and Eq.4, β1 and β1 cause surface shift along the x1 and x2 axes, β3 controls the rate of twist in the ruled surface, β4 and β5 controls the type of surface and the rates of curvature, respectively.
Selection of input and output variables for model fitting
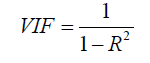
Seven process related parameters obtained from the feed, together with the HRT, were used as input variables (xn) [34]. The seven parameters were influent COD, pH, NH4 +, ALK, TKN, VFAs and TP. Variables which did not correlate with biogas yield significantly (p >0.05) were omitted [23]. A stepwise iterative variance inflation factor (VIF) analysis as described by Mac Nally was used to evaluate all of the input variables and the VIF values less than 5 were considered [26]. Thus, the developed models would contain fewer but consistent variables.
With the detected biogas yield (BgY) in the UASB as the output variable (Y), descriptive statistics of the model variables are given in Table 1. It was noticed that some input variables fluctuated remarkably. Akaya et al., however, argued that difference in values of input parameters is a preferable positive indicator in arriving at positive results for a general biogas prediction model [17].
| Variable | Term | Mean | Min | Max |
|---|---|---|---|---|
| COD (mg/L) | x1 | 4029 ± 763 | 2469 | 5787 |
| NH4+ (mg/L) | x2 | 110 ± 18 | 68 | 169 |
| pH (mg/L) | x3 | 7 ± 1 | 5 | 8 |
| ALK (mg/L) | x4 | 4945 ± 1411 | 2297 | 7655 |
| TKN (mg/L) | x5 | 511 ± 96 | 281 | 841 |
| TP (mg/L) | x6 | 45 ± 6 | 34 | 58 |
| VFAs (mg/L) | x7 | 534 ± 171 | 27 | 895 |
| HRT (h) | x8 | -- | 24 | 48 |
| Biogas yield (L/d) | Y | 10 ± 5 | 3 | 17 |
Table 1: Summary of descriptive statistics of input and output variables (confidence level 95.0%).
Evaluation and selection of the models
All of the input variables were used to obtain the regression coefficients  and to estimate the value of regression residual (εˆ) as given in Eq.5 [4].
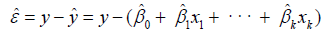 (5)
(5)
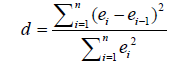
Five unique model equations with multiple input variables in various combinations and interactions were developed and selected based on Goodness-of-Fit [35]. Nine regression coefficients, i.e., β0, β1, …, β8, were considered and its respective values were estimated and used in the models. The optimum models were selected based on the following statistical performance criterion: standard error of the estimate (SEE) [36] (Eq.9), sum of squared residuals (SSR) (Eq.8), coefficient of multiple determination (R2) (Eq.6), adjusted coefficient of multiple determination (Adj-R2) [37] (Eq.7), VIF (Eq.10), Durbin- Watson statistics (DWS) (Eq.11) and p-value [15] (Eq.12).
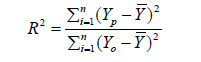 (6)
(6)
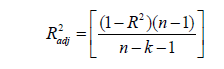 (7)
(7)
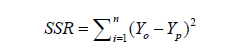 (8)
(8)
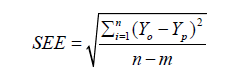 (9)
(9)
 (10)
(10)
 (11)
(11)
 (12)
(12)
where, Yo, Yp and  denotes experimental data, predicted values and arithmetic mean of the observed data; n and m is the number of data points and parameters in the regression model, respectively; k is the number of independent regressors excluding the constant term;
  and y1 and
  were, respectively, the observed and predicted values of the response variable for individual i; TS is random variable associated with the assumed distribution; ts is the test statistics calculated from sample, and cdf is the cumulative density function of the assumed distribution.
The suggested five models, named M1, M2, M3, M4 and M5 were expressed in Eq.13, Eq.14, Eq.15, Eq.16 and Eq.17, respectively.
 (13)
(13)
 (14)
(14)
 (15)
(15)
 (16)
(16)
 (17)
(17)
Results and Discussion
UASB performance
Performance of the UASB treating PSPW at 35 ± 1°C with HRTs of 48 h and 24 h by stages was presented in Figure 2 and Table 2. With an average influent COD of 3799 mg/L and an average organic loading rate (OLR) of 1.50 kgCOD/m3·d for HRT 48 h, the effluent COD averaged 267 mg/L with a removal ranged from 83.5% to 92.0% was obtained in the reactor (Figure 2a). As the influent COD was increased to about 4185 mg/L along with the shortened HRT of 24 h, the COD removal ranged from 90% and 94.5% with an effluent COD of about 280 mg/L, though the OLR had been increased to about 4.23 kg COD/m3·d. The higher COD removal at HRT 24 h resulted in an increase in biogas yield in the UASB. As shown in Figure 2b, the influent and effluent pH ranged from 5.35-8.05 (mean pH 7.00) and 7.35-8.86 (mean pH 8.00) for HRT 48 h and 24 h, respectively. The illustration in Figure 2c depicted biogas yield that ranged from 3.4 to 9.6 L/d obtained at HRT 48 h, while 11.3 to 17.4 L/d in HRT 24 h. The methane fraction throughout the performance of the reactor ranged from 56.2% and 84.5%.

Figure 2: Fluctuation phenomenon of influent/effluent quality and reactor performance.
| HRT | Water quality | OLR (kg COD/m3·d) | COD removal (%) | Biogas (L/d) | Methane (L/d) | ||
|---|---|---|---|---|---|---|---|
| influent | effluent | ||||||
| 48 h (49 days) | pH | 7.03 ± 1 | 8 ± 1 | 1.5 ± 1 | 91 ± 4 | 5.6 ± 1 | 3.8 ± 1 |
| COD(mg/L) | 3799 ± 526 | 267 ± 109 | |||||
| VFAs(mg/L) | 568 ± 126 | -- | |||||
| NH4+(mg/L) | 119 ± 14 | 252 ± 17 | |||||
| TP(mg/L) | 43 ± 5 | 45 ± 4 | |||||
| TKN(mg/L) | 466 ± 58 | 307 ± 1 | |||||
| ALK(mg/L) | 6010 ± 412 | 10948 ± 252 | |||||
| 24 h (63 days) | pH | 7.08 ± 1 | 8.5 ± 1 | 4.23 ± 1 | 93 ± 4 | 14 ± 2 | 10.5 ± 2 |
| COD(mg/L) | 4185 ± 546 | 280 ± 147 | |||||
| VFAs(mg/L) | 433 ± 114 | -- | |||||
| NH4+(mg/L) | 100 ± 13 | 243 ± 26 | |||||
| TP(mg/L) | 45 ± 6 | 47 ± 4 | |||||
| TKN(mg/L) | 518 ± 84 | 507 ± 1 | |||||
| ALK(mg/L) | 3592 ± 456 | 8638 ± 751 | |||||
Table 2: The UASB performance throughout the 112-days operation (Confidence Level of 95%).
Throughout the operation of the UASB, observed pH in both HRTs were almost similar in value even though a remarkable difference in ALK was observed in the reactor. Figure 2d indicated that no observable difference in NH4+ concentration was found when the reactor was operated at HRT 48 h or 24 h, with an influent and effluent concentration averaged 109 and 241 mg/L, respectively. The average influent and effluent ALK at HRT 48 h were 6010 and 10948 mg/L, while that of 3592 and 8638 mg/L for HRT 24 h, respectively (Figure 2e). The feasible pH and ALK enhanced the acetogenesis and methanogenesis in the reactor, resulting in the few VFAs observed in the effluent [38].
The average influent and effluent TKN at HRT 48 h were found to be 466 and 307, respectively (Figure 2f). With the shortened HRT 24 h, the influent and effluent TKN were increased to about 518 and 507, respectively. Within the 112 days’ operation, the UASB showed no TP removal with the same concentration of about 45 mg/L in both influent and effluent (Figure 2f).
Correlations between output and input variables
Correlation analysis was performed during the data preparation to identify the potential input variables to build the model. The results as shown as Table 3 showed that influent COD, pH, NH4+, ALK, TKN, VFA, TP and HRT had remarkable influence on the biogas yield in the UASB. The eight variables correlated with biogas yield were therefore used as input and output variables in the models. Observably, NH4+ was the only variable included in all model types (Eq.13 to Eq.17), but it has seldom been used in predictive models before [23,39].
| Input variables (influent) | Name | r | pvalue |
|---|---|---|---|
| COD | x1 | 0.31 | <0.001 |
| NH4+ | x2 | -0.51 | 0.055 |
| pH | x3 | -0.01 | 0.757 |
| ALK | x4 | -0.93 | 0.747 |
| TKN | x5 | 0.33 | 0.801 |
| TP | x6 | 0.15 | 0.941 |
| VFAs | x7 | -0.44 | 0.004 |
| HRT | x8 | -0.98 | <0.001 |
| COD �? NH4+ | x1x2 | -0.18 | <0.001 |
| COD �? TKN | x1x5 | 0.45 | <0.001 |
| COD �? HRT | x1x8 | -0.86 | <0.001 |
| NH4+ �? TKN | x2x5 | -0.12 | <0.001 |
| NH4+ �? ALK | x2x4 | -0.87 | <0.001 |
| NH4+ �? TP | x1x6 | -0.31 | <0.001 |
| NH4+ �? VFAs | x2x7 | -0.53 | <0.001 |
| TKN �? TP | x5x6 | 0.34 | 0.042 |
| TP �? VFAs | x6x7 | -0.35 | <0.001 |
| COD2 | x12 | 0.31 | <0.001 |
| (NH4+)2 | x22 | -0.50 | 0.018 |
Table 3: Pearson correlation coefficients (r) between biogas yield and input variables.
The correlation analysis demonstrated that some input variables correlated significantly with the biogas yield (r = 0.31 to 0.98) whiles others correlated poorly with r ranging from 0.01 to 0.18. Similarly, influent pH (x3), ALK (x4), TKN (x5) and TP (x6) were non-significant as their p values were relatively high (p>0.05). All other variables had a p<0.001 or <0.05 (Table 3). Among the input variables, COD (x1), x5, x6, and the product terms of COD and TKN (x1x5), TKN and TP (x5x6) and COD (x12) were positively correlated with the biogas yield. On the other hand, influent NH4+ (x2), pH (x3), x4, total VFAs (x7), HRT (x8) and the interaction terms x1x2, x1x8, x2x5, x2x4, x2x6, x2x7, x6x7, and x22 were all negatively correlated with biogas yield.
Variable importance and model validation
There were 8 variable predictors (x1, x2, x3, x4, x5, x6, x7, x8) in the proposed 5 models (Eq.13 to Eq.17), and the entire sets of explanatory variables for the 5 models differed partially. Among the 8 variable predictors, NH4+ was noticed as a common predictor. Regression coefficients determined from the multiple regression analysis were substituted into M3 (Eq.15) and M4 (Eq.16) to yield Eq.18 and Eq.19, respectively.
 (18)
(18)
 (19)
(19)
The final structure of the model equations expressed in Eq.18 and Eq.19 were rewritten and given in Eq.20 and Eq.21, respectively.
 (20)
(20)
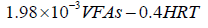 (21)
(21)
 (22)
(22)
Accordingly, independent variables x1, x2, x7 and x8 were used in M3 and M4 as shown in Eq.18 and Eq.19. Table 4 showed the results of the diagnostics statistics and performance criterion. Obviously, COD, NH4+, VFAs and HRT were more useful than ALK, TKN, TP and pH in model M3 (Eq.15) and M4 (Eq.16). Conversely, NH4+, ALK, TKN, TP and VFAs were more important in M1 (Eq.13). On the other hand, COD, NH4+, TKN and HRT related better in M2 (Eq.14). Model M5 (Eq.17) engaged all eight variables as illustrated in Table 4.
| Model | Input variable | p-value | VIF | R2 | Adj-R2 | SEE | SSR | DWS |
|---|---|---|---|---|---|---|---|---|
| (%) | (%) | |||||||
| M1 | �?0 | 0 | -- | 86.54 | 85.9 | 1.81 | 347.4 | 1.86 |
| x2x4 | 0 | 3.42 | ||||||
| x2x6 | 0 | 2.42 | ||||||
| x2x7 | 0 | 6.26 | ||||||
| x5x6 | 0.042 | 1.78 | ||||||
| x6x7 | 0 | 4.01 | ||||||
| M2 | �?0 | 0 | -- | 96.15 | 96 | 0.96 | 99.4 | 1.9 |
| x1x2 | 0 | 2.14 | ||||||
| x1x5 | 0 | 1.56 | ||||||
| x1x8 | 0 | 1.69 | ||||||
| x2x5 | 0 | 1.51 | ||||||
| M3 | �?0 | 0 | -- | 97.29 | 97.19 | 0.81 | 69.88 | 2.05 |
| x1 | 0 | 1.04 | ||||||
| x2 | 0.05 | 1.49 | ||||||
| x7 | 0.003 | 1.37 | ||||||
| x8 | 0 | 1.69 | ||||||
| M4 | �?0 | 0 | -- | 96.99 | 96.9 | 0.85 | 77.79 | 2.02 |
| x12 | 0 | 1.04 | ||||||
| x22 | 0.018 | 1.43 | ||||||
| x8 | 0 | 1.19 | 97.3 | 97.09 | 0.825 | 69.71 | 2.05 | |
| M5 | �?0 | 0 | -- | |||||
| x1 | 0 | 1.2 | ||||||
| x2 | 0.055 | 1.56 | ||||||
| x3 | 0.757 | 1.03 | ||||||
| x4 | 0.747 | 9.61 | ||||||
| x5 | 0.801 | 1.2 | ||||||
| x6 | 0.941 | 1.11 | ||||||
| x7 | 0.004 | 1.39 | ||||||
| x8 | 0 | 10.07 |
SEE, standard error of the estimate; SSR, sum of squared residuals; R2, coefficient of multiple determination; Adj-R2, adjusted coefficient of multiple determination; VIF, variance inflation factor; DWS, Durbin��?Watson statistics;p-value, calculated probability.
Table 4: Diagnostics statistics and performance criterion of the models.
Based on the diagnostics statistics, p-values associated with the variables in model M1, M2, M3 and M4 were statistically significant (Table 4). However, the entire variable set in M5 recorded high p-value. In particular, pH, TKN, ALK and TP used in M5 were 0.75, 0.74, 0.8 and 0.9 respectively, which were extremely > 0.05. This phenomenon was evident to conclude that M5 was not a good model to be considered by all standards although its R2 yielded 97.30%. On the contrary, the multiple coefficient of determination (R2) for M3 and M4 were 97.29% and 96.99%, respectively, with only 2.71% and 3.01% of the total variations not explained by both models in predicting biogas yield. For M1 and M2, about 13.46% and 3.85% of the variation existing among dependent variables were respectively not explained by these models, suggesting biogas yield predicted by M1 and M2 were unfit to the experimental data.
As shown in Table 4, the VIF for HRT and TP as regressors in M5 were 10.07 and 9.61 respectively. These huge values violated the assumptions specified in this study. In clarity, the VIF values confirmed that HRT and TP were highly correlated multicollinearity. Similarly, in M1, interaction variable of x2, x7 (NH4+ and VFAs) exhibited some multicollinearity as a value of 6.26 was estimated as VIF. In terms of SEE, M3, M4 and M5 recorded the lowest values of 0.80, 0.84 and 0.82, respectively, suggesting a more precise evaluation of the variation in the estimated mean for set of the predictor values.
Furthermore, the SSR obtained for M3, M4 and M5 were the lowest among the 5 models. The values 69.88, 77.79 and 69.71, respectively, represented least variation or deviation of predictions from the mean as compared to M1 and M2. M3, M4 and M5 values in terms of DWS were 2.05, 2.02 and 2.05, respectively, suggesting no autocorrelation among input variables used in the models. On the other hand, DWS values for M1 (1.86) and M2 (1.90) indicated that input variables were approaching a positive autocorrelation.
Further analysis and applicability of selected optimum models
Base on the results shown in Table 4, M3 (Eq.15) and M4 (Eq.16) had been identified as the best models among the 5 proposed models in predicting biogas yield of the UASB. Residual analysis was carried out to determine the adequacy of the models and their compliance with the assumptions of regression. The normal probability plots for M3 (Figure 3a) and M4 (Figure 3e) showed some minimum deviations of data points from the straight line at the extremes. The less visible pattern observed on the plot of standardized residuals against the fitted (predicted) values (Figure 3b and 3f), verified the assumption that the residuals are randomly distributed and has constant variance.

Figure 3: Residual plots of Normal Probability Plot (a, e), Versus Fits (b, f), Histogram (c, g) and Versus Order (d, h).
In terms of residual distribution with histogram, M3 (Figure 3c) and M4 (Figure 3g) were relatively well distributed with no trace of outliers. The standardized residuals for M3 and M4 are shown in Figure 3d and 3h, respectively. No obvious increasing or decreasing, cyclical or sudden shift of the data points was observed. The residuals versus order plot verified the assumption that the residuals were independent from one another. The linear regression analysis of the MnLRM output and the corresponding experimental data had a relatively good cohesion (Figure 4). The head-to-head comparisons of predicted data versus experimental data illustrated that model M3 (Figure 5a) and M4 (Figure 5b) were in perfect agreement, indicating their effectiveness in making predictions from the UASB treating PSPW.

Figure 4: Correlation (a, c) and visual agreements (b, d) of the predicted and the experimental data in model M3 and M4, respectively.

Figure 5: Head-to-head comparisons of predicted and experimental results.
Above all, the developed model M3 and M4 could serve as a valuable and practical management tool that could support the control of anaerobic wastewater treatment processes for biogas generation. All parameters used in the model development could be obtained from experimental observations or by rapid measurements. Nevertheless, to ensure reliable performances, the introduced model(s) could be fitted with large dataset to offer a significant improvement in prediction accuracy. Therefore, future research should target at collecting prolonged time-series data to improve the model performance and to minimize effects, errors or/and possible unrealistic predictions.
Conclusion
The UASB was feasible and efficient in treating potato starch processing wastewater. With an average organic loading rate (OLR) of 1.50 kg COD/m3·d, COD removal efficiency ranging from 83.5% to 92.0% was obtained when HRT was 48 h. As the influent COD was increased to about 4185 mg/L along with the shortened HRT of 24 h, the COD removal reached 94.5%, although organic loading rate (OLR) had been increased to about 4.23 kg COD/m3·d. The higher COD removal at HRT 24 h resulted in an increase in biogas yield in the UASB. Biogas yield at HRT 48 h ranged from 3.4 to 9.6 L/d, whiles 11.3 to 17.4 L/d were observed at HRT 24 h. The methane fraction throughout the performance of the reactor reached 84.5%. No signs of acidity were encountered in the UASB as effluent pH observed ranged from 7.35-8.86 (mean pH 8.00) for both HRT of 48 h and 24 h.
To predict the biogas yield in the UASB treating potato starch processing wastewater (PSPW), the dynamic relationship among PSPW parameters, reactor operational parameters and the biogas yield were modeled based on MnLR model and validated with residuals analysis. Among the 5 developed models, M3 and M4 were identified as the optimum ones due to their superior predictive performance on biogas yield. The R2 emerged from M3 and M4 were 97.29% and 96.99%, respectively. COD, NH4+, VFAs and HRT were the most useful and favourable predictive parameters compared to ALK, TKN, TP and pH. Both model M3 and M4 turned out to be a good tool for predicting biogas yield in UASBs. These models can also contribute to the understanding of the factors that influence anaerobic processes, and subsequently be used as a guide to control the processes to enhance biogas yield.
Acknowledgements
The authors gratefully acknowledge the financial support from the Major Science and Technology Program for Water Pollution Control and Management (Grant No. 2013ZX07201007), and the State Key Laboratory of Urban Water Resource and Environment, Harbin Institute of Technology (Grant No. 2016DX06).
References
- Keijbets M (2008) Potato processing for the consumer: developments and future challenges. Potato Res 51: 271-281.
- Wang RM, Li FY, Wang XJ, Li QF, He YF, et al. (2010) The application of feather keratin and its derivatives in treatment of potato starch wastewater. Functional Materials Letters 3: 213-216.
- Li Y, Song J, Yang Q (2015) Utilization of potato starch processing wastes to produce animal feed with high lysine content. Journal of microbiology and biotechnology 25: 178-184.
- Barampouti E, Mai S, Vlyssides A (2005) Dynamic modeling of biogas production in an UASB reactor for potato processing wastewater treatment. Chemical Engineering Journal 106: 53-58.
- Wang RM, Wang Y, Ma GP, He YF, Zhao YQ (2009) Efficiency of porous burnt-coke carrier on treatment of potato starch wastewater with an anaerobic–aerobic bioreactor. Chemical Engineering Journal 148: 35-40.
- Fang C, Boe K, Angelidaki I (2011) Biogas production from potato-juice, a by-product from potato-starch processing, in upflow anaerobic sludge blanket (UASB) and expanded granular sludge bed (EGSB) reactors. Bioresource technology 102: 5734-5741.
- Arhoun B, Bakkali A, El Mail R, Rodriguez-Maroto J, Garcia-Herruz F (2013) Biogas production from pear residues using sludge from a wastewater treatment plant digester. Influence of the feed delivery procedure. Bioresource technology 127: 242-247.
- Linville JL, Shen Y, Schoene RP, Nguyen M, Urgun-Demirtas M, et al. (2016) Impact of trace element additives on anaerobic digestion of sewage sludge with in-situ carbon dioxide sequestration. Process Biochemistry 51: 1283-1289.
- �?entürk E, Ince M, Engin GO (2010) Kinetic evaluation and performance of a mesophilic anaerobic contact reactor treating medium-strength food-processing wastewater. Bioresource technology 101: 3970-3977.
- Ratanatamskul C, Manpetch P (2016) Comparative assessment of prototype digester configuration for biogas recovery from anaerobic co-digestion of food waste and rain tree leaf as feedstock. International Biodeterioration & Biodegradation 113: 367-374.
- Ghaniyari-Benis S, Martín A, Borja R (2010) Kinetic modelling and performance prediction of a hybrid anaerobic baffled reactor treating synthetic wastewater at mesophilic temperature. Process biochemistry, 45: 1616-1623.
- Jiang J, Wu J, Poncin S, Li HZ (2016) Effect of hydrodynamic shear on biogas production and granule characteristics in a continuous stirred tank reactor. Process Biochemistry 51: 345-351.
- Hu W, Thayanithy K, Forster C (2002) A kinetic study of the anaerobic digestion of ice-cream wastewater. Process Biochemistry 37: 965-971.
- Yetilmezsoy K, Sapci-Zengin Z (2009) Stochastic modeling applications for the prediction of COD removal efficiency of UASB reactors treating diluted real cotton textile wastewater. Stochastic environmental research and risk assessment 23: 13-26.
- Yetilmezsoy K, Turkdogan FI, Temizel I, Gunay A (2013) Development of ann-based models to predict biogas and methane productions in anaerobic treatment of molasses wastewater. International Journal of Green Energy 10: 885-907
- Cakmakci M (2007) Adaptive neuro-fuzzy modelling of anaerobic digestion of primary sedimentation sludge. Bioprocess Biosyst Eng 30: 349-357.
- Akkaya E, Demir A, Varank G (2015) Estimation of biogas generation from a UASB reactor via multiple regression model. International Journal of Green Energy 12: 185-189.
- Ozkaya B, Demir A, Bilgili MS (2007) Neural network prediction model for the methane fraction in biogas from field-scale landfill bioreactors. Environmental Modelling & Software 22: 815-822.
- Batstone D, Keller J, Angelidaki I, Kalyuzhnyi S, Pavlostathis S, et al. (2002) The IWA Anaerobic Digestion Model No 1 (ADM1). Water Science and Technology 45: 65-73.
- Nasr N, Hafez H, El Naggar MH, Nakhla G (2013) Application of artificial neural networks for modeling of biohydrogen production. International journal of hydrogen energy 38: 3189-3195.
- Ahn JY, Chu KH, Yoo SS, Mang JS, Sung BW, et al. (2014) Determination of optimal operating factors via modeling for livestock wastewater treatment: Comparison of simulated and experimental data. International Biodeterioration & Biodegradation 95: 46-54.
- Mas DML, Ahlfeld DP (2007) Comparing artificial neural networks and regression models for predicting faecal coliform concentrations. Hydrological Sciences Journal 52: 713-731.
- Herrig IM, Böer SI, Brennholt N, Manz W (2015) Development of multiple linear regression models as predictive tools for fecal indicator concentrations in a stretch of the lower Lahn River, Germany. Water research 85: 148-157.
- APHA, AWWA, WEF (2005) Standard Methods for the Examination of Water and Wastewater. 21th edn. American Public Health Association, Washington, USA.
- Ramette A (2007) Multivariate analyses in microbial ecology. FEMS Microbiol Ecol 62: 142-160.
- Mac Nally R (2000) Regression and model-building in conservation biology, biogeography and ecology: the distinction between - and reconciliation of - ‘predictive’ and ‘explanatory’ models. Biodiversity and Conservation 9: 655-671.
- Huang L, Chen JC (2001) A multiple regression model to predict in-process surface roughness in turning operation via accelerometer. Journal of Industrial Technology 17: 1-8
- Yetilmezsoy K, Sakar S (2008) Development of empirical models for performance evaluation of UASB reactors treating poultry manure wastewater under different operational conditions. Journal of Hazardous materials 153: 532-543.
- Singh KP, Basant N, Malik A, Jain G (2010) Modeling the performance of up-flow anaerobic sludge blanket reactor based wastewater treatment plant using linear and nonlinear approaches—a case study. Analytica chimica acta 658: 1-11.
- Turkdogan-Aydınol FI, Yetilmezsoy K (2010) A fuzzy-logic-based model to predict biogas and methane production rates in a pilot-scale mesophilic UASB reactor treating molasses wastewater. Journal of hazardous materials 182: 460-471.
- Rostami I, Juhasz AL (2013) Bioaccessibility-based predictions for estimating PAH biodegradation efficacy–comparison of model predictions and measured endpoints. International Biodeterioration & Biodegradation 85: 323-330.
- Wold S, Sjöström M, Eriksson L (2001) PLS-regression: a basic tool of chemometrics. Chemometrics and intelligent laboratory systems 58: 109-130.
- Preacher KJ, Hayes AF (2008) Asymptotic and resampling strategies for assessing and comparing indirect effects in multiple mediator models. Behavior research methods 40: 879-891.
- Faul F, Erdfelder E, Buchner A, Lang AG (2009) Statistical power analyses using G*Power 3.1: Tests for correlation and regression analyses. Behavior Research Methods 41: 1149-1160.
- Schermelleh-Engel K, Moosbrugger H, Müller H (2003) Evaluating the fit of structural equation models: Tests of significance and descriptive goodness-of-fit measures. Methods of psychological research online 8: 23-74.
- Xu Y, Ma C, Liu Q, Xi B, Qian G, et al. (2015) Method to predict key factors affecting lake eutrophication–A new approach based on Support Vector Regression model. International Biodeterioration & Biodegradation 102: 308-315.
- Abdul-Wahab SA, Bakheit CS, Al-Alawi SM (2005) Principal component and multiple regression analysis in modelling of ground-level ozone and factors affecting its concentrations. Environmental Modelling & Software 20: 1263-1271.
- De-Sousa JT, Santos KD, Henrique IN, Brasil DP, Santos EC (2008) Anaerobic digestion and the denitrification in UASB reactor. Journal of Urban and Environmental Engineering 2: 63-67.
- David MM, Haggard BE (2011) Development of regression-based models to predict fecal bacteria numbers at select sites within the Illinois River Watershed, Arkansas and Oklahoma, USA. Water, Air, & Soil Pollution 215: 525-547.
Relevant Topics
- Anaerobic Biodegradation
- Biodegradable Balloons
- Biodegradable Confetti
- Biodegradable Diapers
- Biodegradable Plastics
- Biodegradable Sunscreen
- Biodegradation
- Bioremediation Bacteria
- Bioremediation Oil Spills
- Bioremediation Plants
- Bioremediation Products
- Ex Situ Bioremediation
- Heavy Metal Bioremediation
- In Situ Bioremediation
- Mycoremediation
- Non Biodegradable
- Phytoremediation
- Sewage Water Treatment
- Soil Bioremediation
- Types of Upwelling
- Waste Degredation
- Xenobiotics
Recommended Journals
Article Tools
Article Usage
- Total views: 4414
- [From(publication date):
March-2017 - Nov 21, 2024] - Breakdown by view type
- HTML page views : 3540
- PDF downloads : 874