Research Article Open Access
MLR Based Statistical Downscaling of Temperature and Precipitation in Lidder Basin Region of India
YasirAltaf1*, Ahanger Manzoor Ahmad1and Fahimuddin Mohd21Department of Civil Engineering, NIT Srinagar, Jammu and Kashmir, India
2DHI Environment Pvt (India) Ltd., New Delhi, India
- *Corresponding Author:
- Yasir Altaf
Research Scholar, Department of Civil Engineering
NIT Srinagar, Jammu and Kashmir, India
Tel: 00918803002425
E-mail: Yasir_04phd13@nitsri.net
Received date: November 11, 2016; Accepted date: January 23, 2017; Published date: January 30, 2017
Citation: Altaf Y, Ahmad AM, Mohd F (2017) MLR Based Statistical Downscaling of Temperature and Precipitation in Lidder Basin Region of India. Environ Pollut Climate Change 1:109.
Copyright: © 2017 Altaf Y, et al. This is an open-access article distributed under the terms of the Creative Commons Attribution License, which permits unrestricted use, distribution, and reproduction in any medium, provided the original author and source are credited.
Visit for more related articles at Environment Pollution and Climate Change
Abstract
In the present study, the multiple linear regression technique was employed to relate the monthly predictors obtained from the Global Climate Model namely CGCM3 (Canadian Centre for Climate Modelling and Analysis) with the monthly Predictands such as the locally observed precipitation and temperature at Pahalgam meteorological station which is located in the Lidder River Basin. Appropriate predictand-predictor relationships were found out for the region by carrying out sensitivity analysis .Regression equations were developed and subsequently future monthly and annual projections for precipitation, maximum temperature and minimum temperature for the entire 21st century were made. It was observed that at the end of the 21st century the CGCM3 model predicted an increase of 18.07% annual precipitation, whereas the average maximum and minimum annual temperatures were predicted to increase by 0.62°C and 0.76°C, respectively.
Keywords
General circulation models; Downscaling; Multiple linear regression; Predictors.
Introduction
Climate change has been defined as a “Change of climate which is attributed directly or indirectly to human activity that alters the composition of the global atmosphere and which is in addition to natural climate variability observed over comparable time periods” [1]. Downscaling techniques are used to bridge the spatial and temporal resolution gaps between what climate modellers are currently able to provide and what impact assessors require. GCM outputs are converted into local meteorological variables by different downscaling methods. Two fundamental approaches exist for downscaling of GCM outputs:
1. Dynamical downscales: the use of regional climate models (RCM) or limited-area models which use the lateral boundary conditions from a GCM to produce high resolution outputs [2].
2. Statistical downscaling: a range of methods which rely on the fundamental concept that regional climate is related to the largescale atmospheric state, expressed as a deterministic and/or stochastic function between the large-scale atmospheric variables (predictors) and local or regional climate variables [3,4].
In the present study, the multiple linear regression technique was employed to relate the GCM predictors of Global Circulation Model namely the CGCM3 (Canadian Centre for Climate Modelling and Analysis) with the Predictands such as the locally observed monthly precipitation and temperature at Pahalgam meteorological Station located in the Lidder river basin. The predictors as obtained from the outputs of CGCM3 are mean sea level pressure (mslpas), mean air temperature at 2m (Tempas), relative humidity, short wave radiation, meridonial velocity and zonal velocity. The relationships so developed were used to predict the future climate at the end of 21st century, in the form of monthly projections for precipitation and minimum and maximum temperatures.
Methodology
Study area
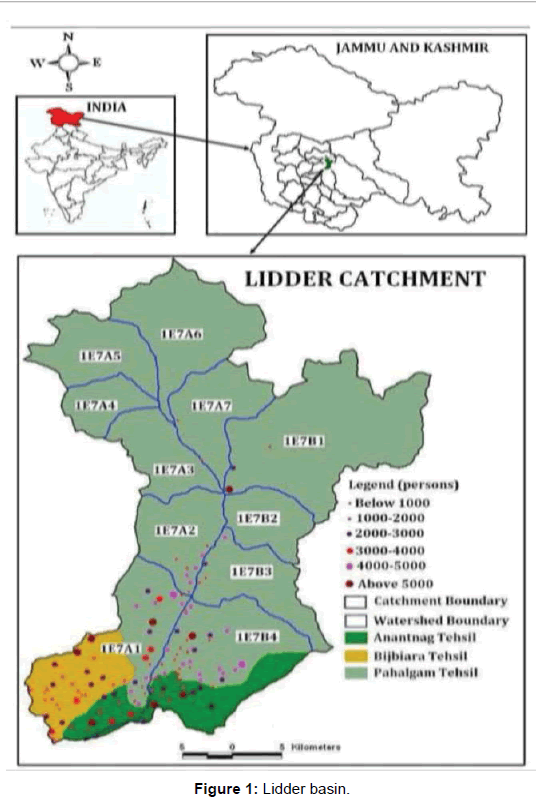
The Lidder valley has been carved out by River Lidder, a right bank tributary of River Jhelum. It has a catchment area of 1159.38 km2 which constitutes about 10 per cent of the total catchment area of River Jhelum [5]. The steep slopes in the Lidder valley along with depleted forest cover have been major factors of and sedimentation. These factors have also affected the drainage pattern of Lidder stream significantly and made the system extremely fragile as it has started showing signs of degeneration. The catchment area of Lidder stream occupies the south eastern part of the Kashmir valley and is situated between 33º 45′ 01″ N-34º 15′ 35″ N and 74º 06′ 00″ E–75º 32′ 29″ E (Figure 1).The lidder basin has an elevation range from 1440 m-5385 m above sea level .It consists of some of the major tourists attractions in the form of Pahalgam (world famous resort), Lidder river, Aru, Sheeshnag lake and Marsar lake. The land use characteristics of the lidder basin are given in Table 1. The Lidder valley forms part of the western Himalaya and lies between the Pir Panjal range in the south, south-east, and southwest Zanskar range. The valley begins from the base of the two snow fields, the Kolahoi and Sheshnag where from its two main upper streams; the West and the East Lidder originate and join each other near the famous tourist spot Pahalgam town and finally joins the Jhelum at Gur village (Anantnag District).
Multiple linear regressions
The association of three or more variables can be investigated by the multiple regression and correlation analysis [6]. The multiple-regression relation may be expressed in the form of Eq.
 (1)
(1)
where  are m variables.This equation gives the estimate of x1 for given values of all other variables. If Eq. (1) is linear, the regression is referred to as multiple linear regressions and the association is multiple linear correlations.
| S. No. | Description | Area (m2) |
|---|---|---|
| 1 | Settlements | 13.82 |
| 2 | Agriculture | 150.513 |
| 3 | Horticulture | 79.826 |
| 4 | Forest | 322.136 |
| 5 | Scrub | 236.96 |
| 6 | GrazingLand | 31.3448 |
| 7 | Wastelands | 112.93 |
| 8 | Wetlands | 1.422 |
| 9 | Waterbodies | 21.51 |
| 10 | Snow | 287.21 |
Table 1: Landuse characteristics of Lidder basin.
Data analysis
The daily precipitation and temperature data at Pahalgam meteorological station of Lidder Basin for the period 1978-2014 were obtained from India meteorological Department (IMD) Srinagar. The predictor data of Mean sea level pressure (mslpas), mean air temperature at 2m (Tempas), relative humidity, specific humidity, short wave radiation, long wave radiation, meridonial velocity , wind speed mean and zonal velocity were obtained for Global Circulation Model namely the CGCM3 for A1B scenario for the grid location of Area: 32.17°N 72.31°E to 37.05°N 80.20°E. The above mentioned predictor data for Global Circulation model CGCM3 was obtained for the year 1961- 2100. For multiple linear regression (MLR) analysis the predictand data set for the period 1978-2010 were used for calibration and that of 2011-2014 were used for validation purposes. Sensitivity Analysis was carried out to find the predictor-predictand relationships and nine deseasonalized predictors and three deseasonalized predictands (monthly mean maximum and minimum temperatures, and total monthly precipitation) were used to investigate correlation coefficients among predictors and to evaluate their predictive ability when used in a multiple linear regression (MLR) downscaling model. Air temperature, relative humidity, meridonial velocity and zonal velocity at different levels were important explainable predictors for the daily maximum and minimum temperatures. Mean sea level pressure (Mslpas), Tempas (mean air temp at 2m), relative humidity and short wave radiation were explanatory predictors for precipitation. The relationship of maximum and minimum temperature, precipitation with the appropriate predictors was expressed by regression equations in the form of Eq. (2),

Where y=Predictands (Local station Max. Temp, Min. Temp. and Precipitation) and X1, X2, X3 …Xn are different GCM predictors.
Results and Discussion
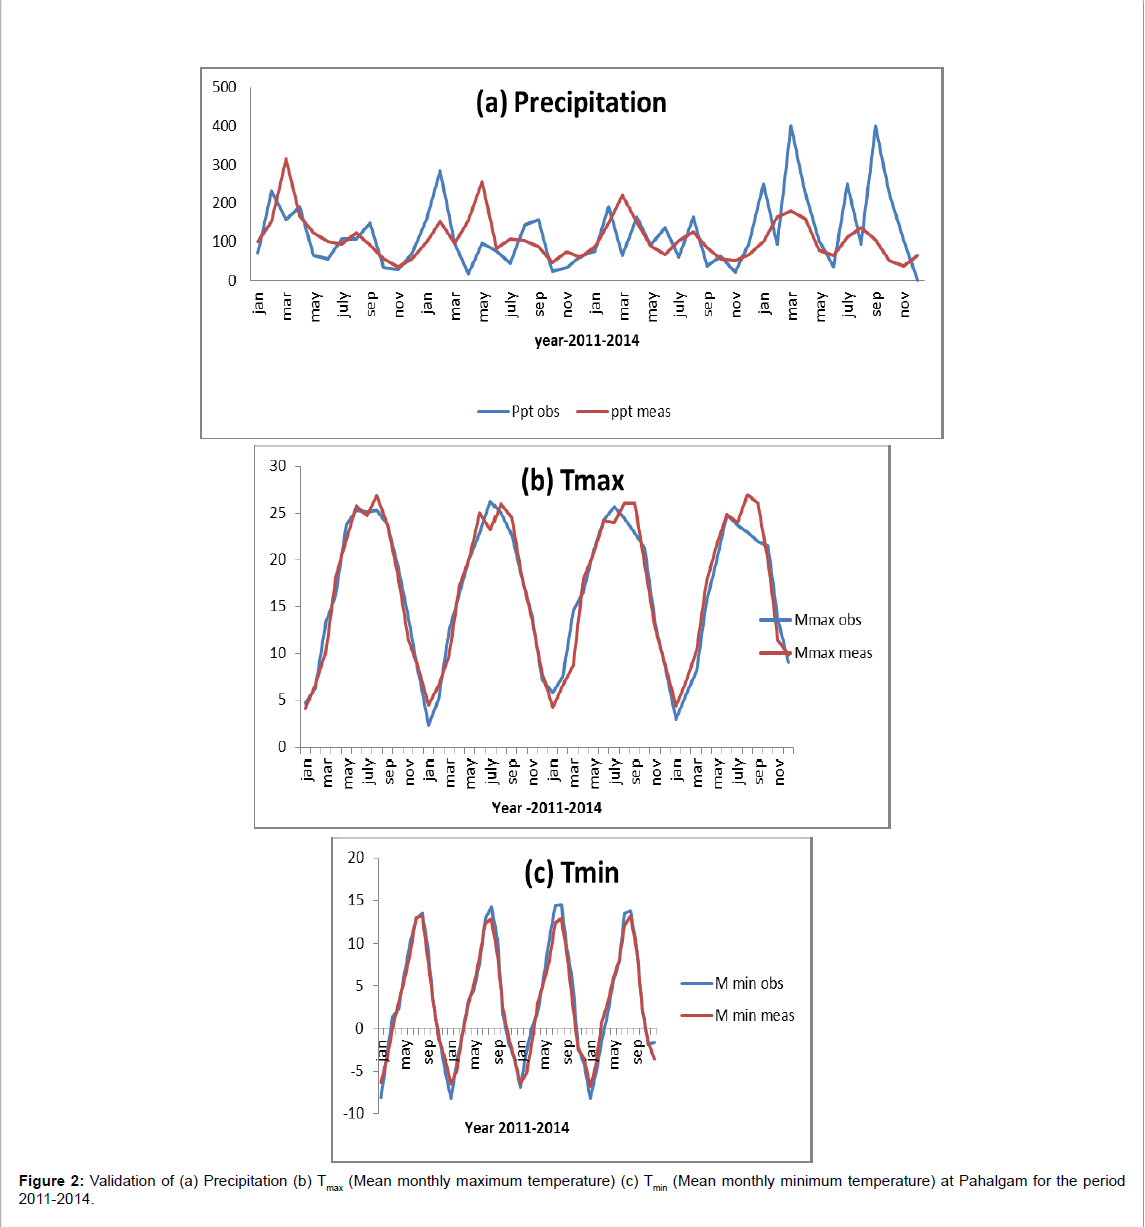
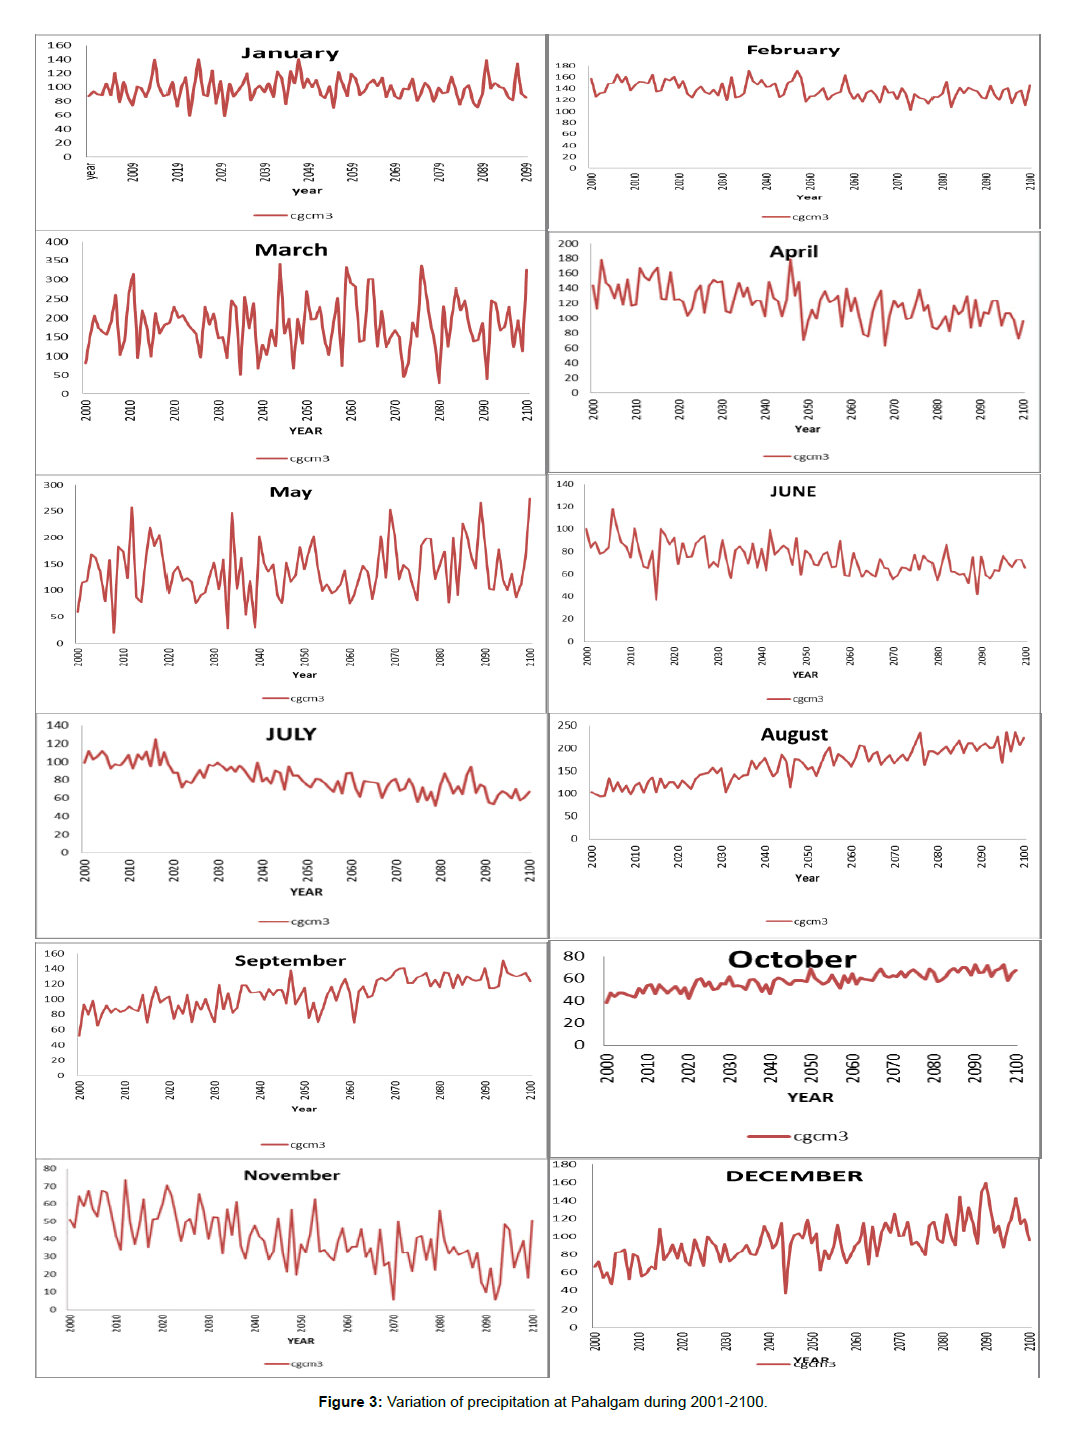
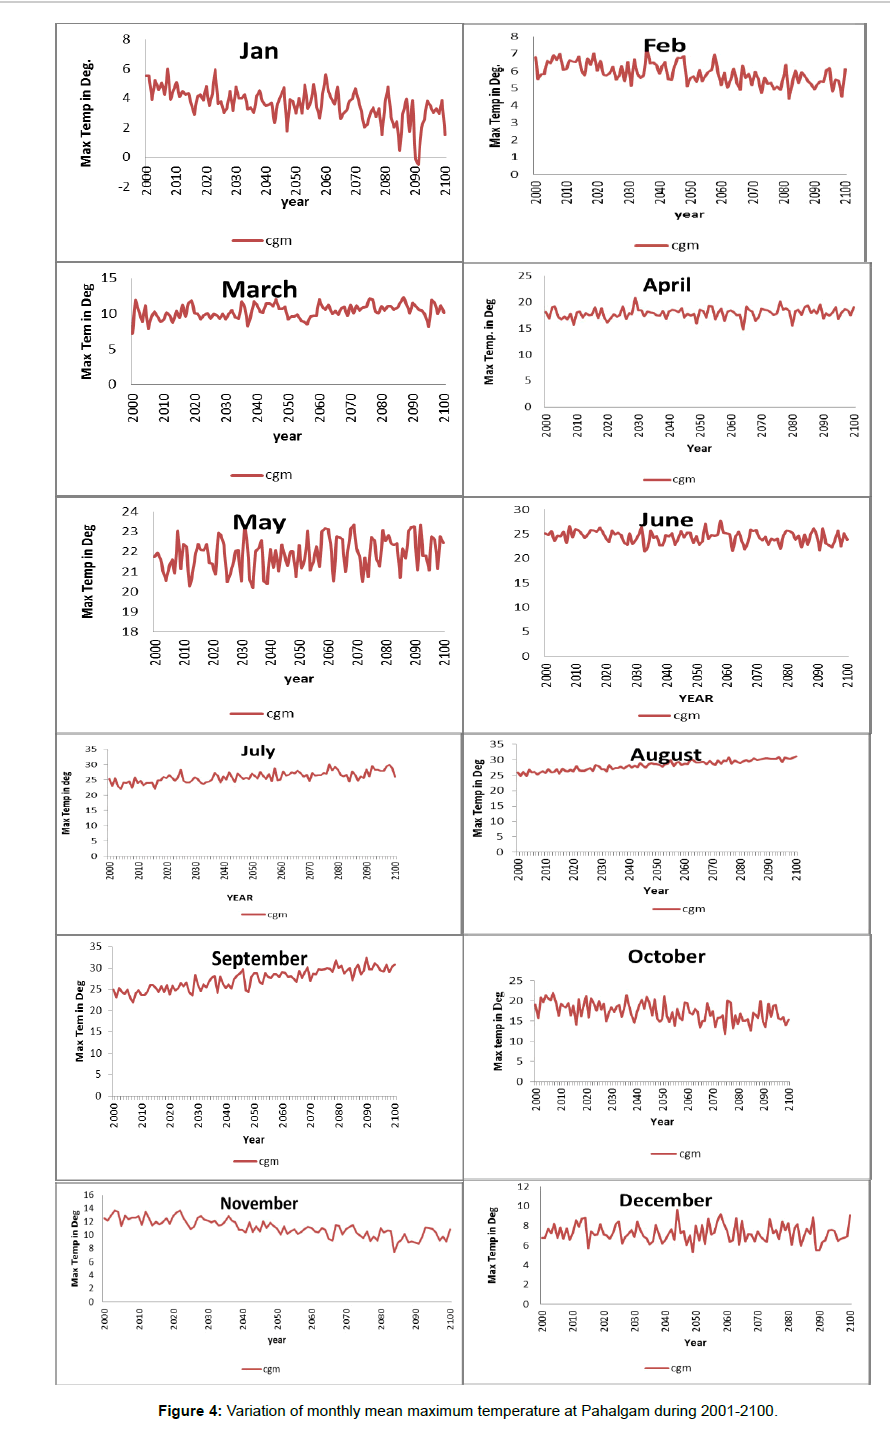
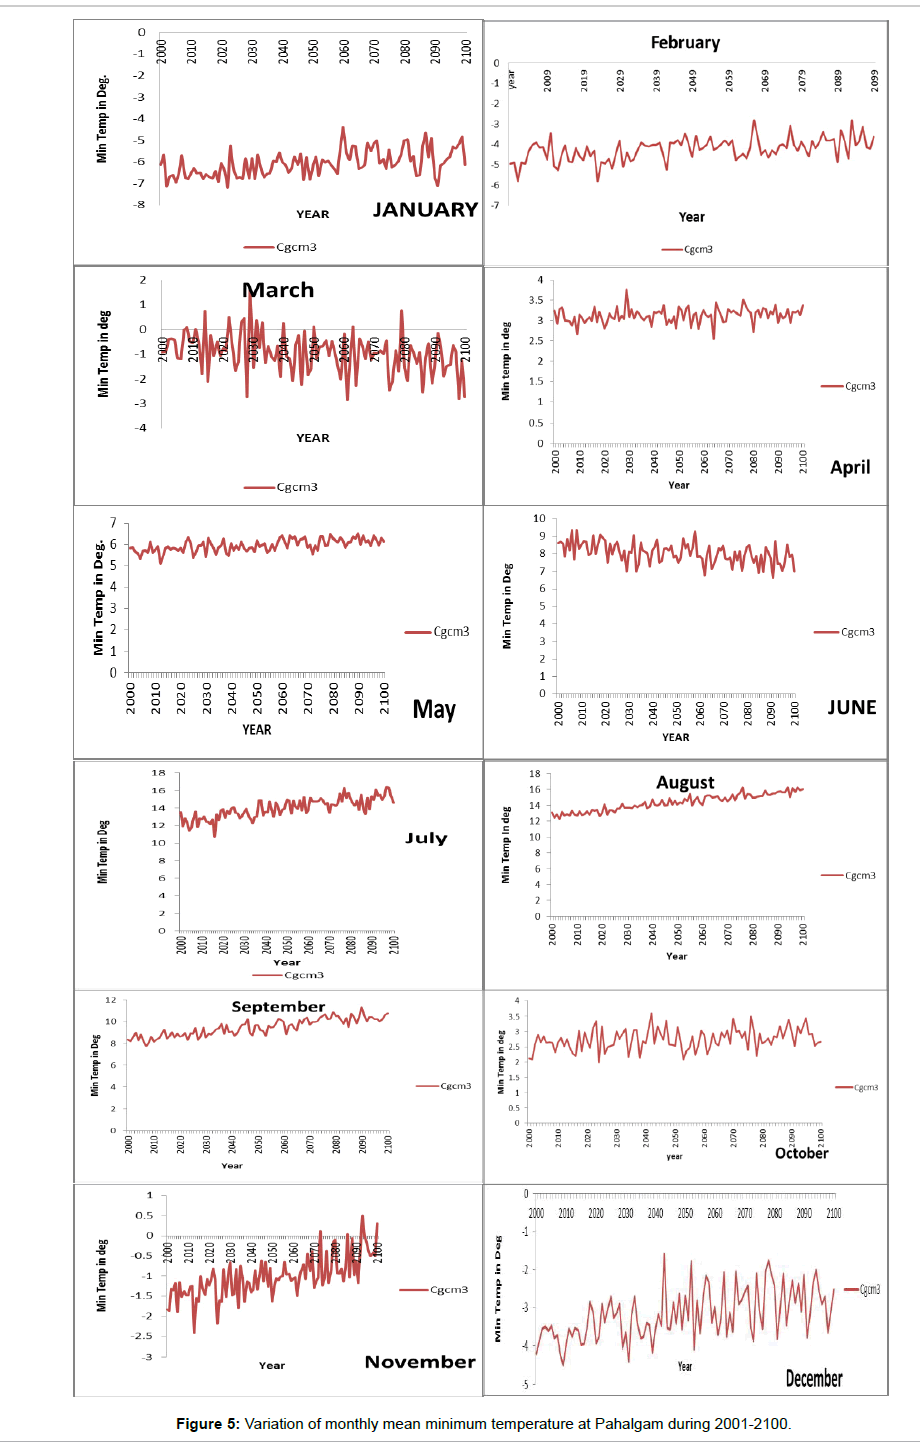
The observed data sets of mean monthly maximum and minimum temperatures and total monthly precipitation for the period 1978 to 2010 were used for calibration purposes, that is, to establish the regression equations. The validation of these regression equations was carried out using the monthly predictand data sets for the years 2011 to 2014. The results of validation are shown in Figure 2a shows the comparison between observed and predicted values of monthly precipitation using Global Circulation Model CGCM3 at Pahalgam meteorological observatory located in Lidder river basin. Figures 2b and 2c show that there is an excellent comparison between observed monthly mean maximum and minimum temperatures and those predicted by using regression equations of Table 2, for the validation period of 2011 to 2014.The regression relationships developed above, were used to predict the monthly precipitation, monthly mean maximum and minimum temperatures at Pahalgam meteorological observatory over the entire 21st century. These 100 year monthly projections of local weather parameters at Pahalgam are shown in Figures 3-5.
From Figure 3 It can be found out that the precipitation predicted by CGCM3 model showed an increasing trend for the months of March, May, August, September, October and December while as it showed decreasing trend for the months of January, February, April, June, July and November. The monthly mean maximum and minimum temperature as predicted by Global Circulation model CGCM3 for A1B scenario during 21st century are shown in Figures 4 and 5. This paper examines the applicability of MLR approach as a downscaling procedure for downscaling mean monthly maximum temperature, Minimum Temperature and precipitation from GCM outputs to local scale. The viability of this model is shown through the application in Lidder river basin region of west Himalayan region of India. The average annual maximum and minimum temperature showed an increase of 0.62°C and 0.76°C, respectively during the course of 21st century which is shown in Figure 6.
| GCM Model | Change in Precipitation % | Max. Temp Change (°C) | Min. Temp Change (°C) |
|---|---|---|---|
| CGCM3 | +18.07 | +0.62 | +0.76 |
Table 2: Variation of annual weather parameters at Pahalgam station of Lidder river basin during 21st century.
Conclusion
From the analysis of results, the following conclusions were drawn:
It was found out that the precipitation for CGCM3 model showed an increasing trend for the months of March, May, August, September, October and December while as it showed decreasing trend for the months of January, February, April, June, July and November . The maximum and minimum temperatures showed an increasing annual trend of 0.62 and 0.76 degrees, respectively during the course of 21st century and precipitation was found to be increasing by 18.07% annually. In order to reduce the discrepancy, different downscaling techniques can be used and further more GCMs and different scenarios can be used.
References
- UNFCCC (1992) United Nations framework convention on climate change, UN, New York.
- Mearns LO, Giorgi F, Whetton P, Pabon D, Hulme M, et al. (2003) Guidelines for use of climate scenarios developed from regional climate model experiments. Data Distribution Centre of the Intergovernmental Panel on Climate Change.
- Wilby RL, Charles SP, Zorita E, Timbal B, Whetton P, et al. (2004) Guidelines for the use of climate scenarios developedfrom statistical downscaling methods. Supporting material for the Intergovernmental Panel on Climate Change.
- Loaiciga HA, Maidment D, Valdes JB (2000) Climate change impacts in a regional karst aquifer, Texas, USA. J Hydrol 227: 173âÂ?Â?194.
- Bhat MS, Imran M, Kuchay NA (2007) Impact of tourism on land use/land cover - A case study of Lidder watershed of Kashmir valley. In: Rawat, M. S. S. (eds.) Management Strategies for the Indian Himalaya: Development and Conservation. Media House, Srinagar, Garhwal, pp: 61-71.
- Chow VT (1964) Handbook of applied hydrology: Tata Mc GrawâÂ?Â?Hill, New York, USA.
Relevant Topics
Recommended Journals
Article Tools
Article Usage
- Total views: 3120
- [From(publication date):
specialissue-2017 - Apr 05, 2025] - Breakdown by view type
- HTML page views : 2263
- PDF downloads : 857

