Research Article Open Access
Microstructural and Mechanical Properties of Cu-based Alloy Manufactured by Self-propagating High-temperature Synthesis Method
Amiour Y1*, Zemmour K1 and Vrel D21Laboratoire LEREC, Département de Physique, Université de Annaba, Algeria
2Laboratory LIMHP, UPR 1311 CNRS, Université Paris XIII, 99 Avenue J.-B. Clément, 93430 Villetaneuse, France
- *Corresponding Author:
- Amiour Y
Laboratoire LEREC
département de physique
Université de Annaba, Algeria
Tel: 213/038752758
E-mail: amiouryacin.@gmail.com
Received Date: August 16, 2016; Accepted Date: October 12, 2016; Published Date: October 20, 2016
Citation: Amiour Y, Zemmour K, Vrel D (2016) Microstructural and Mechanical Properties of Cu-based Alloy Manufactured by Self-propagating High-temperature Synthesis Method. J Powder Metall Min 5:144. doi:10.4172/2168-9806.1000144
Copyright: © 2016 Amiour Y, et al. This is an open-access article distributed under the terms of the Creative Commons Attribution License, which permits unrestricted use, distribution, and reproduction in any medium, provided the original author and source are credited.
Visit for more related articles at Journal of Powder Metallurgy & Mining
Abstract
Microstructure and properties of Cu1-xZn1-yAl1-z ranging through (0.29<X<0.30; 0.74<Y<0.75; and 0.83<Z<0.96) alloys obtained by the self- propagating high-temperature synthesis (SHS) were examined. The microstructural and mechanical properties were examined, respectively by X-ray diffraction, tensile tests and Brinell hardness and at last by scanning electron microscopy (SEM). The obtained results showed that the modification of composition lead to the formation of new phases. Therefore, this microstructure affects strongly the mechanical properties of the selected samples.
Keywords
SHS proceeding; CuZnAl Alloys; Hysteresis; Phase transformation; Psuedoelasticity
Introduction
Cu-based shape memory alloys are the most promising in practical use because of their low price and high recovery force (only secondary to Ni-Ti alloy) [1,2]. Among the Cu-based shape memory alloys (SMAs), Cu-Zn-Al alloys [2] have been selected in the present study. Properties linked to shape memory behavior of Cu-Al-Zn alloys, like martensitic transformation [3,4] and shape memory effect [5], have been thoroughly researched. Additionally, the properties like corrosion behavior [6], microstructure and mechanical properties of selected Cu- Al-Zn alloys have been investigated [7,8].
The phase diagram of Cu-Al-Zn system, due to technical importance, has been investigated by lots of researchers. At elevated temperatures, the high-temperature-matrix phase is disordered bcc (A2). The bcc phase undergoes two ordering transition upon cooling. The first transition occurring on cooling is a first- nearest- neighbour (nn) ordering reaction which results in a CsCl type superlattice, designated as β2. Further cooling induces the next-nearest-neighbour (nnn) ordering and the crystal structure has been suggested to become DO3 (Fe3Al type) superlattice, designated as β1 or L21 (Cu2MnAl type) superlattice, designated as β3 [9]. With temperature decrease, the austenite phase with the structures explained above, transforms N9R and N18R orthorhombic structures and M9R and M18R monoclinic long period structures, respectively. Atom sizes have an important effect on formation of ordered structures [10]. However, Wu et al. [11,12] have proposed that the perfect DO3 superlattice with binary superlattice sites would not be expected in the off stoichiometric CuZnAl alloy, and the resulting structure due to the nnn ordering could be L21 superlattice. The transformation from disordered A2 to B2 parent phase occurs during the process of quenching in water [13], whereas the transition from B2 to L21 can be suppressed by water quenching after solution treatment [14].
The purpose of this work is to study the microstructure and mechanical properties of shape memory alloys belonging to Cu-Al-Zn ternary system which confirmed the existence of shape memory effect in these alloys produced by non-conventional method like SHS technique for example, taking into account the fact that these properties are not well represented in other literature. Furthermore, the study of these properties (super elasticity, hardness) is hardly mentioned for SMAs developed by this young technique.
Experimental Techniques
Samples preparation
Pure elemental powders of copper (99.9%, average particle size <40 mesh), zinc (99.9%, average particle size <100 μm) and aluminum (99.9%, average particle size <325 mesh) were mechanically alloyed in a planetary ball mill (Fritsch P6), using two stainless steel vials. Each vial contained hardened steel balls (20 mm in diameter). The ballto- powder weight ratio (BPR) used was 15:1. The sealed vials were evacuated and then filled with argon to avoid oxidation of the mixture. The mixture was then mechanical milled for 30, and 60 min at a speed of 300 rpm. The alloy groups were identified as A, A1 (Cu70.6Zn25.9Al4), B, B1 (Cu69.99Zn26.1Al4.1) and C, C1 (Cu69.7Zn13.2Al17.1) (Table 1).
| Atomic composition | Cu70.6Zn25.9Al4 | Cu69.99Zn26.1Al4.1 | Cu69.7Zn13.2Al17.1 | |||
|---|---|---|---|---|---|---|
| Sample | A | A1 | B | B1 | C | C1 |
| Milling time (min) | 60 | 30 | 60 | 30 | 60 | 30 |
| tign (second) | 5 | 4 | 5 | 4 | 4 | 5 |
Table 1: Process parameters for synthesis of CuZnAl alloys.
The obtained powders were dried at 100°C in a programmable furnace (Thermolyne, Tmax=1200°C) and the mixtures were cold pressed uniaxial at pressure of 21 MPa. The square form the samples is obtained in a hurry take the shape of a plate of dimension (40 mm of length, 20 mm of width, and a thickness let us go from 1mm until 2 mm according to the mode which they will be used).
• It is noted that in this work, we has been used two kinds of press: the first with square matrix (intended for the tensile test, samples are A, B, and C). CARVER - max_ 12 t model 4386. The second, with a round die for samples designed for hardness testing. NOSHOK, Germany model INTERNATIONAL CRYSTAL LABORATORIES 12 tonnes E-Z Press
• The samples involved are A1, B1, and C1 (Table 1).
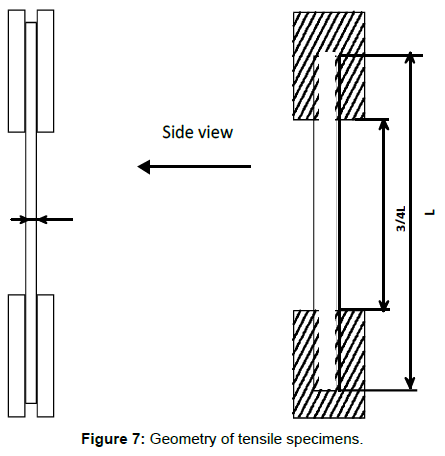
• (The geometry of the samples for the tensile test is shown in Figure 1).
The relative density of the green compacts is between 71% of theoretical density.
The sample must be of a certain length and starting density in order to allow a good propagation observation: the length has to be great enough so a clear distinction between ignition zone and normal SHS propagation could be made; a natural suggestion for the starting density would be to increase it as much as possible, to facilitate final sintering, but above 80% of the theoretical density, the thermal conductivity of the sample increases too much, and the ignition of the sample becomes difficult (in our experiment, we targeted an initial density ranging from 60 to 70%; the pressure is not measured, it is increased until the final length of the sample is reached). The reaction was ignited by heating a graphite plate connected to a welding transformer which can supply a current.
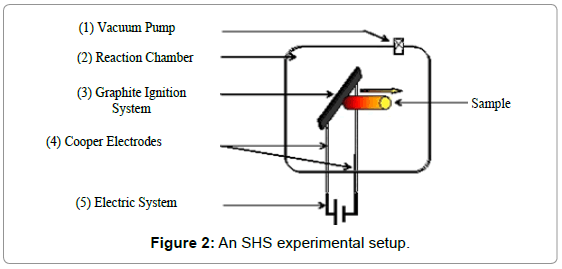
The as-prepared sample was attached to a sample holder at a welldefined distance (usually of about 2 mm) from the graphite plate. Before each experiment, primary vacuum at room temperature was achieved by pumping for about 2 h. The reaction chamber used in the present study is shown schematically in Figure 2. The combustion reaction was ignited by heating the top surface of the compact for a few seconds by passing an electric current (100-200A) through the graphite plate and the temperatures at which ignition occurs were measured using a thermocouple (R type). Samples were then cut vertically, impregnated in a resin, and polished.
Samples characterization
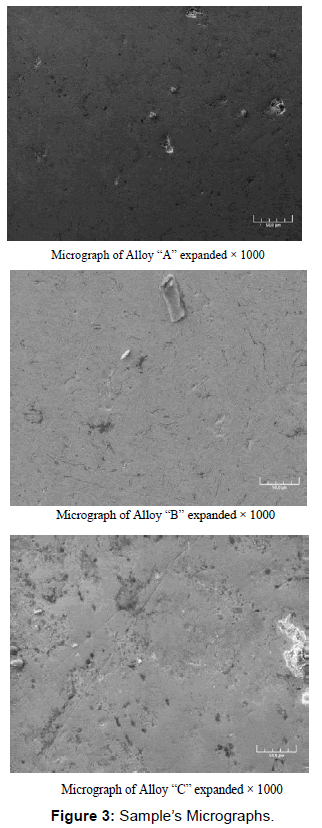
The characterization of samples was followed by X-ray diffraction (XRD) using INEL XRG3000, diffractometer equipped with Cu-Kα radiation (λCu=0.15406 nm) in a (θ-2θ) Bragg-Brentano geometry. The tensile tests were carried out with room temperature on a machine (“INSTRON” type 6025 with power struggle about 10 tons) equipped with a cell of force of 100 kN. The acquisition of the various parameters (which are the force applied and the deformation of the test-tube) are makes by a Pc. At last the samples were subjected to analysis by scanning electron microscopy (JEOL, Model JSM 6400F) (Figure 3).
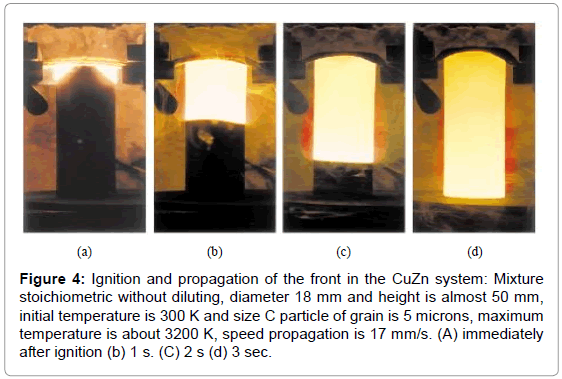
First, the ignition tests on several samples were performed by varying the current intensity from 50 to 65 A. Thus, we studied the combustion wave ignition and propagation manifesting the reaction runs in the sample. The tests were performed to optimize experimental conditions that could allow the formation of a combustion wave and the physicochemical transformations. Moreover, pictures of the combustion wave propagation were simultaneously taken with a video camera that indicated the ignition and reaction duration. We found that the reaction ignition with the white coloring is within 0-5 s and the wave propagation is within 3-7 s. such as Figure 2 illustrates. The flame reaction started after white coloring of the surface that indicated the temperature higher than 1200°C. The exothermic chemical reaction was propagating in a stable mode along the sample until complete consumption of the reagents was observed after 15 s (Figure 4).
Figure 4: Ignition and propagation of the front in the CuZn system: Mixture stoichiometric without diluting, diameter 18 mm and height is almost 50 mm, initial temperature is 300 K and size C particle of grain is 5 microns, maximum temperature is about 3200 K, speed propagation is 17 mm/s. (A) immediately after ignition (b) 1 s. (C) 2 s (d) 3 sec.
Results and Discussion
Microstructure
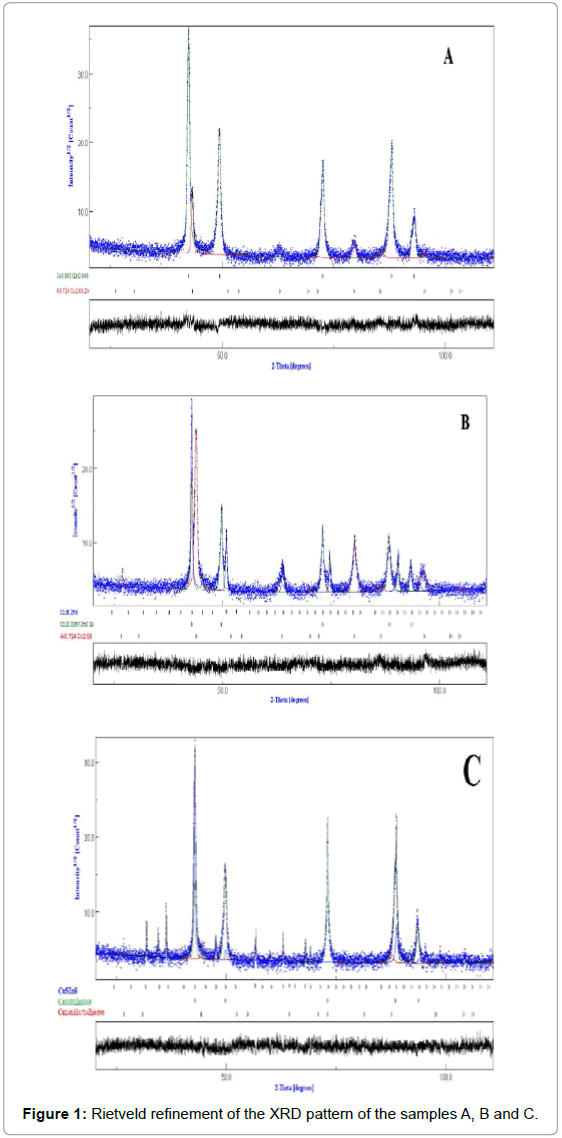
Since X-ray diffraction powder patterns of the samples A, B and C are composed of a large number of overlapping reflections, the Rietveld’s analysis based on structure and microstructure refinements [15,16] has been adopted for precise determination of several structural and microstructural parameters. The Rietveld method employs a leastsquares procedure to compare Bragg intensities and those calculated from a possible structural model. In the first step of refinement, the global parameters, such as background and scale factors, were refined. In the next step, the structural parameters such as lattice parameters, profile shape and width parameters, preferred orientation, asymmetry, isothermal parameters, atomic coordinates, and site occupancies were refined in sequence. The fitting quality of the experimental data is assessed by computing the parameters such as the ‘goodness of fit, χ2, and the R factors (Rp=profile factor, RB=Bragg factor, and RF=crystallographic factor) [15]. When these parameters reached their minimum value, the best fit to the experimental diffraction data is achieved, and the crystal structure is regarded as satisfactory [15].
Figure 4 shows the Rietveld refinement of XRD patterns Cu-Al-Zn samples at room temperature. As shown in Figure 1, in sample A, only two phases can be indexed with cubic structure. However for the samples B and C, other additional peaks appear indicating the formation of a new phase. The new phase can be identified as Cu5Zn8 phase with facecentered cubic structure. We note that the shape memory effect (SME) observed in these alloys was always accompanied with the presence of a major CuZnAl phase. The crystal lattice parameters, grain size and amount of each phase in samples deduced from Rietveld refinement are listed in Table 2.
| Phases | a (A°) | d (nm) | <σ2>1/2 (%) | Amount (%) | |
|---|---|---|---|---|---|
| A | Cu0.0951Zn0.049 | 3.6595 | 97.75 | 0.149 | 79.36 |
| Cu2.68Al0.724Zn0.596 | 5.8312 | 119.74 | 0.45 | 20.65 | |
| B | Cu5Zn8 | 8.8661 | 109.44 | 0.120 | 45.74 |
| Cu0.0951Zn0.049 | 3.6385 | 120.33 | 0.098 | 41.14 | |
| Cu2.68Al0.724Zn0.596 | 5.8240 | 113.37 | 0.126 | 13.11 | |
| C | Cu5Zn8 | 8.8659 | 112.042 | 0.082 | 52.41 |
| Cu0.0951Zn0.049 | 3.6528 | 107.115 | 0.101 | 42.63 | |
| Cu2.68Al0.724Zn0.596 | 5.7886 | 105.998 | 0.122 | 04.96 |
Table 2: a: lattice parameter; d: crystallite size, <σ2>1/2: r.m.s microstrain.
Mechanical analysis
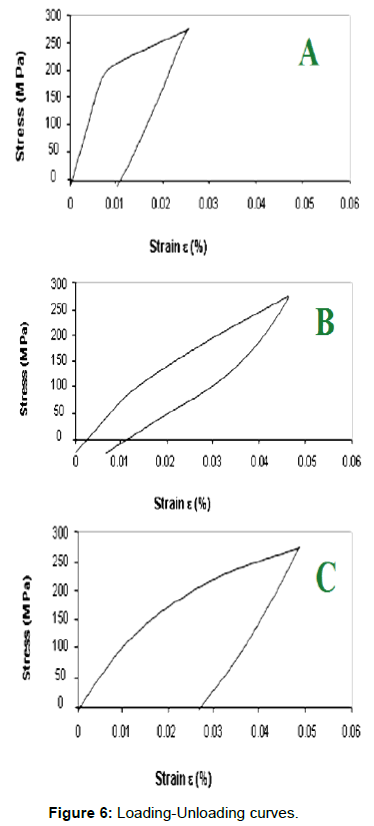
The as-cast samples A, B and C have been first subjected to tensile test in order to determine the maximum value of the unit loading to render evident the shape memory effects and the pseudoelastic behaviour. The A, B and C samples presented similar values of the tensile strength, ranging between 220 MPa and 300 MPa. After that, the sample A was subjected to loading-unloading cycles on the tensile testing machine at a temperature of 20°C.
Figure 5 shows the loading-unloading curves of alloys with 0.06% pre-strain at room temperature. The sample A show that for a unit loading of 300 MPa close to the run-out limit on this alloy, a permanent strains É?p of about 1% have been obtained. This strain is much lowers then the value of 6% which can be obtained for a Ni-Ti-Fe alloy stressed under the same conditions [17], is close to the value specific to the Cu- Zn-Al alloys [18]. The sample B shows, after the first tensile loadingunloading cycle, a pseudoelastic curve with a total specific elongation of É?t=4% and a pseudo-elastic annealing with É?r=3.33% and a plastic over strain É?p=0.77%. As one can notice, a 0.20% increase of Zn and 0.10% increase of Al concentration as compared to the A alloy result in an improvement of the pseudoelastic parameters (Figure 6).
The C sample subjected to tensile loading-unloading tests showed a characteristic curve with a plastic overstrain É?p=1.52% (which is higher than the values obtained for the A and B alloys), as well as a non-linear elastic recoverable strain É?r=1.48%, which is smaller than the one for the B alloy, get higher than the one for the A alloy.
After the first tensile loading-unloading cycle samples from A, B, and C, alloys have been subjected to a dilatometric analysis within temperature ranger 20-140°C after having previously been tensile strained up to values of the tensile unit loading lower than the breaking strain and to values corresponding to the permanent strain (É?p) of about 1%. Obviously, it follows that this alloy shows no shape memory effect within the positive temperature range, but this effect might be present at negative temperatures, its critical transition points being placed below 0°C. This hypothesis is also backed up by the aspect of the loading-unloading curve presented in Figure 5, which shows a typical pseudoelastic twinning curve usually resulting within the austenitic temperature range exceeding the critical temperature Md corresponding to the maximum temperature of stress induced martensite (SIM).
The significant changes done on the level of the concentration of the components (Zn, Al) as compared to the A and B alloys, lead to the drift of the critical transition points within the positive temperature range, and therefore to the occurrence of a shape memory effect (Figure 7).
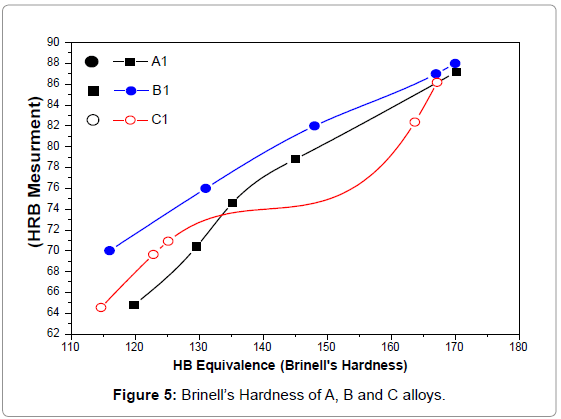
Figure 5 shows the Brinell hardness of A1, B1 and C1 alloys. One observes that the plastic deformation and the hardening treatment did not result in a significant modification of the values and critical points as compared to the as-cast state, indicating the homogenisation of alloys.
Conclusion
For the studied Cu-Zn-Al alloys, a narrow-range modification of the stoichiometry (chemical composition) does not result in important alteration of the unit tensile loading, but it leads to significant differences with respect to the pseudoelastic properties and shape memory effect:
- Both the A and B alloys present a pseudoelastic austenitic twinning curve at the room temperature and do not show a shape memory effect at positive temperatures.
- The increasing of Zn concentration to 13%wt and Al concentration to 12.9%wt. results in the shape memory alloy (C) within the positive temperature range (0-140°C).
References
- Creuziger A, Crone WC (2008) Grain Boundary Fracture in CuAlNi Shape Memory Alloys. Mater Sci Eng A 498: 404-411.
- Xiao Z, Li Z, Fang M, Xiong S, Sheng X, et al. (2008) Effect of processing of mechanical alloying and powder metallurgy on microstructure and properties of Cu-Al-Ni-Mn alloy Mater Sci Eng A 488: 266-272.
- Xu H, Tan S (2005) Calorimetric investigation of a Cu-Zn-Al alloy with two way shape memory. Scripta Metallurgica et Materialia 33: 749-754.
- Pelegrina JL, Romero R (2000) Calorimetry in Cu-Zn-Al alloys under different structural and microstructural conditions. Materials Science and Engineering A 282: 16-22.
- Pons J, Masse M, Portier R (1999) Thermomechanical cycling and two-way memory effect induced in Cu-Zn-A. Materials Science and Engineering A 273-275: 610-615 .
- Ahmed MM (2006) Corrosion Behaviour of Zn-Al-Cu Alloy in HCl Solution and its Inhibition. Portugaliae Electrochimica Acta 24: 1-22.
- Lojen G, Anzel I, Kneissl A, Krizman A, Unterweger E, et al. (2012) Microstructure of rapidly solidified Cu-Al-Ni shape memory alloy ribbons. Journal of Materials Processing Technology 162-163: 220-229.
- Gomidzelovic L, Pozega E, Kostov A, Vukovic N (2014) Materials Testin 56: 486-489.
- Kayali N, Zengin R, Adigüzel O (2000) Influence of aging on transformation characteristics in shape memory CuZnAl alloys .Metal Mater Trans A 31: 349-354.
- Eskil M (2000) Master Thesis, Firat University, Elazig, Turkey (in Turkish).
- Wu MH, Perkins J, Wayman CM (1989) Long range order, antiphase domain structures, and the formation mechanism of α1 (“Bainite”) plates in A Cu-Zn-Al alloy Acta Metall 37: 1821-1837.
- Wu MH, Wayman CM (1991) Scr Metall Mater 25: 1635-1640.
- Leu SS, Hu CT (1991) The aging effect on Cu-Zn-Al shape memory alloys with low contents of aluminum Metall Trans A. Phys Metall Mater Sci 22A: 25-33.
- Roh DW, Lee ES, Kim YG (1992) Metall Trans A Phys Metall Mater Sci 23A: 2753-2760.
- Rietveld HM (1969) A profile refinement method for nuclear and magnetic structures.J Appl Crystallogr 2: 65-71.
- Young RA, Wiles DB (1982) Profile shape functions in Rietveld refinements. J Appl Crystallogr. 15: 430-438.
- Duering TW, Melton KN, Stockel D, Wayman CM (1990) London Buttreworth- Heinemann.
- Patoor E, Berveiller M (1994) Paris Editions Hermès.
Relevant Topics
- Additive Manufacturing
- Coal Mining
- Colloid Chemistry
- Composite Materials Fabrication
- Compressive Strength
- Extractive Metallurgy
- Fracture Toughness
- Geological Materials
- Hydrometallurgy
- Industrial Engineering
- Materials Chemistry
- Materials Processing and Manufacturing
- Metal Casting Technology
- Metallic Materials
- Metallurgical Engineering
- Metallurgy
- Mineral Processing
- Nanomaterial
- Resource Extraction
- Rock Mechanics
- Surface Mining
Recommended Journals
Article Tools
Article Usage
- Total views: 11810
- [From(publication date):
December-2016 - Jul 11, 2025] - Breakdown by view type
- HTML page views : 10869
- PDF downloads : 941
