Research Article Open Access
Microemulsification-Based Method: Coupling with Separation Technique
Gabriela Furlan Giordano1,2, Karen Mayumi Higa1,2, Adriana Santinom1,2, Angelo Luiz Gobbi1, Lauro Tatsuo Kubota2,3 and Renato Sousa Lima1,2*
1Laboratory of Microfabrication , National Nanotechnology Laboratory , National Center for Research in Energy and Materials, Campinas , Sao Paulo, Brasil
2Instituto of Chemistry , State University of Campinas, Campinas, Sao Paulo, Brasil
3Instituto National Science and Technology Bioanalytics, Campinas, Sao Paulo, Brasil
- *Corresponding Author:
- Renato Sousa Lima
Laboratory of Microfabrication
National Nanotechnology Laboratory
National Center for Research in Energy and Materials
Campinas , Sao Paulo 13083-970, Brasil
Tel: +55 19 3512 3566
E-mail: renato.lima@lnnano.cnpem.br
Received date: July 07, 2015; Accepted date: July 21, 2015; Published date: July 28, 2015
Citation: Giordano GF, Higa KM, Santinom A, Gobbi AL , Kubota LT, et al. (2015) Microemulsification-Based Method: Coupling with Separation Technique.J Anal Bioanal Tech 6:261 doi:10.4172/2155-9872.1000261
Copyright: © 2015 Giordano GF, et al. This is an open-access article distributed under the terms of the Creative Commons Attribution License, which permits unrestricted use, distribution, and reproduction in any medium, provided the original author and source are credited.
Visit for more related articles at Journal of Analytical & Bioanalytical Techniques
Abstract
The outcomes described herein outline the potentiality of the microemulsification-based method (MEC) for development of rapid testing (point-of-use) technologies. MEC was recently proposed by these authors for analytical determinations wherein the detection is conducted in solution with naked eyes. It relies on effect of analyte over the colloid thermodynamics by changing the minimum volume fraction of amphiphile needed to generate microemulsions (MEs) (ΦME), which represents the analytical response of the method. We report in this paper the successfully coupling of MEC-based detection with gas diffusion separation. Such result extends the field of application of MEC in analytical sciences by improving its selectivity. One custom-designed module was constructed on PTFE for the separation measurements. It was utilized in combination with MEC for determining water in ethanol fuels using water/ n-propanol/oleic acid MEs and water-rich compositions. In this situation, accurate direct determinations by MEC are not possible. In addition, further studies on analytical performance and robustness of MEC by using n-propanol amphiphile are described. The method was robust as regards to deviations in dispersion preparing and changes in temperature. Concerning the analytical performance, the analytical curves presented wide linear range with limits of linearity of up to 70.00% v/v ethanol to water (ΦE). The limits of detection (S/N=3) were of 1.03%, 7.21%, and 0.68% v/v ΦE for compositions with water- (region A) and oil-rich (region C) domains as well as equal volumes of water and oil phases (region B), respectively. With respect to the regions A and B, the analytical performance stressed herein exhibited best linearity and comparable sensitivities when compared to these levels reached with ethanol amphiphile (our first publication on MEC) rather than n-propanol.
Keywords
Point-of-care; Rapid test;Colloid; Interfacial tension; In situ analysis
Introduction
Abbreviations
ME: Microemulsion; AP: Amphiphile; W: Hydrophilic phase of dispersions; O: Hydrophobic phase of dispersions; ΦME: Minimum volume fraction of amphiphile needed to get ME; ΦO: Volume fraction of oil to water; ΦE: Volume fraction of ethanol to water; ΦW: Volume fraction of water to ethanol; ΔΦ: Absolute error determined for ΦE
Point-of-use devices represent currently a key field in quantitative analytical sciences. These platforms are low-cost, fast, portable, and simple to use eliminating the necessity for qualified operators [1]. Rapid tests enable in-situ measurements presenting substantial social and economic implications at industry, environment, and medicine [2-9]. One potential output to perform point-of-use analyses is the accomplishment of the tests in solution with naked eye detection using disposable systems. It allows the determination of different analytes from the use of modified nanomaterial [10]. Naked eye methods bypasses the use of instrumental readers, an essential feature for in-situ technologies. Furthermore, the analyses in solution surpass precisionrelated downsides when making the tests on substrates such as paper [6,9]. In this case, the diverse paper substrates that are employed to fabricate the devices affect the flow rates and interactions with analytes [10].
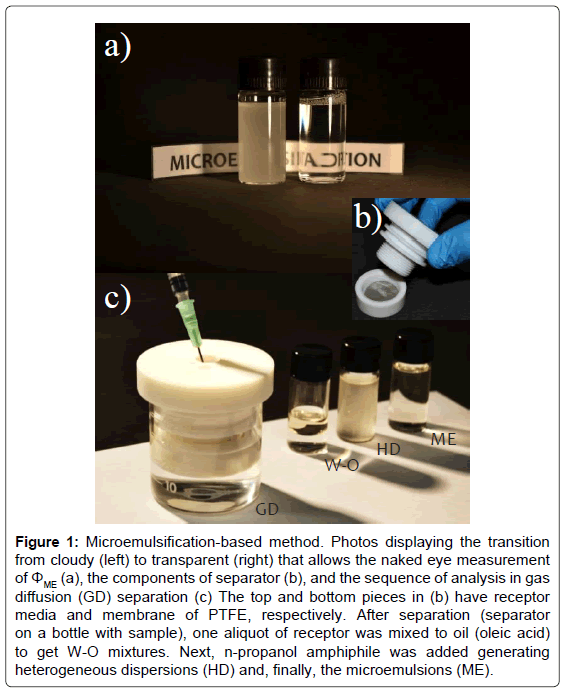
This paper reports further investigations and application of the microemulsification-based method (MEC), a point-of-use platform that was recently proposed by these authors [11]. It relies on solutionbased- detection with naked eyes. In contrast with colorimetric tools [10], MEC response depends on colloid thermodynamics by relying on effect of analyte on the entropy of emulsions or Winsor systems. It changes the formation of thermodynamically stable dispersions, the microemulsions (MEs). The minimum volume fraction of amphiphile (AP) needed to get MEs (ΦME) for a fixed water-oil ratio expressed the analytical signal of the method. The generation of nanodroplets in MEs (transparent) allows the naked eye detection of ΦME by monitoring the change of turbidity from the emulsions or Winsor systems (cloudy) as shown in Figure 1a. This cloudy-to-transparent conversion acts like a turning point in titrations, ensuring the visual measurement of ΦME and, therefore, not only screening analyses (positive/negative data) as the most of naked eye colorimetry platforms [10] as well as precise quantitative analyses [11]. The response in colorimetry changes with the intensity of colour or tonality. Herein, subjective uncertainties by personal and surrounding conditions are observed [12].
Figure 1: Microemulsification-based method. Photos displaying the transition from cloudy (left) to transparent (right) that allows the naked eye measurement of ΦME (a), the components of separator (b), and the sequence of analysis in gas diffusion (GD) separation (c) The top and bottom pieces in (b) have receptor media and membrane of PTFE, respectively. After separation (separator on a bottle with sample), one aliquot of receptor was mixed to oil (oleic acid) to get W-O mixtures. Next, n-propanol amphiphile was added generating heterogeneous dispersions (HD) and, finally, the microemulsions (ME).
MEC presents powerful aspects concerning the deployment of pointof- use tools. Such a method is straightforward, cheap, fast, portable, and provides precise analytical determinations with satisfactory precision, linearity, robustness, and accuracy. Lastly, volumes of approximately 20 μL for dispersions assure the visual measurement of ΦME [11]. It contributes for a low sample consuming.
The first outcomes achieved by MEC were promising with respect to its analytical performance [11]. Direct analyses based on analytical curves were conducted for determining monoethylene glycol in samples associated to the processing of liquefied natural gas and water in ethanol fuels. For this latter case, accurate direct determinations were obtained by employing oil-rich MEs and dispersions containing similar volumes of the water (W) and oil (O) phases. Nonetheless, accurate direct determinations were not verified when using water-rich MEs. Considering the excess of water in this composition, we supposed these results were because the ionic strength of the samples of ethanol fuel. Studies addressed in literature revealed the presence of NO3-, K+, Ca2+ (0.5 to 3.5 mg L-1) [13], Cu2+, Zn2+, Ni2+, and Fe3+ (8 to 57 mg L-1) in these samples [14].
We describe herein accurate determinations of water in ethanol fuels by MEC utilizing water-rich MEs. For this, the method was coupled with gas diffusion separation. It represents an important breakthrough by improving the reliability and selectivity of MEC, enlarging its range of application. In addition, further studies into analytical performance and robustness of MEC by using n-propanol AP are described. The robustness level was investigated as a function of deviations in dispersion preparing and changes in temperature.
Materials and Methods
Chemicals
Ethanol and n-propanol alcohols were supplied from Merck (Whitehouse Station, NJ) whereas oleic acid was obtained from Labsynth (São Paulo, Brazil). Deionized water (Milli-Q, Millipore Corp., Bedford, MA) was attained with resistivity no less than 18 MΩ cm.
Microemulsification
MEC routine relies on nature of sample. The analyte can be added in W, AP, or O phase for generation of MEs according to the sample polarity. As a consequence, MEC is applicable to polar, nonpolar, and amphiphile media. When the analyte is dipped into W phase, for instance, W phase solutions are initially obtained changing the concentration of analyte that is added in polar solvent. These solutions are used to attain W-O mixtures for a fixed volume ratio. Following, the microemulsification is made by adding pure AP until cloudy-totransparent transition. The measured values of ΦME are, then, employed to construct the analytical curve. For application, the sample acts directly like W phase with the intent to stabilization of the dispersions. Finally, the analyte content is obtained through the linear regression line equation.
The detection of ΦME was conducted with naked eyes. Dispersions were prepared in Eppendorf® tubes with the aid of micropipette at room temperature (23°C). AP-added W-O mixtures were vigorously shaken for microemulsifications. The values of ΦME were detected by gradually transferring the amphiphile in a unique tube with the W-O mixture. The first attempt in finding ΦME was intended only to obtain an approximate analytical response. This step took approximately 5 min whereas the other attempts lasted less than 2 min.
Dispersions were composed of water (W), oleic acid (O), and n-propanol hydrotrope (AP phase). Ethanol analyte was added in W phase to get the analytical curves as the previously described experimental procedure. Such a parameter does not take into account the AP volume. The fraction of analyte was expressed by the volume fraction of ethanol to water (ΦE).
Phase behavior
ΦME was obtained in diverse compositions of water/n-propanol/ oleic acid MEs to attain a ternary phase diagram and, thus, to evaluate the phase behavior of dispersions. For this, the W-O mixtures were prepared using different volume fractions of oil to water (ΦO). W-O mixtures had a volume of 600 μL in all of the measurements addressed in this paper.
Analytical performance and robustness level
Analytical curves were obtained to compare the n-propanolobserved results with those achieved by ethanol amphiphile (data in our first publication) [11].
The curves ensured the (i) calculation of merit figures (correlation factor, R2, analytical sensitivity, and limit of detection, LOD) in determination of water in ethanol fuels and the (ii) evaluation of robustness level as discussed below by establishing a relationship between ΦME signal and ΦE content. Confidence intervals for each concentration level were calculated for α=0.05 and n=4 in all of the cases. In both tests of analytical performance and robustness, analyses were conducted for three compositions of W-O mixture, namely: water- (region A) and oil-rich (region C) domains and dispersions based on equal volumes of W and O phases (region B). W-O mixtures were prepared with 5.00% (A), 50.00% (B), and 95.00% v/v ΦO (C).
The robustness was mathematically expressed by absolute errors calculated for ΦE (ΔΦ, % v/v) in determination of ethanol in water. These errors were because deviations in preparation of W-O mixtures and alterations in temperature.
Analytical curves were obtained to calculate ΔΦ by taking up (i)
Application
MEC was coupled to gas diffusion separation seeking to improve its accuracy. This separation consists of separating volatile species from sample (donor media) to a receptor solution through gas permeable membranes [15]. Usually adopted membranes are hydrophobic and microporous. During the volatilization, a gas thin layer is stored in the micropores. Afterwards, the analyte diffuses through this layer that separates the donor and receptor solutions.
One custom-designed separation module was constructed on PTFE as approached in Figure 1b. It was utilized for determination of water in ethanol fuels using water-rich MEs (region A: 5.00% v/v ΦO). The routine of analysis is generically shown in Figure 1c. To construct the analytical curve, deionized water (receptor) and PTFE membrane were placed inside the separation module. We inserted such a module manually on an external glass bottle containing ethanol standard (donor medium). The hydrophobic membranes were in contact with the donor and receptor solutions. The volumes of donor and receptor were 17 and 2 mL, respectively. Separations were based on diffusion of ethanol gas through membrane from donor to receptor [15]. The tests were made at room temperature (23°C) under two conditions of time: 5 and 20 min. To accelerate the homogenization of volatized ethanol in receptor medium, a magnetic bar was inserted inside the extraction module. The stirrer was placed under the bottle with sample whereas the stirring was conducted with 500 rpm rotation speed. Subsequently, MEC was accomplished (protocol addressed above) using receptor water, oleic acid, and n-propanol as W, O, and AP phases of the dispersions, respectively, with 5.00% v/v ΦO (570 μL of receptor and 30 μL of oleic acid to get W-O mixtures). Lastly, the microemulsification processes were conducted by adding n-propanol. Analytical curve was expressed in terms of ΦE. This parameter allowed us to indirectly calculate the volume fractions of water to ethanol fuel (ΦW). For application, the samples were dipped into the glass bottles (donor media) acting as W phase.
The conductivity of samples was measured by AJ Micronal AJX- 522 (Sao Paulo, Brazil). Statistical evaluation between the data attained by MEC and Karl Fischer titration (Metrohm, Titrando 890, Herisau, Switzerland) was made by Student’s t-tests at 95% confidence level to assess the accuracy.
Results and Discussions
Phase behaviour
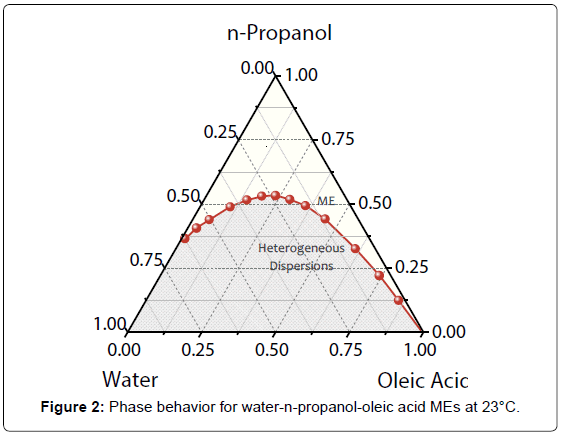
Phase diagram of dispersions composed of water/n-propanol/ oleic acid at 23°C is exhibited in Figure 2. The regions above and below the binodal curve correspond to MEs and unstable dispersions, respectively. Average values of ΦME (n=4) were used to plot the diagram with confidence intervals of 0.18 up to 0.39% v/v.
Ethanol hydrotrope was employed as AP phase in ours previous investigations [11]. Taking up the phase behavior for water/ethanol/ oleic acid at 23°C, n-propanol AP generated an efficiency higher (it requires less ΦME for microemulsification) than that obtained with ethanol in the region of water-rich dispersions. In this region, the global average of ΦME for n-propanol was approximately 80% of the value attained with ethanol. It is in accordance with Traube’s rule that defines an increase in surface activity with the size of AP hydrophobic chain, reducing the interfacial tension values [16]. Accordingly, the decrease observed in ΦME for n-propanol was expected. For MEs based on oil-excess and similar volumes of W and O phases, the efficiency was almost the same for ethanol and n-propanol amphiphiles.
Analytical performance
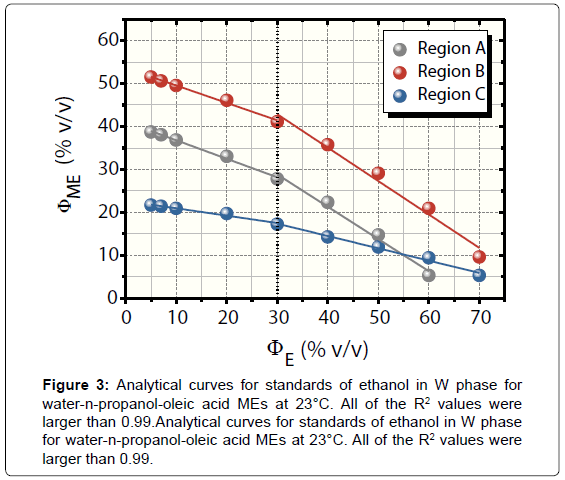
Figure 3 shows analytical curves for standards of ethanol in W phase at 23°C in the A, B, and C regions. The curves presented wide linear range with limits of linearity of 70.00% v/v ΦE for B and C and 60.00% v/v ΦE for A.
The regions A and B presented the best sensitivities and detectabilities. All of the curves had an increase in analytical sensitivities upon 30.00% v/v ΦE. Their values were: -0.43 and -0.75 for A, -0.41 and -0.78 for B, and -0.17 and -0.29 for region C. Lastly, the LODs (S/ N=3) were of 1.03%, 0.68%, and 7.21% v/v ΦE for A, B, and C regions, respectively. Confidence intervals ranged from 0.09 to 0.40% v/v.
It is important to highlight the differences between the tests for determining water in ethanol fuel using ethanol (our previous publication) [11] and n-propanol AP (this paper). In first case, the analyte in analytical curves was water that was added in AP instead W phase. The curves correlated ΦME and ΦW. For application, the samples acted as AP. In addition, the O phase was chlorobenzene, a much more hazardous solvent than oleic acid as regards to safety and environment risks.
With respect to the regions A and B, the analytical performance stressed herein exhibited best linearity and comparable sensitivities when compared to these levels reached with ethanol AP [11]. In contrast, meanwhile, the data attained with ethanol were best for region C, presenting limit of linearity of 70.00% v/v ΦW, analytical sensitivity of 2.04, and LOD equal to 0.32% v/v ΦW.
The negative deviations in ΦME shown in Figure 3 are due to progressive addition of ethanol in W phase, requiring decreasingly AP volumes for microemulsifications. Such a decrease in ΦME by building up ethanol in W phase relates to the increase in surface activity phenomenon. It favours the thermodynamic stabilization of the dispersions by diminishing the interfacial tension [17].
Robustness
This parameter is essentially crucial for the development of pointof- use technologies by considering the accomplishment of in-situ assays wherein the effect of interferents on analytical response is critical. MEC was satisfactorily robust regarding deviations in preparing of W-O mixtures and changes in temperature.
Assuming the theory of dispersions with non-ionic surfactants, the surface activity depends mainly on temperature. Such a parameter reduces the polar group solvation and increases the number of nonpolar chain conformations of the amphiphile, diminishing and raising the surface activity, respectively [17]. Besides, this phenomenon changes with temperature owing to deviations in AP monomeric solubility. It alters the surface activity by modifying the fraction of amphiphile adsorbed at W-O interfaces. Therefore, ΦME do not show a simple and generic relationship with the temperature. In relation to deviation in W-O ratio, it affects the ΦME because the changes in surface pressures which are responsible for decreasing the surface activity and, thus, the interfacial tension.
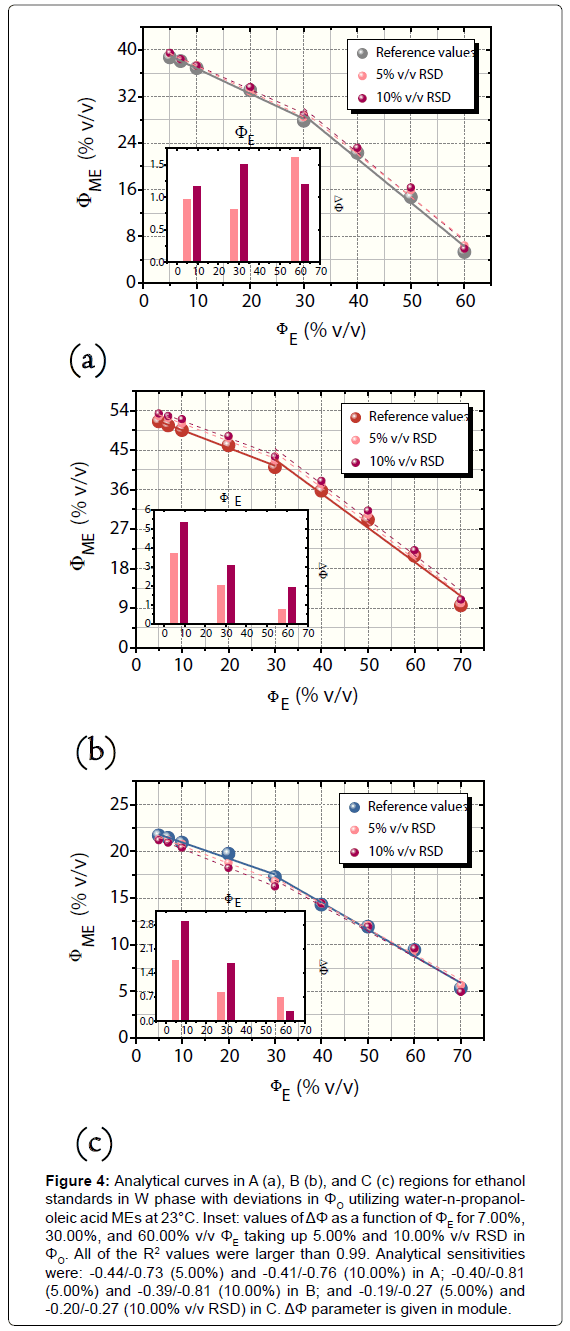
For the procedure of W-O mixture preparation in which ΦO was increased by 5.00% and 10.00% v/v, the values of ΔΦ were positive for A and B and negative for C, with exception of the errors obtained in relation to 60.00% v/v ΦE (reference value). The absolute error values changed among -0.31% and +5.39% v/v with a global average (in module) of 1.00 ± 0.94% v/v (n=18) and averages for each region (n=6) equal to 1.22 ± 0.24% (A), 2.85 ± 1.28% (B), and 1.39 ± 0.76% v/v (region C). Figure 4 illustrates the curves related to this robustness investigation as well as the calculated values of ΔΦ for A, B, and C regions. The confidence intervals ranged from 0.08 to 0.42% v/v ΦME.
Figure 4: Analytical curves in A (a), B (b), and C (c) regions for ethanol standards in W phase with deviations in ΦO utilizing water-n-propanololeic acid MEs at 23°C. Inset: values of ΔΦ as a function of ΦE for 7.00%, 30.00%, and 60.00% v/v ΦE taking up 5.00% and 10.00% v/v RSD in ΦO. All of the R2 values were larger than 0.99. Analytical sensitivities were: -0.44/-0.73 (5.00%) and -0.41/-0.76 (10.00%) in A; -0.40/-0.81 (5.00%) and -0.39/-0.81 (10.00%) in B; and -0.19/-0.27 (5.00%) and -0.20/-0.27 (10.00% v/v RSD) in C. ΔΦ parameter is given in module.
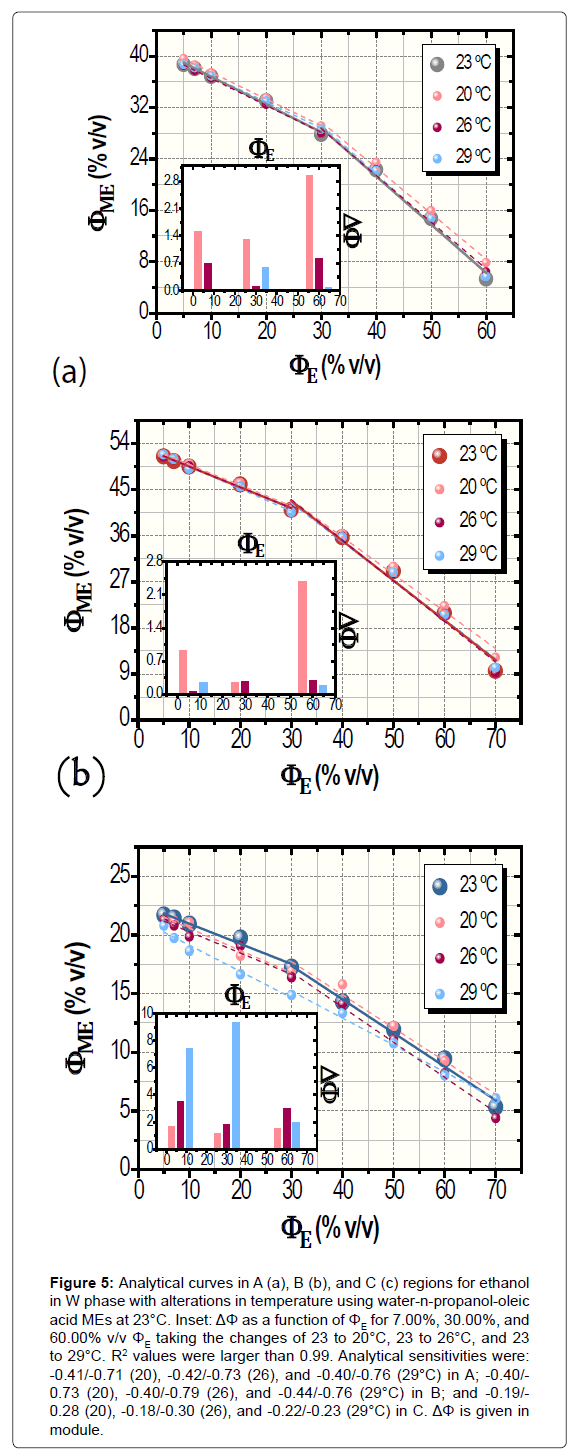
Resulting data showing the temperature-function robustness, in turn, are depicted in Figure 5. Confidence intervals were of 0.09 to 0.56% v/v ΦME whereas ΔΦ ranged from +0.05% up to -9.46% v/v. Its global average (in module) was 1.69 ± 0.84% v/v (n=27) with averages for each investigated region (n=9) of 0.92 ± 0.61% (A), 0.59 ± 0.47% (B), and 3.56 ± 1.91% v/v (C). Herein, ΔΦ had unsystematically diverse positive and negative values.
Figure 5: Analytical curves in A (a), B (b), and C (c) regions for ethanol in W phase with alterations in temperature using water-n-propanol-oleic acid MEs at 23°C. Inset: ΔΦ as a function of ΦE for 7.00%, 30.00%, and 60.00% v/v ΦE taking the changes of 23 to 20°C, 23 to 26°C, and 23 to 29°C. R2 values were larger than 0.99. Analytical sensitivities were: -0.41/-0.71 (20), -0.42/-0.73 (26), and -0.40/-0.76 (29°C) in A; -0.40/- 0.73 (20), -0.40/-0.79 (26), and -0.44/-0.76 (29°C) in B; and -0.19/- 0.28 (20), -0.18/-0.30 (26), and -0.22/-0.23 (29°C) in C. ΔΦ is given in module.
In both of the cases of robustness assessing, the analytical sensitivities remained almost constant when compared to the curve at 23°C without deviations in ΦO. Indeed, the robustness of MEC was outstanding. All of the values of analytical sensitivity are exhibited in legends of Figures 4 and 5.
Application
One potential factor for changing the signal of MEC is chemical interfering through modification of surface activity phenomenon. For example, a few samples associated to natural gas processing that presented diethylene and triethylene glycol in excess were not successful analyzed by MEC in our group to determine ethylene glycol. Hence, the development of alternatives for improving the MEC accuracy as regards to the presence of chemical interfering is necessary. In this case, a platform integrating gas diffusion separation and MEC detection was applied to test the adulteration of ethanol fuel by water utilizing analytical curve at 23°C and water-rich MEs. According to our preceding publication, direct determinations based on this composition did not generate accurate analyses as aforementioned [11].
The most usual adulteration of ethanol fuel is the excessive addition of water because the attained mixtures are colorless and do not present a distinctive smell. It produces loss of power and raise in fuel consumption rate [18]. Different methods were proposed for determination of water in ethanol fuels such as: i) near infrared spectrometry [19], ii) conductometry [20], iii) enthalpimetry [21], iv) cyclic voltammetry [22], v) photothermal detector [23], vi) ultrasonic propagation velocity [24], vii) evanescent field absorption spectroscopy [25], and viii) colorimetry [18].
The samples of ethanol fuel had 2.9 ± 0.7 μS cm-1 Considering this low conductivity, we suppose a decrease in amount of diffused ethanol vapour due to tonometry was not observed.
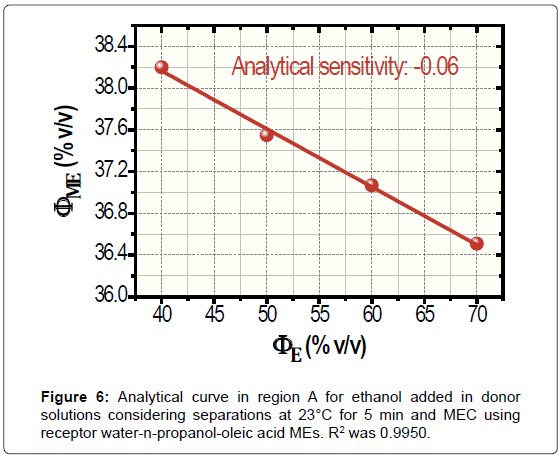
High concentrations of ethanol in water (donor media) were used to construct the analytical curve by taking two aspects: the low analyte content that is volatilized in gas diffusion separation and the poor detectabilidade of MEC. The resulting analytical curve at 23°C for a separation time of 5 min is portrayed in Figure 6. For ΦE bigger than 40.00% v/v, the limit of linearity was of 70.00% v/v. Thus, the samples were previously diluted 50.00% v/v to water for application once ethanol is found in fuel samples on fractions of around 95.00% v/v. Negative deviations in ΦME are because the progressive increase in ethanol fraction as well as happens in Figure 3. Confidence intervals were of 0.08% to 0.21% v/v ΦME.
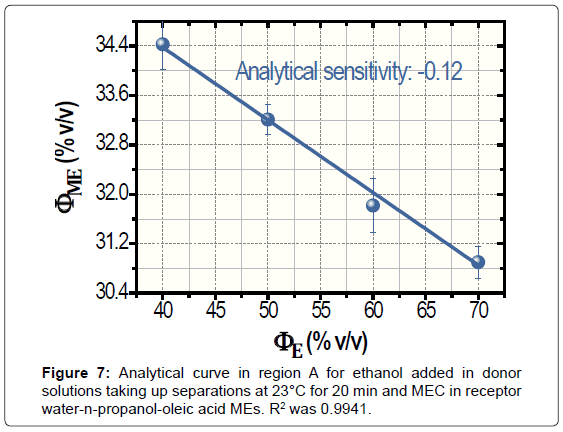
According to Figure 6, the analytical sensitivity was only -0.06. Ways to improve such a poor sensitivity were studied, namely, the increase in the time and temperature of separation. For the warming of donor solutions, the separator was immersed in thermostatted bath that was placed on the stirrer. Measurements at 40°C during 5 min produced non-linear data (not shown). Conversely, assays at 23°C for 20 min generated linear data with enhancement in analytical sensitivity, -0.12. The analytical curved for 20 min is shown in Figure 7. The values of ΦME reduced with the time of separation because the increase of volatilized ethanol in receptor media that is employed for the subsequent performing of MEC.
For application, gas diffusion separations at 23°C for 5 min generated accurate results at 95% confidence level despite the low sensitivity. This time was adopted by considering the gain in analytical frequency. The data recorded by Karl Fischer and MEC are demonstrated in Table 1 after correcting ΦE through dilution factor and its conversion in ΦW.
| Samples | Karl Fischer(% v/v, n = 3) | MEC (% v/v)(% v/v, n = 4) |
|---|---|---|
| F1 | 5.1 ± 0.1 | 5.1 ± 0.1 |
| F2 | 5.1 ± 0.1 | 5.2 ± 0.1 |
| F3 | 5.0 ± 0.1 | 5.0 ± 0.2 |
Table 1: Fractions of H2O (ΦW) in ethanol fuel (F1-F3) determined by Karl Fischer and MEC with gas diffusion separation.
Conclusion
In summary, the results stressed in this paper outline the potentiality of MEC for the deployment of point-of-use analytical technologies. The method was robust as regards to deviations in preparation of W-O mixtures and changes in temperature for the determination of ethanol in water. Furthermore, the successful coupling with gas diffusion separation extends the field of application of MEC in analytical sciences by improving its selectivity. Herein, other sample preparation methods could be used such as solid phase extraction. For the platforms integrating gas diffusion separation and MEC-based detection, the time showed to be a satisfactory parameter with the intent to increase the sensitivity. In this case, the microemulsification could be also made with greater volumes of dispersion. This fact helps for precision and accuracy by enhancing the gap among the values of ΦME for diverse concentrations of analyte.
Acknowledgment
Centro Nacional de Pesquisa em Energia e Materiais is recognized for its facilities. Financial support from the Fundação de Amparo à Pesquisa do Estado de São Paulo (FAPESP, Grant No. 2014/24126-6) is gratefully acknowledged.
References
- Yetisen AK, Akram MS, Lowe CR (2013) Paper-based microfluidic point-of-care diagnostic devices. Lab Chip 13: 2210-2251.
- Bissonnette L, Bergeron MG (2010) Diagnosing infections--current and anticipated technologies for point-of-care diagnostics and home-based testing. Clin Microbiol Infect 16: 1044-1053.
- Gubala V, Harris LF, Ricco AJ, Tan MX, Williams DE (2012) Point of care diagnostics: status and future. Anal Chem 84: 487-515.
- Chin CD, Linder V, Sia SK (2012) Commercialization of microfluidic point-of-care diagnostic devices. Lab Chip 12: 2118-2134.
- Hartman MR, Ruiz RC, Hamada S, Xu C, Yancey KG, et al. (2013) Point-of-care nucleic acid detection using nanotechnology. Nanoscale 5: 10141-10154.
- Hu J, Wang S2, Wang L, Li F3, Pingguan-Murphy B4, et al. (2014) Advances in paper-based point-of-care diagnostics. Biosens Bioelectron 54: 585-597.
- Song Y, Huang YY2, Liu X, Zhang X2, Ferrari M, et al. (2014) Point-of-care technologies for molecular diagnostics using a drop of blood. Trends Biotechnol 32: 132-139.
- Drain PK, Hyle EP2, Noubary F3, Freedberg KA2, Wilson D4, et al. (2014) Diagnostic point-of-care tests in resource-limited settings. Lancet Infect Dis 14: 239-249.
- Weaver W, Kittur H, Dhar M, Di-Carlo D (2014) Research highlights: microfluidic point-of-care diagnostics. Lab Chip 14: 1962-1965.
- Paterson S, de la Rica R (2015) Solution-based nanosensors for in-field detection with the naked eye. Analyst 140: 3308-3317.
- Lima RS, Shiroma LY, Teixeira AV, de Toledo JR, do Couto BC, et al. (2014) Microemulsification: an approach for analytical determinations. Anal Chem 86: 9082-9090.
- Hong JI, Chang BY (2014) Development of the smartphone-based colorimetry for multi-analyte sensing arrays. Lab Chip 14: 1725-1732.
- Munoz RAA, Richter EM, De-Jesus DP, Do-Lago CL, Angnes L (2004) Determination of inorganic ions in ethanol fuel by capillary electrophoresis. J Brazil Chem Soc 15: 523-526.
- Vieira EG, Soares IV, Dias Filho NL, da Silva NC, Garcia EF, et al. (2013) Preconcentration and determination of metal ions from fuel ethanol with a new 2,2'-dipyridylamine bonded silica. J Colloid Interface Sci 391: 116-124.
- Giordano GF, Vieira LC2, Gobbi AL2, Lima RS, Kubota LT3 (2015) An integrated platform for gas-diffusion separation and electrochemical determination of ethanol on fermentation broths. Anal Chim Acta 875: 33-40.
- Shaw DJ (1992) Introduction to colloid and surface chemistry. Elsevier Science, Butterworth Heinemann pp 48-53.
- Stubenrauch C (2009) Microemulsions: background, new concepts, applications, perspectives. John Wiley & Sons pp 1-30.
- Giordano GF, Ferreira DCM, Carvalho TR, Vieira LCS, Piazzetta MHO, et al. (2014) Portable platform for rapid and indirect photometric determination of water in ethanol fuel samples. Anal Methods 6: 9497-9502.
- Silva AC, Pontes LF, Pimentel MF, Pontes MJ (2012) Detection of adulteration in hydrated ethyl alcohol fuel using infrared spectroscopy and supervised pattern recognition methods. Talanta 93: 129-134.
- Ribeiro MS, Angnes L, Rocha FRP (2013) A simple and fast procedure for in situ determination of water in ethanol fuel. J Braz Chem Soc 24: 418-422.
- De Oliveira WA, Pasquini C (1984) Determination of water in ethanol and acetone by direct injection enthalpimetry based on the heat of dilution. Talanta 31: 82-84.
- Pereira PF, Sousa RMF, Munoz RAA, Richter EM (2013) Simultaneous determination of ethanol and methanol in fuel ethanol using cyclic voltammetry. Fuel 103: 725-729.
- Omido CR, Oliveira SL, Shiraishi RS, Magalhaes KF, Ferreira VS, et al. (2013) Quantification of water in ethanol using a photothermal transparent transducer. Sensor Actuat B Chem 178: 581-585.
- Figueiredo MKK, Costa-Felix RPB, Maggi LE, Alvarenga AV, Romeiro GA (2012) Biofuel ethanol adulteration detection using a ultrasonic measurement method. Fuel 91: 209-212.
- Xiong FB, Sisler D (2010) Determination of low-level water content in ethanol by fiber-optic evanescent absorption sensor. Opt Commun 283: 1326-1330.
Relevant Topics
Recommended Journals
Article Tools
Article Usage
- Total views: 14387
- [From(publication date):
October-2015 - Nov 21, 2024] - Breakdown by view type
- HTML page views : 9977
- PDF downloads : 4410

