Research Article Open Access
Microbial and Nutrient Contamination of Domestic Well in Urban-West Region, Zanzibar, Tanzania
Said A H Vuai*Department of Physical Sciences, The University of Dodoma, Tanzania
- *Corresponding Author:
- Said A H Vuai
Department of Physical Sciences
The University of Dodoma, P. O. Box 259, Dodoma, Tanzania
E-mail: saidhamadv@yahoo.co.uk
Received Date: December 19, 2011; Accepted Date: February 22, 2012; Published Date: February 23, 2012
Citation: Vuai SAH (2012) Microbial and Nutrient Contamination of Domestic Well in Urban-West Region, Zanzibar, Tanzania. Air Water Borne Diseases 1:102. doi:10.4172/2167-7719.1000102
Copyright: © 2012 Vuai SAH. This is an open-access article distributed under the terms of the Creative Commons Attribution License, which permits unrestricted use, distribution, and reproduction in any medium, provided the original author and source are credited.
Visit for more related articles at Air & Water Borne Diseases
Abstract
There is mushrooming of domestic wells in Zanzibar Town due to inadequate supply of tap water. The well water is used for domestic purposes including drinking. In many cases the wells are situated very close to pit latrines increasing the risk of contamination. This study attempted to assess the microbial and nutrients contamination in domestic well during dry and rainy season in the Urban-West Region of Unguja Island, Zanzibar. Nineteen domestic wells were sampled and analyzed for the microbial and nutrient quality of water. It was found that domestic wells were highly contaminated by both nutrients and coliform. The contamination was intensified during rainy season. Only 5% of the collected water samples met WHO and Tanzania standards for drinking water. This explains why in Zanzibar water borne diseases such as cholera and typhoid fever occur frequently. The major sources of contamination were found to be the pit latrines/ septic tanks. The degree of contamination was affected by the depth of a domestic well, and combination of number and location of a septic tanks surrounding a well at a particular location. It is recommended that frequent monitoring and treatment of the domestic wells could be a good solution to decrease the water born diseases.
Keywords
Domestic wells; Nutrients; Coliform; Pit Latrine; Zanzibar
Introduction
The threats to public health due to transmission of pathogenic bacteria from sewage system to ground water have been reported worldwide [1], having septic tanks as the most frequently reported on-site source of ground water microbial contamination [2]. However, Howard et al. [3] showed that on-site source is less important than other sources of fecal matters. Use of biologically contaminated drinking water is associated with the outbreak of water related diseases such as cholera, typhoid and diarrhea. It is estimated that about 88% of diarrhea disease in the world is attributable to unsafe water [4]. Zanzibar has been experiencing frequent outbreaks of water born diseases which have claimed the lives of many people during the last three decades [5]. The report on Environmental situation of Zanzibar town prepared by Zanzibar sustainable development project in 2005 associated the outbreaks of cholera in 1997 and 1998 with pollution of drinking water caused by solid and liquid wastes. The death of 4 people at Kizimkazi village- Zanzibar in June 2008 has been associated with polluted water.
The major source of water in Zanzibar is groundwater in the form of spring, cave and wells. The potential aquifers of Zanzibar are stratified into three hydro-geological zones which are the Eastern Limestone/ Sandstone Corridor, the Western Sedimentary Corridor and the Coastal Limestone deposit, Coral rag, [6]. These zones are unevenly distributed throughout the Unguja Island such that at any point of the Island, groundwater can be abstracted. The Zanzibar situation analysis conducted in 2003 indicated that piped water supply covers 70% and 45% of urban and rural areas, respectively. However, only small percentages among those covered by the pipeline network get sufficient quantity of water. Most of the areas covered by the network get flowing water only during late night hours, while others do not get water at all. The crisis of water shortage has forced many people and organization to dig new wells near their settlement in order to fulfill their water needs, most of them are in close proximity to the septic tanks/pit latrine.
Adherence to drinking water quality guidelines and practices has virtually eliminated diseases like typhoid fever and cholera in developed countries [7]. Therefore, it becomes very necessary to reveal the microbial and nutrient status and causes of pollution in these mushrooming wells that are built in houses as they are very much susceptible to microbial and nutrients contamination from septic tanks. This study investigated the status of microbial and nutrient quality of domestic wells in the Urban West Region of Unguja. Specifically the study assessed the extent of coliform and nutrient contamination, the sources of contamination as well as seasonal and spatial variations of the contamination in domestic wells.
Materials and Methods
Study sites and population
This study was conducted in the Urban West Region of Unguja Island. The Island is located at 5 degree south of the equator and 39.5 degree east. According to 2002 census, the Urban west region is the most densely populated region in Zanzibar with about 62.8% of the total population (622,459) of Unguja Island. The average population density of the Island is 400 people per square kilometer and is considered as one of the highest in sub-Sahara Countries.
At the moment, the Zanzibar municipality which comprises the major portion of population of the Urban-West region is governed by the Town Planning boundaries as established by the 1982 Master plan. The town municipality is characterized by several distinct settlement patterns emerging from different planning schemes. These includes, (1) the old stone town, (2) the old unplanned Ng’ambo areas, including Mwembetanga, Kikwajuni, Vikokotoni and Kiswandui, (3) the semiplanned Nga’mbo areas, including Kidongo Chekundu and Jang’ombe, (4) the new unplanned area, includes Chumbuni, Daraja bovu ,Welezo and Tomondo, (5) the new planned area, including M/kwerekwe, Mombasa, Mpendae and Chukwani and (6) the informally emerged urban settlement. These settlements started to develop due to rapid urbanization which resulted in an increased demand for new settlements while there was no parallel urban planning policy to meet these demands. Consequently, people built flats and houses in the urban areas randomly with no formalized plans. According to a recent study, over 70% of urban residents live in informal settlements [8].
The population of Zanzibar, like any other country seems to increased with time. This has led to clustering of settlements in the municipality which have in turn increased the production of sewage, overflowing of pit latrines or septic tanks mostly during heavy rains. The shortage of tap water prompted many people to drill wells and such wells were invariably located in close proximity of septic tanks.
Climate and soil of the study area
In general, the climate of Zanzibar is shaped very much by the trade winds of the tropical Monsoon system and movement of convergence zone. The weather pattern is bimodal in nature and is characterized by wet and dry seasons. The wet season is composed of long rainy season (Masika) starts from mid March to end of May; and the light/short rains (Vuli) falling between October and December. In between the long and short rains, the island experiences its two dry periods. The relative cool but dry weather (Kusi) occurs during June to September and the north east monsoon (Kaskazi) blows from January to mid March to give dry and hot weather. The average annual rainfall varies between 1000 – 2250 mm and average annual temperature is around 26º C.
The soil of Zanzibar is generally very permeable owing to sand and coral type of soil [9] .Therefore any waste materials discharged into the ground without treatment can easily leach to groundwater.
Sampling site
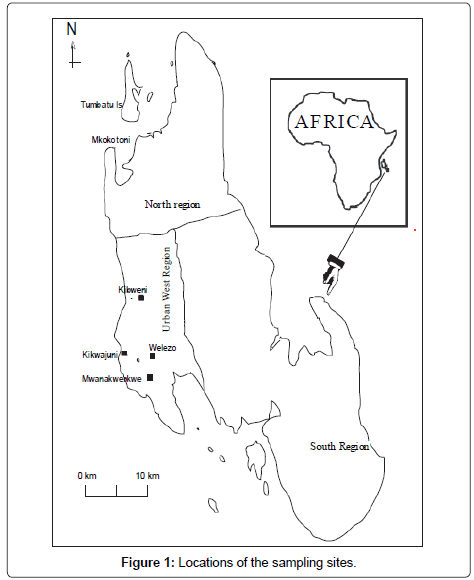
Four sampling sites were chosen for this study based on; density and availability of local wells in an area, nature of sewage disposal system in the area and depth of water table (water level) of local wells. The samples were collected from Kikwajuni, an old unplanned area where some of its housing schemes dispose their domestic waste water into the sea; Kibweni, a new unplanned area where most of its wells have high water level; Mwanakwerekwe, a planned area containing mixed shallow and deep wells and Welezo, a new unplanned area containing shallow wells. The locations of the sampling sites are shown in Figure 1.
Sample collection and analysis
Nineteen wells were sampled during dry season in February 2007 and long rainy season in April 2007 making a total of 38 samples. The distribution of the sampled wells was five from Mwanakwerekwe, six from Kibweni, four from Kikwajuni and four from Welezo.
Physical parameters of the wells (altitude, age, depth, water depth, diameter, and uses) were recorded. Physico-chemical parameters (pH, TDS, EC and Temperature) of the water samples were also measured in situ. Samples for microbial analysis were collected using pre-sterilized equipment and stored in pre-sterilized glass bottles followed by analysis in the laboratory within 6 hrs. The microbial analysis included both total coliform and fecal coliform. From each sample, 100 ml of water were drawn through a membrane of 0.45 mm pore size using a vacuum pump. The filters were then placed in sterilized petri dishes containing M-FC agar and incubated for 24 hours at 44.5º C to optimize the growth of fecal coliform only. After 24 hours the fecal coliform colonies developed were then counted under a magnifying lens. Another 100 mL of water were filtered using the same procedure and the filter paper was placed in the nutrient agar medium for 24 hours at 37°C to produce yellowish-brown colonies which were then counted under the lens.
For nutrients analysis, water samples were filtered through preweighed 0.45 μm cellulose-acetate filter membrane to remove total suspended particles. The filtrate was preserved by freezing for later analysis of nutrients. Ammonium concentration was determined by indophenol method involving oxidation with sodium hypochlorite and phenol solution. Nitrate was analyzed by cadmium reduction and diozoic complex while phosphate was analyzed by molybdate blue method with ascorbic acid. The nutrient analyses were performed using the procedure described by APHA [10].
Results
Physical parameters of the sampled wells
The sampled wells were drilled from 1989 to 2007 implying that the oldest and the youngest wells were at the age of 19 and 1 years, respectively (Table 1). Each location contains well of mixed age. The sampled sites have both hand dug and tube wells with the depth ranging from 1.6 m to 25 m. All the wells located at Welezo are comparably shallow with depth of 1.6 m to 7.9 m. Outlets of all wells are above sea level at elevation between 11 m and 49 m. Number of septic tanks ranged between 1 and 4 located at the distances of 0.9 m to 50 m from the sampled wells.
| S/N | Year Drilled |
Type of Well |
Distance to septic tank (m) |
Depth (m) | Season | Volume of Water (m3) |
Coliform | Altitude m | Temp. ºC | pH | TDS ppm | |
|---|---|---|---|---|---|---|---|---|---|---|---|---|
| TC/ 100ml | FC/ 100ml | |||||||||||
| 1 | 1997 | HD | 36.7 | 20 | Dry | 0.38 | 5 | NIL | 26 | 28 | 6.75 | 339 |
| 9.5 | Rain | 0.54 | 2 | NIL | 28.6 | 6 | 334 | |||||
| 2 | 2007 | HD | 9.39 | 6.96 | Dry | 0.65 | 13 | 7 | 30 | 27.3 | 7.18 | 346 |
| Rain | 0.96 | 16 | 3 | 28.9 | 6 | 267 | ||||||
| 3 | 2007 | HD | 14.64 | 4.1 | Dry | 0.47 | 92 | 41 | 28 | 29.7 | 6.65 | 330 |
| Rain | 2.42 | 31 | 9 | 29 | 6.05 | 357 | ||||||
| 4 | 2005 | HD | 22.73 | 18.4 | Dry | 0.59 | 65 | 49 | 28 | 29.3 | 6.9 | 337 |
| 22.43 | Rain | 1.25 | 38 | 18 | 29.3 | 5.29 | 291 | |||||
| 5 | 2004 | HD | 14.7 | 17.9 | Dry | 0.5 | 18 | 3 | 18 | 28.9 | 6.72 | 346 |
| Rain | 0.66 | 98 | 42 | 28.7 | 6 | 329 | ||||||
| Kibweni | ||||||||||||
| 6 | 2004 | HD | 11.3 | 9.15 | Dry | 1.68 | 27 | 8 | 17 | 27.9 | 6.65 | 4122.77 |
| 13.3 | Rain | 2.77 | 36 | 10 | 27.9 | 5.78 | 479 | |||||
| 19.6 | ||||||||||||
| 16.2 | ||||||||||||
| 7 | 2001 | TW | 16.6 | 18.29 | Dry | ND | 14 | 1 | 23 | 28.4 | 6.7 | 245 |
| Rain | ND | 59 | 8 | 28.8 | 6.76 | 244 | ||||||
| 8 | 2007 | 19.5 | 11.8 | Dry | 5.54 | 18 | 3 | 11 | 28.6 | 6.4 | 348 | |
| HD | 13 | Rain | 8.77 | 34 | 23 | 28.9 | 5.86 | 267 | ||||
| 9 | 2007 | 2.7 | 7.45 | Dry | 1.67 | 9 | 3 | 18 | 28.8 | 6.1 | 123 | |
| HD | 25 | Rain | 2 | 51 | 8 | 29.3 | 5.92 | 177 | ||||
| 10 | 1999 | TW | 22.45 | 25.6 | Dry | ND | 13 | Nil | 16 | 28.7 | 5.55 | 261 |
| 16.53 | Rain | ND | 46 | 30 | 28.9 | 5.86 | 267 | |||||
| 11 | 2006 | HD | 17.8 | 7.45 | Dry | 2.1 | 6 | Nil | 25 | 29 | 6 | 266 |
| Rain | 5.48 | 52 | 6 | 30.5 | 5.88 | 249 | ||||||
| Kikwajuni | ||||||||||||
| 12 | 2000 | HD | 50.7 | 19.7 | Dry | 1.22 | NIL | NIL | 25 | 28.8 | 6.88 | 1480 |
| Rain | 1.74 | 15 | 6 | 29.4 | 6.12 | 1460 | ||||||
| 13 | ND | TW | 26 | ND | Dry | 77 | 15 | 26 | 30.2 | 7.18 | 4150 | |
| Rain | 58 | 12 | 30 | 6.7 | 4000 | |||||||
| 14 | 2005 | HD | 26.4 | 2.89 | Dry | 0.88 | 1 | 1 | 20 | 30.2 | 7.77 | 5220 |
| Rain | 1.41 | 40 | 11 | 29.2 | 6.14 | 5220 | ||||||
| 15 | 2004 | HD | 28 | 20.6 | Dry | 0.97 | NIL | NIL | 28 | 30 | 7.14 | 873 |
| Rain | 1.36 | 14 | 3 | 29.9 | 6.6 | 800 | ||||||
| elezo | ||||||||||||
| 16 | 2006 | HD | 8.6 | 7.93 | Dry | 0.83 | 18 | 3 | 45 | 27.7 | 5.98 | 455 |
| Rain | 2.78 | 18 | 6 | 29.8 | 5.89 | 486 | ||||||
| 17 | 1990 | HD | 12.8 | 2.21 | Dry | 1.42 | 10 | 2 | 49 | 28.5 | 6.1 | 338 |
| Rain | 5.12 | 26 | 15 | 27.7 | 6 | 286 | ||||||
| 18 | 1997 | HD | 0.9 | 3 | Dry | 1.55 | 21 | 5 | 48 | 28.8 | 5.88 | 336 |
| Rain | 1.89 | 62 | 48 | 43 | 28.4 | 5.88 | 336 | |||||
| 19 | 1989 | 7.81 | 1.6 | Dry | 1.1 | 39 | 8 | 49 | 29.3 | 4.9 | 420 | |
| HD | 9.25 | Rain | 1.77 | 51 | 38 | 30 | 28.8 | 5.89 | 367 | |||
*HD = Hand dug; TW= Tube well
Table 1: Physico-chemical and Coliform contamination of the Domestic wells. Mwanakwerekwe.
Physico-chemical parameters of domestic well water
The values of measured temperature ranged between 27.7º C to 30.5º C (Table 1). There were no significant spatial as well as seasonal variations of water temperatures. The pH of water was neutral to slightly acidic with values ranging from 4.9 to 7.7. In general, the pH was lower during rainy season due to the effect of dilution. The water collected in the well located in Kikwajuni area showed the highest pH and that collected from Welezo area showed the lowest values. The electrical conductivity (EC) and total dissolved solid (TDS) showed that the water ranged from fresh water to saline water. The values vary from 248 μScm-1 to 12040 μScm-1 and 124 mgL-1 to 6020 mgL-1 for EC and TDS, respectively. This variation could be explained by the distance from the ocean, which determines the contribution of seawater on mass balance in the well water. The EC and TDS values showed both seasonal and spatial variation. The values were generally lower during rainy season reflecting the effect of dilution by rain water which has shorter time of interaction with rock minerals on the way to water table. This is also supported by increase in volume of water in all wells. The well water from Kikwajuni area was almost saline while the samples from other places were fresh.
Nutrient contamination
Nutrients occur naturally in ground water but their concentrations can greatly increase by anthropogenic activities. Excessive use of fertilizers, decomposing organic matters and uncontrolled land discharges of raw and semi-treated waste water often result in contamination of groundwater sources by nutrients; and therefore direct use of the water for domestic purposes is risky. Elevated concentrations of nutrients in drinking water have potential risk to public health. For example nitrate can directly cause methaemoglobinea (blue baby syndrome) in infants and it is associated with other disease including cancer [11].
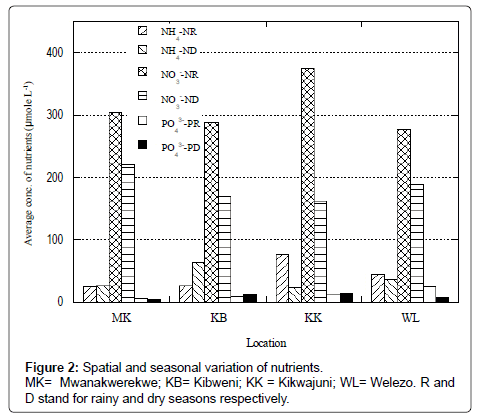
The concentrations of nitrate in the domestic well water found in this study ranged from 3.1 to 29.22 mgL-1 (Table 1). WHO (1984) and Tanzania Bureau of Standards (TBS) (1974) recommended nitrate concentration of less than 10 mgL-1 and 100 mgL-1, respectively for domestic consumption. The results showed that 70% of the total samples had the concentrations exceeding WHO limit however none of the samples was above the TBS limit. The nitrate contamination was more severe during rainy season in which only one sample met the WHO standard. High level of nitrate during rainy season is attributed to leaching of the contaminants by rain water [12]. The spatial variations of the nitrate concentration showed that water from Welezo (WL) has an average lowest value while the highest average value was observed in Kikwajuni (KK) area during rainy season. The trend was different during dry season, where the lowest average concentration was observed in Kibweni (KB) and the highest concentrations were measured at Mwanakwerekwe (MK) (Figure 2).
The concentration of phosphate ranged from 0.2 mg L-1 to 2.39 mgL-1. Similar to nitrate, the concentrations were generally higher during rainy season than dry season. However some of the wells showed higher concentration during dry season. Low concentration during rainy season is attributed to the dilution by the infiltration rain water which is less contaminated with PO43-. Kulabako et al. [12] found elevated concentrations of phosphate in dry season when compared to those of wet season in the shallow ground water in Uganda. The high concentration of nitrate during rainy season may indicate the influence nearby contaminating source such as septic tank. The spatial variation of phosphate showed that the highest concentration was found at Welezo during rainy season and lowest concentration at Mwanakwerekwe while in dry season the highest concentration was found in Kikwajuni and the lowest was at Mwanakwerekwe.
The concentration of ammonium (NH4+) ranged from 0.3 mgL-1 to 2.9 mgL-1. One sample from Kibweni has the concentration above 1.5 mgL-1 recommended concentration by WHO (1984). The trend of the concentrations of NH4+ from dry season to rainy season is similar to that of PO43-. Spatial variations of NH4+ concentrations showed that the highest concentration was found at Kikwajuni while the lowest was found at Mwanakwerekwe during the rainy season while in the dry season the lowest concentration was measured at Kikwajuni and highest at Kibweni. The observed variation in nutrients patterns suggests the influence of well hydrology on nutrients contamination.
Microbial contamination
The microbial analyses revealed that the contamination of the sampled wells was generally high in both dry and wet season (Table 1). Number of total coliform detected ranged between 0 and 98 CF in 100 mL of water and only 2 samples were found to be free from contamination during dry season. Fecal coliform (FC) contamination was not much different to the total coliform case. The samples contained between 0 and 49 FC per 100 mL of water. About sixteen percent of all samples met the required WHO and Tanzania microbial standards of 0 CFU/100 mL for drinking water. The magnitude of contamination was significantly higher during rainy season. The results showed that all samples collected during rainy season were microbially contaminated with respect to total coliform. For the fecal coliform, 95% were contaminated during rainy season compare to 74 % of the dry season. This result agrees with several other studies, that microbial contamination becomes severe during the rainy seasons [13,14].
Discussion
Source and variation of water quality
The analyses of samples indicated that domestic wells from urban area of Zanzibar Island, Tanzania are highly contaminated with respect to both nutrients and coliform. Based on the WHO standard especially of microbial content, water from most of the wells is not fit for drinking without further treatment. It is well known that, short-term peaks in microbial concentration increase disease risks considerably and may trigger outbreaks of waterborne diseases. The results are consistent with eruption of water related diseases which occur almost during every rainy season. These disease episodes are serious, claiming the lives of residents. For example major cholera out-break occurred in 1978, 1997 and 2006 and affected a total of 2304 people of which 273 people died [5].
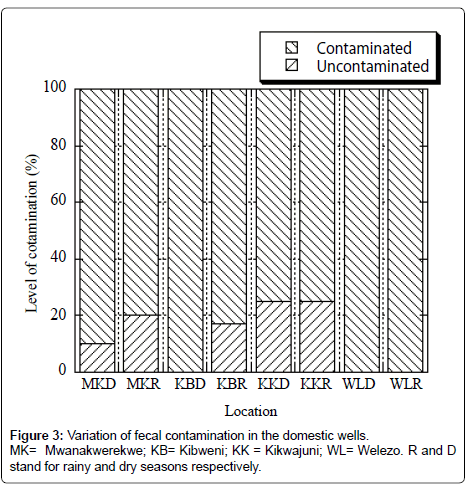
The severity of contamination varies from location to location (Figure 3) depending on the nature of waste disposal and sewerage systems of the areas. For instance all water samples collected from Welezo wells were microbial contaminated while the situation was only marginally better in Kikwajuni where 75% of the wells were found to be contaminated. Similarly, phosphate was also found at elevated concentration at Welezo during rainy season when compared to Kikwajuni. Welezo is squatter type of settlement using only pit latrine while Kikwajuni most of the sewerage system is connected to government sewerage system which dispose the waste into the ocean. Although disposal of waste to the ocean has reduced microbial contamination of shallow wells but it has posed another concern of contaminating coastal waters.
The other factor which likely contributed to differences in spatial variations between the sites is shallowness of the water wells. The water table in Welezo area is in less than 3 m deep in most wells while the average depth of pit latrines and septic tanks is about 2 m in the most areas of Zanzibar municipality (data from interviewed residents). This means that the depth of septic and pit latrines in Welezo area is within the water table of wells and therefore high risks of contamination. Human or animal faces are the major sources of fecal coliform consequently all sampled wells from Welezo were contaminated by both fecal and total coliforms. Fecal coliform contamination is the worst form of microbial contamination of water and direct consumption of such contaminated water is associated with the greatest risks of diarrhea and cholera. The health records shows that Welezo area and its neighboring village Mtopepo are most suffering from cholera and other water related diseases. This condition might be related to poor quality of water used by the residents. To combat the situation Ministry of health has established a permanent camp within the area to take care of cholera and diarrhea victims.
The result obtained in this study showed seasonal variations of nutrients and coliform with a general increase of contamination levels from dry season to rainy season. The observation suggested that these water quality parameters are derived from the same sources. The possible source is septic tank in which the pollutants seep into the ground water through lateral movement of rain infiltrating through the pit latrine or septic tanks. Domestic-sewage infrastructures are poorly developed in Zanzibar (UNEP, 1999) and this is considered to be the major source of pollution to near-shore coastal waters as well as fresh water source (mainly groundwater). Seventy eight percent of the population living in the urban area uses pit latrines or septic tanks (Zanzibar Sustainable Programe, 1998). Only 19% of the population living in the Stone town and some areas in the old unplanned Ngambo (include Kikwajuni and Kilimani housing scheme) are served by sewer system. The sewer system eventually disposes the domestic waste water into the sea at a distance of 50 m to 170 m from the shore. Zanzibar Government under the sponsorship of UNEP, initiated the project to improve the sanitation in town areas; however the maintenance of the system appears to be difficult, as some of the outflows are often blocked by the sand. It was observed that the blocked outlets flow back and therefore the waste may not reach the sea but infiltrates into the ground, thereby causing pollution risk to ground water. Reid et al. [15] also found that similar variation of coliforms and nutrients in the ground water sample from Aberdeenshire, UK.
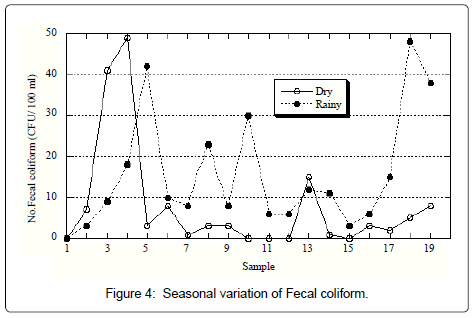
Although the results showed general increase (73%) in fecal coliform contamination from dry season to wet season, some (21%) of the wells showed a decrease trend in the contamination levels during the same periods (Figure 4). The decrease trend was mostly observed in samples collected from M/kwerekwe. This indicates that seasonal variation of the quantity of FC/100 ml is determine by several correlating factors, such as the rapid infiltration of rain water to the ground, which can enhance unfavorable condition for fecal coliform survival, which rely on slow movement of water for their maximum survival. The additional rain water might also have led to dilution of pathogens counts. Similar findings were also reported by Abel-lah [16] on their study of impact of septic tank on groundwater quality in a Nile village of Egypt where artificially increasing the volume of water by a pump decreased the FC/100 ml count.
Effect of physical parameters on microbial contamination
The domestic wells under investigation had wide variation of physical parameters as shown in Table 1. Septic tanks which may act as point source also varies in density and distance to the well. In addition to leakage from on-site sanitation or from sewerage, the sources of contamination could be from manure, wastewater or sewage sludge spread by farmers on fields, waste from animal feedlots, waste from healthcare facilities, and leakage from waste disposal sites and landfills. The contamination of ground water by coliform depends on the how the bacteria can be transported from the source to the water table. The transportation is determined by number of factors including temperature, predation, antagonism, light, soil type, pH, toxic substances, and dissolved oxygen as well as depth of the well which determine microbial survival and sorption/desorption [17]. The influence of well depth and distance of the well from contamination source was demonstrated at M/ kwerekwe where fecal coliform was not found in one well (Table 1, S/N 1) during both seasons. This was a deep well of 20 m depth, located at a distance of 36.7 m. These results are in agreement with the finding of Dzwairo et al. [18] on the influence of well depth and separation distance. It may be suggested that for any well in the municipality intended for domestic uses, maintaining a safe distance of at least 30 m from microbial point sources should be mandatory. However, in most locations in Zanzibar municipality such separation distance cannot be achieved as the average residential plots size is less than 20 m x 20 m. The results indicate the higher risk for people, of contracting communicable diseases such as typhoid, diarrhea and cholera as long as the supply of safe water is not reliable.
The study showed that the largest number of total and fecal coliform were not exclusively found in the shallowest well, which was 1.60 m deep, nor were they found in well that was in close vicinity to the septic tank, which was separated by 0.90 m. The highest contamination was not also found in area of high number of septic tanks. This indicates not only well depth and distance from point sources but multiple factors such as velocity of flowing water, depth of water, type and geology of soil and ionic strength of the solution might have contributed to the distribution of fecal coliform in local wells of the Urban West Region of Unguja.
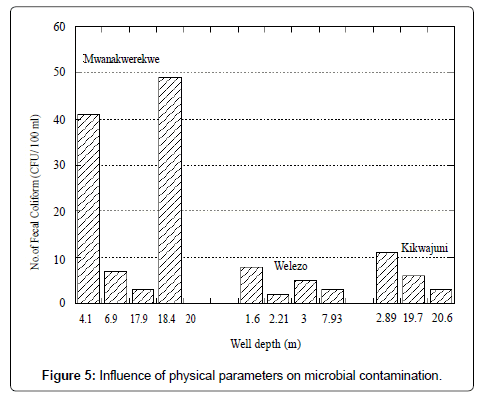
Interpreting the results at specific site showed interesting results. The concentration of fecal coliform varied in accordance to the depth of well, the number of septic tanks and the distance from which a septic tank is located (Figure 5). The observations suggest that the soil at the sampling sites is influence all other factors (depth of well, number and distance of septic tanks from which a well is located) toward the contribution of the quantity of FC/100 ml. For example, samples collected from Mwanakwerekwe site showed that fecal coliform were observed to increase with the decreasing the depth of well during dry season. Along the way, another factor (number of septic tanks) contributes to the increase of fecal coliform on a well of 18.4 m deep that was surrounded by two septic tanks (Table 1). This trend was also observed on other areas as well. The shallowest well sampled from Welezo surrounded by two septic tanks at distance of 7.81 m and 9.29 m showed high fecal coliform content (Figure 5). The coliform decreased with increasing well depth; however the number increased again in the well of 3 m deep. This well neighbored the pit latrine at the distance of only 0.9 m. The closeness of the well to pit latrine is suggested to contribute to the enrichment of fecal coliform through leaching of fecal matters to the well. When the number of septic tanks was the same such as the samples collected at Kikwajuni area, the depth of well clearly explains the microbial contamination in the domestic wells. The influence of physical parameters was not clear for nutrients. This suggests different mechanism of transportation of nutrient and coliform. For example solubility of nitrate is very high and it is little attached within the soil matrices while the microbial contamination is highly affected by temperature, predation, antagonism, light, soil type, pH, toxic substances, and dissolved oxygen which determine microbial survival and sorption/desorption [17]. These factors may be responsible for determination of different spatial variation of coliform and nutrients.
Conclusion
The study of microbial and nutrient contamination of domestic wells in urban west region of the Zanzibar Island showed that majority of local wells are contaminated throughout the year and are not fit for drinking. The water quality was poorer with respect to microbial contamination than nutrients especially during the rainy season. The major source of contamination was suggested to be septic tanks/ pit latrines. The contamination was contributed by several correlating factors, such as the depth of the well, the separating distance from a septic tank to a well and the number of septic tanks surrounding a well. The results showed that shallow dug wells are highly contaminated than deep dug wells. The minimum depth or the well which did not show microbial contamination throughout the year was 20 m. The results also depict that the well close to septic tank showed the highest number of coliform contamination. Similar effect was observed for septic tank density. These factors are strongly influenced by the nature of the soil at a particular area which was suggested as the reason for the observed spatial variations. Accordance to the nature of the soil, one factor can have a more prominent effect than the other. In a situation where all these factors accumulate, there will be no alternative other than abandoning using the well for drinking purpose, as for such case it will be impossible to abide with the WHO and Tanzania standards of microbial quality of drinking water.
Acknowledgements
We are grateful to Ms. Raya A. Ibrahim, Tatu A. Kilatu, Mr. Abdallah, Mr. Ramadhan for their assistance during sample collection and analysis. The comments from Dr. Haji M. Haji and Prof. V. J. Raju are acknowledged.
References
- FAO (1979) Groundwater Pollution Technology, Economics and management. Food and Agriculture Organization of the United Nation and Drainage Paper, Rome: Author
- Yates MV (1985) Septic tanks density and groundwater contamination. Groundwater 23: 586-591.
- Howard G, Pedley S, Barrett M, Nalubega M, Johal K (2003) Risk factors contributing to microbiological contamination of shallow groundwater in Kampala, Uganda. Water Res 37: 3421-3429.
- WHO (2003) Emerging issues in water and infectious disease. Geneva: World Health Organization (WHO).
- Zanzibar Ministry of Health and Social Welfare (2006) The State of Health and Environmental Sanitation, Revolutionary Government of Zanzibar.
- Hulcrow W (1994) Development of Water Resources in Zanzibar, His Highness Dr. Sheikh Sultan Bin Mohammed Al Qasimi Ruler of Shrah, Zanzibar,
- Craun GF, Nwachuku N, Calderon RL, Craun MF (2002) Outbreaks in drinking-water systems, 1991-1998. J Environ Health 65: 16-23,28.
- Hamad A (2005) State of the environment report for Zanzibar 2004/2005. Zanzibar Revolutionary Government, Zanzibar.
- FINIDA (1991) Zanzibar Urban Water Supply Developmental Plan 1991-2015. Placenter Ltd.
- American Public Health Association (APHA) (1992) Standard methods for examination of water and wastewater. In: Greenberg AE, Clesceri LS, Eaton AD (eds) Washington, DC, USA.
- Flanagan JP (1990) Parameter of water supply interpretation and standards. St. Martins House, Dublin 4 Ireland, 2nd Edition.
- Kulabako NR, Nalubega M, Thunvik R (2007) Study of the impact of land use and hydrogeological settings on the shallow groundwater quality in a peri-urban area of Kampala, Uganda. Sci Total Environ 381: 180-199.
- Arnade LJ (1999) Seasonal correlation of wells contamination and Septic tanks distance. Groundwater 37: 920-923.
- Munga D, Kitheka JU, Mwanguni SM, Barongo J, Massa HS, et al. (2005) Vulnerability and pollution of Groundwater in the Kisauni Area, Mombasa, Kenya. UNEP/UNESCO/UN-HABITAT/ECA.
- Reid DC, Edwards AC, Cooper D, Wilson E, Mcgaw BA (2003) The quality of drinking water from private water supplies in Aberdeenshire, UK. Water Res 37: 245-254.
- Abel-lah AK, Shamrukh M (2001) Impact of septic tanks system on groundwater Quality in a Nile valley. Sixth International Water Technology Conference, Alexandria, Egypt.
- Foppen JW, Schijven JF (2006) Evaluation of data from the literature on the transport and survival of Escherichia coli and thermotolerant coliforms in aquifers under saturated conditions. Water Res 40: 401-426.
- Dzwairo B, Hoko Z, Love D, Guzha E (2006) Assessment of the impacts of pit latrines on groundwater quality in rural areas: A case study from Marondera district, Zimbabwe. Phy Chem Earth 31: 779–788.
Relevant Topics
Recommended Journals
Article Tools
Article Usage
- Total views: 6739
- [From(publication date):
March-2012 - Apr 04, 2025] - Breakdown by view type
- HTML page views : 2145
- PDF downloads : 4594
