Research Article Open Access
Methylene Blue Dye Removal from Aqueous Solution Using Several Solid Stationary Phases Prepared from Papyrus Plant
El-Wakil AM, Abou El-Maaty WM* and Ahmed Abd Al-Ridha OudahDepartment of Chemistry, Faculty of Science, Mansoura University, Mansoura, Egypt
- *Corresponding Author:
- Abou El-Maaty WM
Department of Chemistry
Faculty of Science, Mansoura University
Mansoura, Egypt
Tel: 01099806635
E-mail: dr.weam_elmaaty@yahoo.com
Received date: October 06, 2015; Accepted date: November 02, 2015; Published date: November 09, 2015
Citation: El-Wakil AM, Abou El-Maaty WM, Al-Ridha Oudah AA (2015) Methylene Blue Dye Removal from Aqueous Solution Using Several Solid Stationary Phases Prepared from Papyrus Plant. J Anal Bioanal Tech S13:003. doi:10.4172/2155-9872.S13-003
Copyright: © 2015 El-Wakil AM, et al. This is an open-access article distributed under the terms of the Creative Commons Attribution License, which permits unrestricted use, distribution, and reproduction in any medium, provided the original author and source are credited.
Visit for more related articles at Journal of Analytical & Bioanalytical Techniques
Abstract
The activated carbon samples (SC and PC) were prepared from papyrus plant by chemical activation with sulfuric acid and phosphoric acid, respectively. The SC and PC were then modified with nitric acid to give the oxidized sulfuric carbon (OSC) and oxidized phosphoric carbon (OPC) and utilized for removing Methylene Blue (MB) from aqueous solution with initial dye concentration (5-650) mg/L and a temperature of 25-45°C. The effects of pH, contact time, initial concentration of MB and temperature on adsorption, as well as the thermodynamics and kinetics were investigated. The experimental results showed that: (1) The adsorption capacity of MB was dependent upon pH and maximum adsorption occurs at pH 8. (2) The adsorption process was in good agreement with the Langmuir adsorption isotherm model. (3) The adsorption kinetics followed a pseudo-second order kinetic model and intra particle diffusion was involved in the adsorption process. (4) Thermodynamic results indicated that the adsorption process was spontaneous and endothermic in nature. The proposed adsorbent was successfully applied for the removal of Methylene Blue (MB) from aqueous solution with a percent recovery of the sample SC 98.9%, PC 98.3%, OSC 97.5%, OPC 95.05% when using 0.1-1M HCl.
Keywords
Papyrus plant; Methylene blue; Adsorption; Activated carbon; SEM
Introduction
Dyes are important hazardous substances found in textile industry, food industry, pharmaceutical industry, paper industry and plastics industry. Their presence in water bodies reduces light penetration and this consequently thwarts the photosynthesis of aqueous flora [1,2]. Similarly, this makes the water objectionable for drinking. Dyes in water stream causes allergy, dermatitis, skin irritation, which, at extreme cases, provoke cancer and mutation in humans [3]. Furthermore, the color and the non-biodegradable nature of the spent dye baths constitute serious environmental problems. The removal of these dyes from waste water is a target of many researchers nowadays. Several methods have been tested to remove color from industrial effluents with the goal of lessening their impact on the environment A synthetic dye in wastewater cannot be efficiently decolorized by traditional methods, and because of the high cost and disposal problems for treating dye wastewater at large scale industries [4-6]. Nowadays; adsorption is the most effective method of dyes removal technique using low cost adsorbents. Papyrus plant is a Water plant belongs to the Cyprus family. It is sustained plant evergreen growing groups in the edges of ponds. Papyrus breed through division by Al rezumat under the surface of the water. It can grow (4 to 5 m) (13 to 16 ft) high, Papyrus fiber contains 54-68% cellulose and 24-32% lignin [7]. Physical adsorption technology, i.e., by activated carbons [8] has been found to be an efficient technology for decolonization of wastewater. Although the removal of dyes through adsorption is quite effective. In recent years, attention has been shifted towards the materials which are byproducts or wastes from large scale industrial operations and agricultural waste materials. A wide variety of low cost materials, have been exploited for the removal of dyes from aqueous solutions, including lemon peel [9]. The major advantages of these materials include: low cost, high efficiency, minimization of chemical or biological sludge, no additional nutrient requirement, and regeneration of sorbent and possibility of effluent recovery. Activated carbon porous material during the production suffers an imbalance in the crystal structure, which leads to the appearance of pores or gaps, is stable in terms of energy content, which lies behind the high capacity of the activated carbon adsorption [10]. The presence of these pores abnormally led to the possession of activated carbon surface area ranging from (2000-300) m2/g was up to 5,000 m2/g [11].
The main focus of this study was to prepare activated carbon (SC, PC), modified activated carbon (OSC, OPC) from papyrus plant and evaluate their potentiality for the removal of MB from aqueous solution. The effects of initial dye concentration, contact time, solution pH and temperature on MB adsorption were evaluated. The adsorption kinetics, isotherms and temperature dependent performance, were investigated.
Experimental
Preparation of adsorbents (Activated carbon and modification of AC)
The papyrus plant was collected from Manzala Lake in Mansoura, Egypt. The roots of the plant were removed while they were washed several times with water then washed with distilled water and were immersed in 0.025M (EDTA) at pH 10 for 24 hour for removing any metal ions adsorbed on the plant and washed with distilled water for several times and dried in oven at 110°C for 48 h, then conducted treatment amount from papyrus plant with sulfuric acid ratio of 1:3 (wt.:v) to give a sample (SC) and phosphoric acid and the ratio of 1:3 (wt.:v) to give a sample (PC) were conducted for samples of carbon burning process by burning oven at a temperature of 600°C for a period of 4 hours, for activated carbon, and then was taken from the amount of activated carbon for both samples and Oxidation with nitric acid at a rate of 1:10 (wt.:v) on both the end and gave a sample of the (OSC) sample processing sulfuric acid and other (OPC) sample of phosphoric acid treatment. AC has been sieved by sift of holes Diameter 0.63 mm, and stored in tightly closed bottles and kept in desiccators used in adsorption experiments.
Adsorption studies
The adsorb ate was prepared by dissolving 1 g of methylene blue powder in small quantity of distilled water in 1000 ml volumetric flask. More distilled water was added to make up to the mark. It was then shaken vigorously for five minutes to ensure complete dissolution and homogeneity; this makes the stock solution of concentration 1000 mg/L. Different concentrations were prepared by serial dilution. Batch adsorption method was employed to determine the effects of pH solution, dye concentration, contact time, temperature and adsorbent dose.
To study the effects of initial pH of the solution on the adsorption process, 25 ml of dye solution was poured into a conical flask with adsorbent dosage of 0.025 g. The pH of the dye solutions was adjusted with dilute HCl (0.5M) or NaOH (0.5M) solution by using a pH meter (JENWAY- LTD Instrument, digital model 3310) and the pH of solution was changed from 2 to 10.
250 ml of dye solution was poured into a conical flask with adsorbent dosage 0.25 g and place inside a shaker (Heidolph Prom ax 2020- Germany. RPM=20-400 Instruments). The samples were withdrawn from the shaker at predetermined time (5-300) min intervals and the dye solution was separated from the adsorbent by the help of a micropipette. The absorbance of the solution was then measured until the equilibrium was reached.
The adsorbent dosage was varied as (0.005-0.04) g in 25 ml dye solution to obtain the optimum adsorbate with take dye solution 25 ml. Effect of concentration 25 ml of dye solution was prepared in conical flask with dye concentration (5-100) mg/L with sample (SAC), (25-600) mg/L with (PAC) and (50-650) mg/L with (NSAC, NPAC) and adsorbent dose (0.025 g/L) and place them in the shaker. The temperature was maintained at 25°C. Using a spectrophotometer (Apye -Unicom UV2100Uv-Visible Spectrophotometer) conducted read the absorbance effect of temperature has been studied at (298, 308 and 318) K at a constant shaking rate of about 207 rpm. The amounts of dye removed by sorbents qe and percent extracted %E can be calculated using the following equations:
 (1)
(1)
 (2)
(2)
Where qe is the amount of dye adsorbed (mg/g). Co and Ce are the initial and equilibrium liquid-phase concentrations of dye (mg/g), respectively. V is the volume of the solution, and m is the weight of the sorbent used (g).
Results and Discussion
Characterization of prepared adsorbent
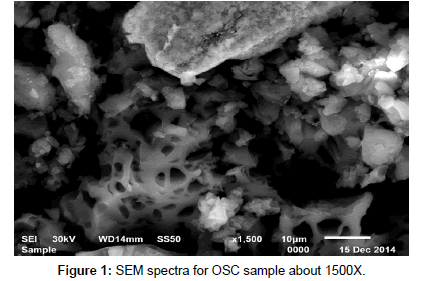
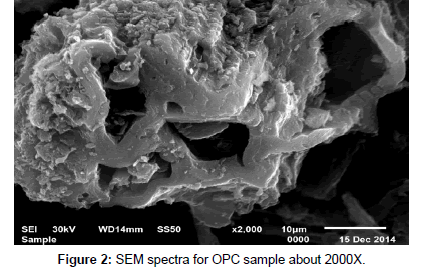
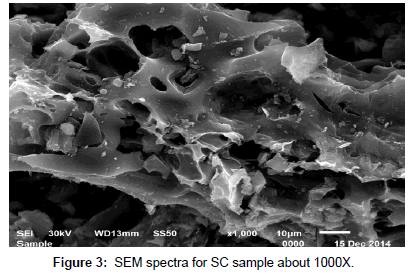
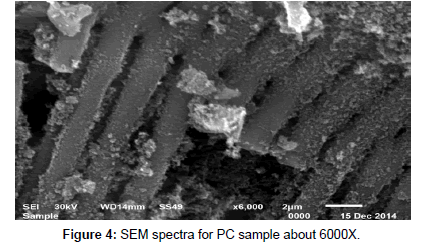
Scanning electron microscopy (SEM): SEM micrograph of activated carbon obtained from cryogenic grinding of used tires. The SEM micrograph obtained clearly indicate the porous structure of (AC) adsorbent at magnification of (1000X, 1500X, 2000X, 6000X) for AC as shown in Figures 1, 2, 3 and 4. Carbon being the prominent component indicates the carbonaceous nature which in turn imparts porosity observed in the SEM results.
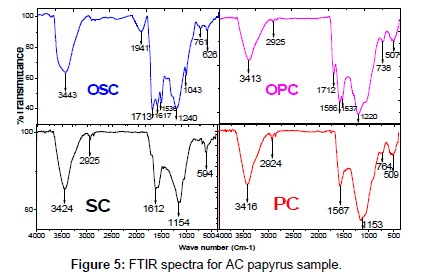
FTIR spectroscopy: The FTIR spectra of SC, PC, OSC and OPC were taken before the adsorption of MB to ascertain the possible involvement of the functional groups on the surface of SC, PC, OSC and OPC in the adsorption of MB Figure 5. The broad band at 3413 - 3443 cm-1 O-H stretching mode of hydroxyl group, while the band at 2925 cm-1 Aliphatic (C-H). The peak at 1713 cm-1 C=O is saturated carboxylic acids, peak at 1500 -1600 cm-1 was strong and broad C=C stretching in aromatic ring. The peaks at 1300-1000 cm-1 C-O bonds such as those in ethers, phenols, and esters. The Weak bands at 1220 and 1240 cm-1 highly conjugated (C=O stretching, C-O stretching in carboxylic groups and carboxylic moieties). FTIR spectra Conducted on recorded between 4000 and 400 cm-1 using a Mattson 5000 FTIR spectrometer.
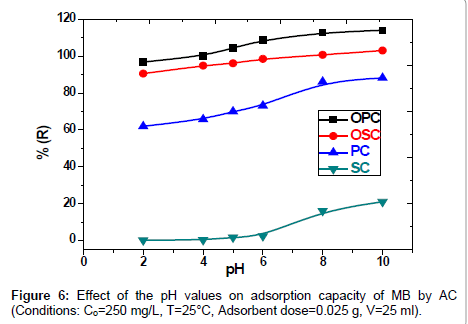
Effect of pH on MB adsorption: The effect of pH is one of the important parameters controlling adsorption process. Conducting the effect of pH on removal of Methylene Blue (MB) by SC, PC, OSC and OPC solid phases. The results are also shown in Figure 6, where been the pH solution were controlled by addition of 0.5M HCL and 0.5M NaOH. The curve increases with pH increase (2-10) till reach to the state of stability. The study shows maximum adsorption of MB dye solution on the initial pH=8. However, the uptake capacity does not change significantly from pH 8 to 10 and the removal efficiency (%E) is kept practically constant (variations lower than 2.0%). the increases in value of the pH Attributed to the presence various functional groups such as carboxyl, hydroxyl and carbonyl groups confirmed qualitatively using FTIR on activated carbon surface. The cause of decreases in adsorption of the MB in acidic medium due to the of presence excess H+ ions which competing in solution with of the MB dye for the active sites.
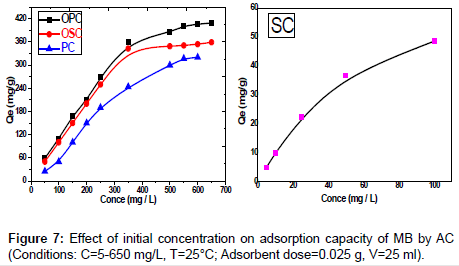
Effect of initial dye concentration: Adsorption of the MB dye on activated carbon for the samples SC, PC, OSC and OPC studied at different initial concentration from 25 to 650 mg/L of MB at 25°C. Study of results represented in Figure 7 shows presence of relation between the concentration of dye and the available binding sites on adsorbent surface, it shows high removal of dye concentration in the start of adsorption process, then the removal of dye decreases due to the completion of the available sites. The removal of initial concentration of dye decreases with the increases of its concentration. The amount of MB adsorbed at equilibrium (qe) increase (4.93-34.82) mg/g, (25- 326.19) mg/g, (50-359.04) mg/g and (48.27-409.25) mg/g for SC, PC, OSC and OPC adsorbents, respectively. This may be attributed to the fact that the increase of the initial concentration of the adsorbate represents a driving force to overcome the mass transfer resistance of dye between the aqueous and solid phases.
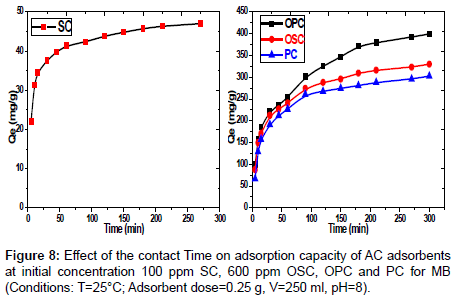
Effect of contact time on MB dye adsorption: The adsorption study of the MB dye conducted on various concentrations according to samples SC (100 mg/L) and PC, OSC and OPC (600 mg/L), with different of contact time (5-300) min. the results represented in Figure 8 shows that with increasing contact time, the adsorbed amount of dye will increase till reaches to equilibrium at 60 min for the sample SC and 120 min for the samples PC, OSC, OPC. The rate of dye removal is higher in the beginning due to a larger surface area of the sawdust being available for dye adsorption. The second stage was slower, possibly because many of the available external sites was already occupied and because of the slow diffusion of MB molecules into the pores of different adsorbent. Figure 8 Effect of the contact Time on adsorption capacity of AC adsorbents at initial concentration 100 ppm SC, 600 ppm OSC, OPC and PC for MB. (Conditions: T=25°C; adsorbent dose=0.25 g, V=250 ml, pH=8).
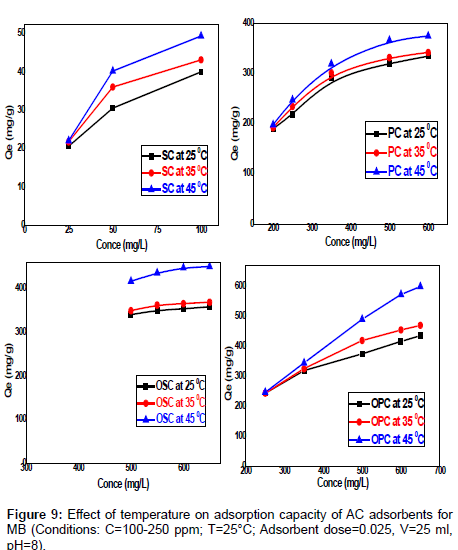
Effect of temperature on MB: The effect of temperature on the adsorption of methylene blue at 0.025 g in 25 mL adsorbent concentration, 180 min of contact time, pH=8, and a 150 rpm stirring speed for the different dye concentrations (25 -100 mg /L) SC, (200-650 mg/L) PC , OSC , OPC seen in Figure 9 was investigated. The adsorption capacity of the carbon increased with increase in the temperature of the system from 25°C-45°C. It is observed that the equilibrium adsorption uptake increasing with increased temperature at all concentrations studied. An increase of temperature increases the rate of diffusion of the adsorbate molecules across the external boundary layer and within the internal pores of the adsorbent particle, due to decrease in the viscosity of the solution [12]. The maximum adsorption capacities of MB removed by SC, PC, OSC and OPC are found to be increased from (34.82-49.48) mg/g, (326.19-374.22) mg/g, (359.04-451.19) and (409.25-599.48) mg/g respectively. This phenomenon indicates that the adsorption process ts endothermic in nature. This may be due to the mobility of molecules which increases generally with a rise in temperature [13].
Figure 9 Effect of temperature on adsorption capacity of AC adsorbents for MB. (Conditions: C=100-250 ppm; T=25°C; adsorbent dose=0.025, V=25 ml, pH=8).s
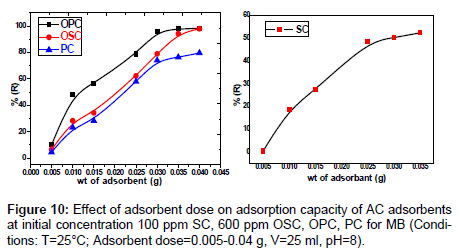
Effect of adsorbent dose: The effect of dose for adsorption of the dye amount by SC, PC, OSC and OPC when the sorbent dose increases from 0.005 to 0.04 g, the percent MB dye removals by SC, PC , OSC and OPC increase from (0.36- 52.44)%, (4.46-79.67)%, (6.44-97.99)% and (9.97-98.36)% respectively. The results of removal of MB represented in Figure 10 indicate that the increase in the adsorption of the dye on increasing dose adsorbent. This is probably because of the resistance to mass transfer of dye from bulk liquid to the surface of the solid, which becomes important at high adsorbent loading in which the experiment was conducted [14]. The main reason for the increase of adsorption is the adsorption sites remain unsaturated during the adsorption reaction whereas the number of sites available for adsorption site increases by increasing the adsorbent dose.
Adsorption isotherms
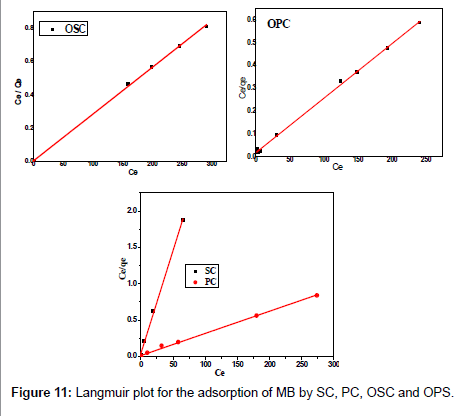
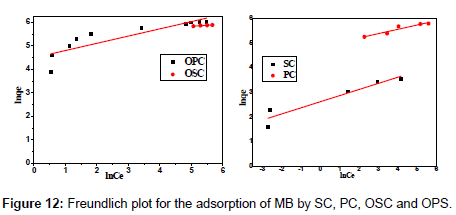
The Langmuir adsorption isotherm assumes that adsorption takes place at specific homogeneous sites within the adsorbent and has found successful application to many sorption processes of monolayer adsorption [15]. The Freundlich equation was employed for the adsorption of Methylene blue on the adsorbent.
 (3)
(3)
 (4)
(4)
The Langmuir parameters, Q and b have been estimated from the slopes and intercepts of the straight lines of plot of (Ce/qe). Ce, while the values of Freundlich constants, i.e., Kf and n have been estimated from the plots of log qe against log Ce. Langmuir constants Q and b related to absorption capacity and energy of adsorption, respectively, while Freundlich constants Kf indicates the adsorption capacity and 1/n is indicative of the intensity of reaction. Parameters of the Langmuir and Freundlich isotherms are tabulated in Tables 1 and 2. The linear regression was used for estimating the parameters and R2 value was obtained in each case. For methylene blue adsorption R2 value lies between 0.877-0.999 suggesting that the adsorption can be well fitted to both Langmuir and Freundlich isotherms. The experimental data for adsorption of methylene blue on activated carbon have been fitted to both Langmuir and Freundlich model [16]. The essential characteristics of Langmuir isotherm can be expressed in terms of dimensionless equilibrium parameter (RL) [17] (Figures 11 and 12). The parameter is defined by:
| Adsorbents | Langmuir parameters | ||||
|---|---|---|---|---|---|
| R2 | b (L/mg) | Qmax, fitted | Qexp | RL | |
| OPC | 0.998 | 0.13 | 434.78 | 409.25 | 0.012 |
| OSC | 0.999 | 1.92 | 354.61 | 359.04 | 0.008 |
| PC | 0.996 | 0.25 | 327.87 | 326.19 | 0.007 |
| SC | 0.997 | 0.65 | 35.36 | 34.82 | 0.015 |
Table 1: Parameters of Langmuir isotherm for adsorption of MB by SC, PC, OSC and OPS.
| Adsorbents | Freundlich parameters | ||
|---|---|---|---|
| R2 | Kf | 1/n | |
| OSC | 0.929 | 226.20 | 0.08 |
| OPC | 0.743 | 89.07 | 0.31 |
| PC | 0.882 | 128.44 | 0.17 |
| SC | 0.877 | 13.65 | 0.25 |
Table 2:Parameters of Freundlich isotherm for adsorption of MB by SC, PC, OSC and OPS.
 (5)
(5)
Kinetics studies
The kinetic adsorption data were processed to understand the dynamics of adsorption process In terms of the rate constant order. Thus, the kinetic of MB adsorption onto activated carbon prepared from pea shells was analyzed using pseudo-first-order and pseudosecond order Kinetic models [18]. The rate constant of adsorption is determined from the pseudo first-order equation given by Langergren and Svenska [19]:
 (6)
(6)
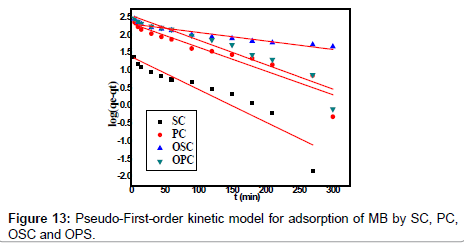
Where qe and qt are the amounts of MB adsorbed (mg/g) at equilibrium and at time t min, respectively, and k1 the rate constant of adsorption (min-1). Values of k1 were calculated from the plots of ln (qe-qt) versus t Figure 13 at initial concentration of 200 ppm of MB. The second-order kinetic model is expressed as:
 (7)
(7)
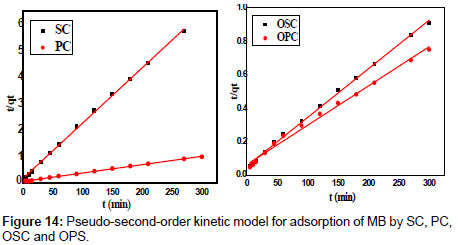
Where K2 is the rate constant of second-order adsorption (g mg-1 min-1). Values of K2 and qe were calculated from the intercept and slope of the plots of t/qt versus t. The linear plots of t/qt versus t (Figure 14). The derived kinetic model parameters for MB adsorption onto AC are shown in Table 4. As can be seen by the values for R2 and agreement between experimental and calculated qe values, the pseudo-second order kinetic model fits the experimental results more accurately than the pseudo-first order kinetic model (Table 3). Thus, it can be concluded that MB adsorption on AC follows the pseudo-second order rate equation. This fact suggests that the rate of sorption for AC is dependent on the availability of the sorption sites rather than the concentration of the adsorbate in the bulk solution.
| Adsorbent Code | Pseudo-first order | |||
|---|---|---|---|---|
| qe exp. mg.g−1 | qe cal. mg.g−1 | K1 (min−1) | R2 | |
| OPC | 400 | 12.93 | 0.016 | 0.909 |
| OSC | 378 | 10.18 | 0.005 | 0.910 |
| PC | 303 | 10.28 | 0.015 | 0.882 |
| SC | 47 | 4.04 | 0.021 | 0.859 |
Table 3:Parameters of first order kinetic model for adsorption of MB by SC, PC, OSC and OPS.
| Adsorbent Code | qe exp. mg.g−1 | qe cal. mg.g−1 | K2 g. mol-1.min−1 | R2 |
|---|---|---|---|---|
| OPC | 400 | 427.35 | 0.0008 | 0.992 |
| OSC | 378 | 344.83 | 0.0002 | 0.998 |
| PC | 303 | 316.46 | 0.0002 | 0.999 |
| SC | 47 | 47.85 | 0.0026 | 0.999 |
Table 4: Parameters of second order kinetic model for adsorption of MB by SC, PC, OSC and OPS.
Evaluation of thermodynamic parameters
Thermodynamic parameters including Gibbs free energy change (ΔG), enthalpy change (ΔH) and entropy change (ΔS) were calculated from the following equations [20]:
 (8)
(8)
 (9)
(9)
 (10)
(10)
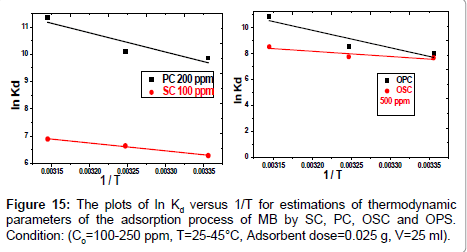
In Equation (10) the density of the solution (ρ=1000 g/L) was used to render Kd dimensionless in order for its logarithmic value to be used for the correct calculation of the thermodynamic parameters. Plot of ln Kl versus 1/T for estimation of thermodynamic parameters for the adsorption of MB onto (SC, PC, OSC and OPC) is shown in Figure 15. The values of ΔS° and ΔH° were calculated from the intercept and slope of linear plot. As seen in Table 5, positive values of ΔH° and negative ΔG° values for all temperatures indicate that MB adsorption on AC is endothermic and spontaneous.
| Adsorbents | Methylene Blue concentration (mg/L) | ΔH° (kJ/mol) | ΔS° (kJ/mol) | ΔG° (kJ/mol) | ||
|---|---|---|---|---|---|---|
| 298K | 308K | 318K | ||||
| OPC | 500 | 111.548 | 0.438 | -19.107 | -23.491 | -27.875 |
| OSC | 500 | 33.512 | 0.175 | -18.719 | -20.473 | -22.225 |
| PC | 200 | 58.519 | 0.277 | -23.998 | -26.767 | -29.536 |
| SC | 100 | 23.909 | 0.132 | -15.595 | -16.921 | -18.246 |
Table 5: Thermodynamic parameters for adsorption of MB by SC, PC, OSC and OPS at different temperatures.
Confirmed the endothermic nature of the adsorption process. The positive value of ΔS° shows the increasing randomness of the solidsolution and adsorption medium interface during the adsorption [18].
Desorption studies
Desorption of adsorbed MB from spent adsorbent was carried out using different concentration of HCl (0.1-1M). The adsorbent loaded with 50 ppm SC, 600 ppm PC, OSC, OPC of MB at optimum pH was collected and treated with 25 ml HCl and agitated till equilibrium to remove the adsorbed MB. It is revealed that for AC adsorbents the percent recovery of MB was about 98.9% for SC, 98.3% for PC, 97.5 for OSC, and 95.05% for OPC with 0.1M HCl and the remained constant with the increase of HCl concentration from 0.1 to 1.0M. These results are relatively promising, as the prepared dried papyrus plant could be regenerated for reuse, thus improving their cost-effectiveness and reducing operational cost in water treatment applications.
Conclusion
The adsorption capacity is dependent on pH solution, initial concentration, contact time, temperature and adsorbent dosage. Maximum percentage MB removal 98.62% (SC, 93.36% PC , 96.7% OSC and 97.55% OPC (about 25°C) was attained at 60 minutes for sample SC and 120 min for sample PC, OSC and OPC. The effect of pH investigated for values ranging from 2 to 10, showed maximum adsorption of MB on the activated carbon at pH 8. The equilibrium adsorption isotherms models of Langmuir, Freundlich, were tested for the quantitative description of the dye adsorption. The adsorption kinetics followed a pseudo-second order kinetic model and intra particle diffusion was involved in the adsorption process. Thermodynamic results indicated that the adsorption process was spontaneous and endothermic in nature.
References
- Al-Degs YS, El-Barghouthi MI, El-Sheikh AH, Walker GM (2008) Effect of Solution pH, Ionic Strength, and Temperature on Adsorption Behaviour of Reactive Dyes on Activated Carbon. Dyes and Pigments 77: 16-23.
- Boyer B, Cardoso NF, Lima EC, Macedo TR (2010) A Useful Organ functionalized Layered Silicate for Textile Dye Removal. Journal Hazardous Material 181: 366-374.
- de Lima ROA, Bazo AP, Salvadori DMF, Rech CM, Oliveira DP, et al. (2007) Matagenic and Carcinogenic Potential of a Textile Azo Dye Processing Plant Effluent That Impacts a Drinking Water Source. Mutation Separation Science and Technology 626: 53-60.
- Sharma YC, Uma, Upadhyay SN (2011) An economically viable removal of Methylene blue by adsorption on activated carbon prepared from rice husk. Canadian Journal of Chemical Engineering 89: 377-383.
- Allen SJ, Koumanova B (2005) Decolorization of water/wastewater using adsorption. Journal of the University of Chemical Technology and Metallurgy 3: 175-192.
- Badmus MAO, Audu TOK, Anyata BU (2006) Removal of heavy metals from industrial waste water using hydrogen peroxide. African Journal of Biotechnology 6: 238-242.
- Glossary of Ancient Egyptian civilization, The Egyptian General Book.
- Choy KKH, Mckay G, Porter JF (1999) Sorption of acid dyes from effluents using activated carbon. Resource, Conservation and Recycling 27: 57-71.
- Kumar KV (2007) Optimum sorption isotherm by linear and non-linear methods for malachite green onto lemon peel. Dyes and Pigments 74: 595-597.
- Stoeckli HF (1990) Microporous carbon and their characterization. Carbon 18: 1-6.
- Cheremisinoff NP (1999) Handbook of industrial toxicology and hazardous materials. New York, Dekker.
- Jang A, Seo Y, Bishop PL (2005) The removal of heavy metals in urban runoff by sorption on mulch. Environ Pollut 133: 117-127.
- Figueira R, Ribeiro T (2005) Transplants of aquatic mosses as biomonitors of metals released by a mine effluent. Environ Pollut 136: 293-301.
- Ho YS, Chiang TH, Hsueh YM (2005) Removal of Basic Dye from Aqueous Solution Using Tree Fern as a Biosorbent. Process Biochemistry 40: 119-124.
- Zohre Shahryari, Goharrizi SA, Azadi M (2010) Experimental study of methylene blue adsorption from aqueous solutions onto carbon nano tubes. International Journal of Water Resources and Environmental Engineering 2: 016-028.
- Kanawade SM, Gaikwad RW (2011) Removal of Methylene Blue from Effluent by Using Activated Carbon and Water Hyacinth as Adsorbent. International Journal of Chemical Engineering and Applications 2: 317-319.
- Weber TW, Chakkravorti RK (1974) Pore and solid diffusion models for fixed-bed adsorbers. AIChE Journal 20: 228-238
- Ünal Geçgel, Özcan G, Gürpinar CG (2013) Removal of Methylene Blue from Aqueous Solution by Activated Carbon Prepared from Pea Shells (Pisum sativum). Journal of Chemistry, Hindawi Publishing Corporation.
- Langergren S, Svenska BK (1898) Zur theorie der sogenannten adsorption geloester stoffe. Veternskapsakad Handlingar 24: 1-39.
- Karagoz S (2008) Activated carbons from waste biomass by sulfuric acid activation and their use on methylene blue adsorption. Bioresource Technology 99: 6214-6222.
Relevant Topics
Recommended Journals
Article Tools
Article Usage
- Total views: 14354
- [From(publication date):
specialissue-2015 - Apr 03, 2025] - Breakdown by view type
- HTML page views : 13137
- PDF downloads : 1217

