Methodology for Assessing the Tourist Potential of the Nature of the Fergana Valley Using Gis Technologies and Experimental Methods
Received: 27-Aug-2022 / Editor assigned: 29-Aug-2022 / PreQC No. jescc-22-73320 (PQ) / Reviewed: 12-Sep-2022 / QC No. jescc-22-73320 / Revised: 16-Sep-2022 / Manuscript No. jescc-22-73320 (R) / Accepted Date: 16-Sep-2022 / Published Date: 23-Sep-2022 DOI: 10.4172/2157-7617.1000640
Abstract
The article describes the methodology of the experimental analysis of operational and cost-effective assessment using geographic information system (GIS) technologies, as opposed to the assessment of the tourism potential of the nature of the Fergana Valley in Uzbekistan using long-term and costly classical approaches. Based on the ArcGIS (10.8) grid index approach of 20 natural geographical indicators of the valley, such as geographical location, relief, climate, hydrographic and biological, the level of tourism comfort was determined and the location of 6 tourist-recreation zones were defined. The level of accuracy of the tourist-recreational zones all situated utilizing GIS technologies was confirmed by field-expedition approaches.
Keywords: Geographical location, Relief, Climate, Hydrographic, Biological, Comfort, Grid index, Assessment; Tourist route
Introduction
From the first days of independence, tourism has been paying attention to the level of state policy in Uzbekistan. The necessary organizational and legal mechanism for the development of tourism has been created and important normative legal acts are being adopted. In particular, the Presidential Decrees of the Republic of Uzbekistan, on 05.01.2019, “Complex measures to develop tourism in the country as one of the strategic sectors to diversify the national economy, accelerate the development of regions, create new jobs, increase incomes and living standards, increase the investment attractiveness of the country” and, on 17.02.2020, “On additional measures for the accelerated development of tourism in the Republic of Uzbekistan”, the Law of the Republic of Uzbekistan “On Special Economic Zones” which aimed at “establishment of special economic zones, as well as tourist and recreational zones, with special boundaries and special legal regime to attract foreign and domestic investment, high technology and management experience for the accelerated socio-economic development of the region” opened the door to new opportunities in the sphere of tourism.
In the Fergana Valley, there is an opportunity to meet almost all types of tourism. The nature, climate, inland waters, soils, flora and fauna of the valley played a key role in determining tourism opportunities. According to the diversity of natural resources in the valley, the rapid and qualitative determination of the extent of their impact on tourism using modern approaches remains a topical issue today. Given the above, we aimed to determine the tourism potential of the Fergana Valley using modern GIS programs in our study. GIS – a computer system that stores, processes, displays and analyzes data by interconnecting geographic references with graphical features [1].
The use of the Geographic Information System (GIS) is enhancing day by day, as it makes it easier to map information about evaluation factors in storing, updating, grouping, analyzing, interconnecting and research planning, and the accuracy rate is much lower. With the development of computer and remote sensing techniques, computer software has replaced several tourist approaches [2-3]. Such kinds of programs are distinguished by the fact that they are aimed at the most efficient and cost-effective management of existing data in the implementation of large-scale and complex projects [4].
One of the urgent tasks of today is to assess the geographical tourism of the region based on natural geographical indicators and to provide an operational and scientific justification of the tourism potential of the region by summarizing the assessed indicators. These days, such tasks are carried out by geographic information systems (GIS). This system is capable of performing multiple tasks such as collecting, storing and analyzing, drawing conclusions, updating and creating information about the characteristics and planning objectives, and sources of the natural environment. The use of GIS programs in the formation of tourism information systems the impact of tourism on the environment and vice versa [5], and the identification [6] of suitable areas for tourism is considered effective.
Materials and methods
Geo information technologies (ArcGIS, QGIS, and NEXTGIS) and experimental approaches were used in the research. The indicators, which are the basis for the assessment of the valley area, were processed and evaluated based on 2021 data from the Sentinel-2 satellite. In addition, assessments were conducted across the region based on data from databases such as Open Topography, Worldclim, Hydrosheds, Humdata, Globio, Gislounge, and FAO SOIL PORTAL. We used the following evaluation criteria in the geographical tourism assessment of the natural geographical features of the Fergana Valley (Table 1).
| № | Points | Comfort classification |
|---|---|---|
| 1 | 81-100 | Comfortis the availability of fully satisfactory conditions for one’s travel in the area |
| 2 | 61-80 | Subcomfort is the availability of satisfactory conditions for one’s travel in the area |
| 3 | 41-60 | Discomfort is the presence of conditions in the area that are partially satisfactory for one’s travel |
| 4 | 21-40 | Subdiscomfort is the presence of unsatisfactory conditions for one’s travel in the area |
| 5 | 0-20 | Extradiscomfort is the lack of conditions for one’s travel in the area |
Table 1: Assessment criteria of the geographical tourism potential of the region.
The assessment of the tourism potential of the nature of the Fergana Valley is based on the grid index approach. The grid index approach [7] is a predefined division index in which a region is divided into rectangular grids because it represents a predefined spatial area. The grid object location covers part of the space within the grid boundaries, and that object is considered to belong to that grid. The size of the grids is selected based on the object of study. Separated grids are coded, and the objects in these codes are evaluated based on defined criteria.
Results
In geographic tourism, the natural geographical features of a place are crucial in choosing a particular area that tourists visit. The availability and accessibility of natural resources have a significant impact on the scale, pace and tourism development. Natural geographical factors in the development of geographical tourism are reflected in the natural geographical location, relief, climate, hydrography, flora and fauna.
Tourist aspects of the natural geographical location of the Fergana Valley
The Fergana Valley is situated in the eastern part of Uzbekistan, on the upper sides of the Syrdarya River, its natural boundaries pass through Mongolian mountains in the west, Qurama, Karamazor in the north-west, Chatkal in the north, Fergana, Otoynak in the east, Alay and Turkestan mountains in the south. It is connected to the Dalvarzin and Mirzachul plains by the narrow (8-10 km) west side through the Khojand GIS. The area is 78 thousand km2. The length of the valley is 475 km from the west (69015' N) to the east (74055' N) and 260 km from the north (42000' N) to the south (39024' N). The total length of the border of the Fergana Valley is more than 2000 km.
The natural geographical location of the region plays an important role in the development of tourism. For instance, the proximity of the region to the sea, its richness in beautiful mountainous and forested areas, its location relative to major travel countries, important international transit routes and favorable climatic zones of the Earth.
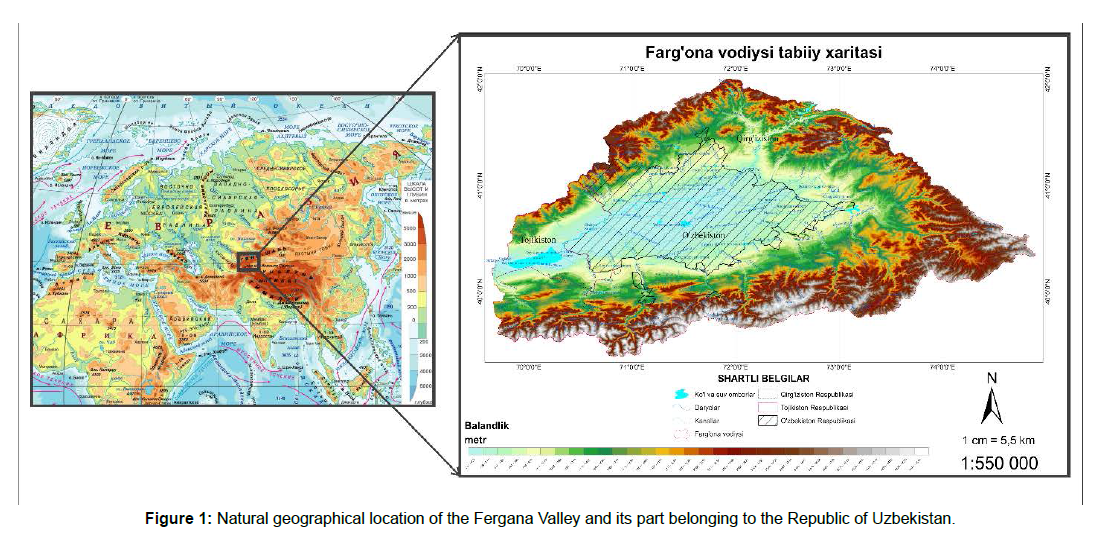
The Fergana Valley is situated in the center of the Eurasian continent, away from the free economic and political zone, at a distance of more than 1,500 km to the nearest Indian Ocean, and is surrounded by high mountains. However, the fact that “the Great Silk Road” – Andijan-Osh-Ergashtom-Kashgar has passed through the valley since ancient times can have a significant impact on the development of tourism. Because the valley is situated in the continental type of temperate climate zone, the touristic potential is also underestimated. The part of the region consisting of the Central Fergana Plain and cultural landscapes is situated in the Republic of Uzbekistan (Figure 1)
The Fergana Valley is situated on the territory of 3 states, covering 23% of the territory of the Republic of Uzbekistan, 68% of the territory of the Kyrgyz Republic and 9% of the territory of the Republic of Tajikistan. The Fergana Valley is unevenly distributed across the republics in terms of natural geography. Since the Uzbek part of the total area of the valley is mainly flat, the components of nature are distributed accordingly (Table 2).
| Natural geographical features of the earth's surface | Area, % | ||
|---|---|---|---|
| In the Fergana valley | The part in the Republic of Uzbekistan | Regarding the valley | |
| Plain | 14,2 | 50,8 | 82,2 |
| Hill | 47,7 | 46,4 | 22,4 |
| Mountain | 38,1 | 2,8 | 1,7 |
| The areas of water (sea, lake, reservoir) * | 1,23 | 2,07 | 38,92 |
| Forest* | 3,68 | 0,10 | 0,65 |
| Grasslands * | 3,97 | 0,15 | 0,88 |
| Flooded vegetation such as wetlands, rice paddies* | 0,04 | 0,07 | 35,66 |
| Crops * | 17,35 | 53,55 | 70,91 |
| Scrubland * | 55,54 | 19,31 | 8,04 |
| City, suburbs, highways, railroads and paved areas* | 7,74 | 21,63 | 64,20 |
| Open rocky soils and bare areas with little or no vegetation* | 8,71 | 3,12 | 8,24 |
| Permanent snow and icy areas* | 1,73 | 0 | 0 |
| Protected areas | 1,20 | 0,22 | 4,28 |
Table 2: The ratio of natural geographical indicators of the Fergana Valley and the part of Uzbekistan.
* 2020 Global Land Use Data / Caitlin Dempsey / June 24, 2021 | Compiled by the author based on GIS Data.
There are certain inconveniences in organizing tourism in certain areas and determining the boundaries of the area. For instance, the incompatibility of political and administrative borders with natural borders, or the fact that several countries are situated in a particular natural geographical area and their tourism policy is diverse. Therefore, almost all scientific research in the sphere of tourism in Uzbekistan has taken administrative units as the object of research. For instance, these include “Ecological tourism in Uzbekistan and its natural geographical aspects” by N T Shomuratova (2012), “Natural geographical aspects of agritourism (on the example of Uzbekistan)” by Sh T Yakubjanova (2018), “Regional, Periodic and Complex Features of Ecotourism in Namangan Region” by B Khamalov’s (2018), “Economic Geographical Features of Tourism Development in Andijan Region” by MM Mahmudov (2021). However, our research is devoted to the natural geographical aspects of the Fergana Valley in Uzbekistan.
Natural components such as topography, climate, hydrography, flora and fauna were taken as factors determining the natural geographical aspects of geographical tourism and various approaches were used to evaluate them [8].
Tourism assessment of relief
The relief of the area has great significance in attracting tourists, as well as creating several inconveniences. For instance, in areas of medium and high mountainous terrain, it is complicated and expensive to build highways and other roads, however, such places compensate for the above inconveniences with beautiful scenic landscapes for tourists. Mountainous areas are characterized by great tourism opportunities due to the cool mountain air, the abundance of ultraviolet rays, the possibility of organizing skiing, etc. The relief of the Fergana Valley in Uzbekistan can be divided into the following types of elevations. These are high plains with absolute heights of 300-500 m, low hills (500- 800 m), medium-high hills (800-1000 m), high hills (1000-2000 m), medium-high Mountains (2000-3000 m) and high mountains (3000- 5000 m).
Based on the analysis of the tourism literature [9], two main indicators of relief -absolute height and slope - play a role in tourism. The assessment of the comfort of the absolute height of the relief of the Fergana Valley was carried out in the following methodological steps:
➢ Open Topography-High-Resolution Topography Data and Tools database raster data obtained via Data→Data catalog→Global & Regional DEM commands;
➢ The collated raster data was restricted to the research object using the Arc Toolbox→Spatial Analyst Tool→Extraction→Extract by Mask command using ArcGIS software;
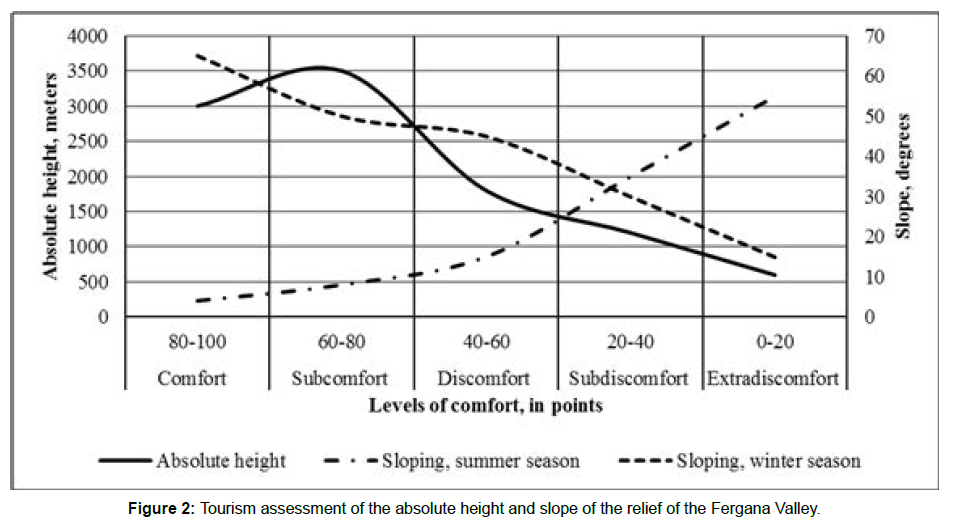
➢ The absolute elevation of the restricted area was classified by 5 levels of tourism comfort using Layer Properties→Classified→ Classification and evaluated by comfort level (Figure 2).
➢ In addition to the above methodological step in assessing the tourism comfort of a relief slope, the slope of the restricted area was determined by Arc Toolbox→Spatial Analyst Tools→Surface→Slope and it was assessed seasonally (summer and winter) (Figure 2).
The slopes shown in Figure 2 are evaluated for summer and winter seasons in terms of tourism comfort. In the summer, as the slope increases, the level of comfort for tourists decreases. In winter, on the other hand, comfort increases as the slope increases. Because the slope plays an important role in winter tourism. For instance, if the speed of skiing on 15° slopes is 60-70 km/h, on 70° slopes this figure reaches 200 km/h. In winter, skiers mostly choose slopes up to 15°, while professional skiers prefer slopes up to 70°.
Tourism assessment climate
Climate has both positive and negative effects on the organization of tourism and recreational activities [10-13]. Tourists mainly choose resorts where the climatic conditions are comfortable. The vagaries of nature, which are typical of unstable climates, sharply reduce the flow of tourists to areas with frequent emergencies. The main tourist areas of both hemispheres are typical of the region where the air temperature is around 20-260C, affected by temperate, subtropical and sea winds. The main features in terms of the impact of climate on the human body are the light and ultraviolet regime of sunlight [14]. The Fergana Valley is situated between 41054' and 39087' s. This region differs from other tourist areas by its very high level of ultraviolet rays. The valley area is most exposed to ultraviolet light, mainly in April-September (Table 3).
| SU-index | Levels of comfort for the tourism | SU level by months in the Fergana Valley | |||||||||||
|---|---|---|---|---|---|---|---|---|---|---|---|---|---|
| 1 | 2 | 3 | 4 | 5 | 6 | 7 | 8 | 9 | 10 | 11 | 12 | ||
| 0-2 | Comfort | + | |||||||||||
| 3-5 | Subconfort | + | + | + | |||||||||
| 6-7 | Discomfort | + | + | ||||||||||
| 8-10 | Subdiscomfort | + | + | + | + | + | + | ||||||
| 11+ | Extradiscomfort | ||||||||||||
Table 3: Solar Ultraviolet (SU) Tourism comforts in the Fergana Valley (http://hikersbay.com/climate/uzbekistan compiled by the author on the basis of data).
The most important meteorological indicators that affect the human body - are air temperature and humidity, atmospheric pressure, wind direction and speed, and precipitation. They are given in different units of measurement and have a significant impact on the duration of the tourist-recreational period of the region (Table 4).
| Air temperature (0С) | Monthly precipitation (mm) | The wind speed km/h) | Assess the geographical tourism comfort of the area | Evaluation score |
|---|---|---|---|---|
| 20-26 | 0.0-14.9 | < 2.88 | Comfort | 80-100 |
| 19/27 | 15.0-29.9 | 2.88-5.75 | ||
| 18/28 | 30.0-44.9 | 5.76-9.03 | Subcomfort | 60-80 |
| 17 / 29 | 45.0-59.9 | 9.04-12.23 | ||
| 16 / 30 | 60.0-74.9 | 12.24-19.79 | Discomfort | 40-60 |
| 10-15/31 | 75.0-89.9 | 19.80-24.29 | ||
| 5-9/32 | 90.0-104.9 | 24.30-28.79 | Subdiscomfort | 20-40 |
| 0 - -4/33 | 105.0-119.9 | 28.80-38.52 | ||
| -5 – -1/34 | 120.0-134.9 | 38.52 < | Extradiscomfort | 0-20 |
| -10 – -6/36 | 135.0 < |
Table 4: The climatic indicators of the Fergana Valley are the levels of comfort for tourists (Mieczkowski, compiled by the author on 1987 classification indicators).
TCI = 2[(4CID) + CIA + (2P) + (2S) + W] (1)
Here: TCI – climate index of tourism, CID – maximum monthly temperature (0C), CIA – minimum monthly temperature (0C), P – average monthly precipitation (mm), S – length of day (hours), W – average wind speed (km/h).
The CID, CIA, P, S, and W used in the formula were given 5 points each, the result was multiplied by 2, and the land area was evaluated on a 100-point scale.
TCI = 2[(4х5)+(5)+(2х5)+(2х5)+(5) = 100
However, because the Fergana Valley is subregional in the taxonomic unit of zoning for tourism purposes in terms of the scale of geosystems, the following changes and additions were made to the above formula 1:
Firstly, S is the length of the day (hours), i.e., if the time between sunrise and sunset varies by up to 24 hours in regions on a global scale, it does not exceed 1 hour in our research object. Therefore it is not advisable to take into account the length of the day (S).
Secondly, because the day length (S) indicator was not taken into account, the tourism climate indicator was given 10 points instead of 5 points for each of the CID, CIA, P, and W indicators for a 100-point quality assessment.
Thirdly, all the figures in formula 1 are multiplied by 2. In this case, the maximum monthly air temperature (4CID) is 40 points. The remaining 60 points remain relevant for all indicators of climate.
If we multiply the maximum monthly air temperature (4CID) of the Fergana Valley by 2, it is 80 points. The remaining 20 points stay relevant for all climate indicators. This leads to a biased result in the tourism assessment of climate indicators with a single indicator. To solve this problem, we do not multiply all climatic indicators specified in formula 1 by 2, but increase the minimum monthly air temperature (CIA) of the Fergana Valley at the subregional level, the average monthly precipitation (P), the average wind speed (W) by 2 reflects the objective situation in the assessment.
TCI = (4х10)+(2х10)+(2х10)+(2х10) = 100
Taking into account the above-mentioned three conditions, the Fergana Valley at the subregional level was qualitatively marked by the following formula 2 in the tourism assessment of climatic indicators of the Uzbek part.
TCI = (4CID) + (2CIA) + (2P) + (2W) (2)
Here: TCI is a climate indicator in tourism; CID – monthly maximum air temperature (0C), CIA - monthly minimum air temperature (0C), P – monthly average precipitation (mm), W - average wind speed (km/h).
The climate indicators presented in Formula 2, developed by us, are usually of two types - traditional and modern technologies can be used to form a database. Data obtained by the traditional approach are given by sparsely situated meteorological stations. For instance, the average annual air temperature in the Fergana Valley decreases from its central part of the desert (+130 C) to the mountain (-70 C). In the hottest summer of the year, the average monthly air temperature drops from its desert central part (+ 260C) to the mountain (+ 40C). Conversely, the average annual precipitation increases from its desert central part (80 mm) to the mountain (250 mm), and this law of nature also applies to the relative humidity of the atmospheric air.
The Kokand wind, which is typical of the Fergana Valley, averages 25 m / sec from the neighboring Mirzachol to the valley in the spring and autumn, and the Bekabad Wind, which averages 15-20 m / sec from the valley to the Mirzachol in the winter. blows at speed. In the valley, the figure is 5 m/s. However, the data obtained traditionally do not allow to get accurate data for tourist facilities situated far from the meteorological station.
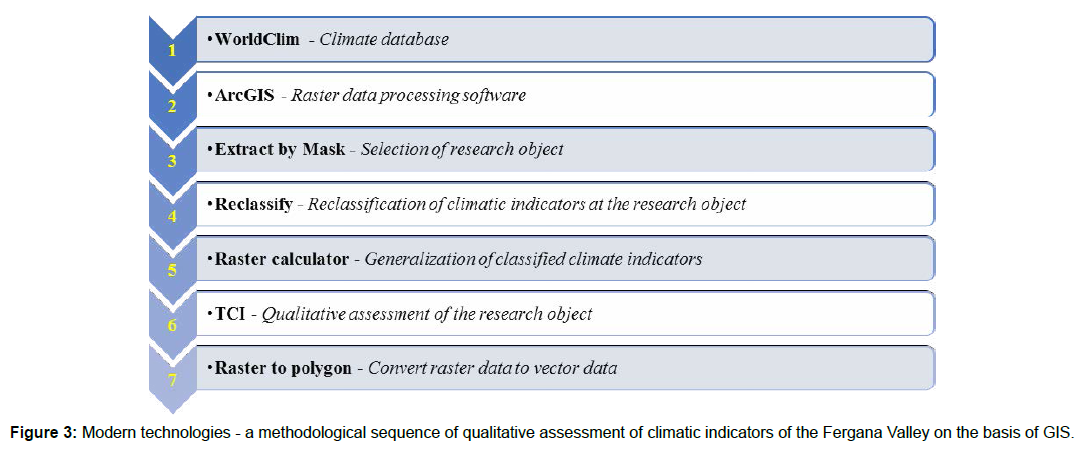
According to the international experience, we performed the Ferghana Valley climate indicators in the qualitative assessment of tourism comfort in a geographical information system (GIS) program, which is one of the modern technologies, and in the methodological sequence shown in Figure 3.
Initially, the raster data in the WorldClim database was limited to the Uzbek part of the Fergana Valley using the ArcGIS program using the ArcToolbox→Spatial Analyst ToolExtraction→Extract by Mask. Then, the climate indicators in Formula 2 for the restricted Area were selected and classified into again 10 parts using the ArcToolbox→Spatial Analyst ToolReclass→Reclassify command. Classification indicators were calculated based on formula 2 for 5 levels of tourism comfort utilizing the command ArcToolbox→Spatial Analyst ToolMap Algebra→Raster Calculator.
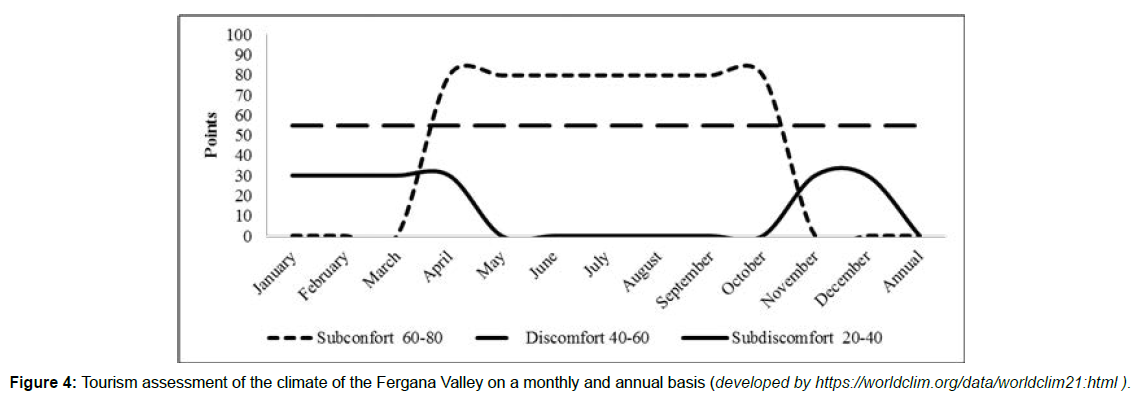
The calculated climate indicators were converted from raster format to vector format using the ArcToolbox→Conversion Tools→From Raster→Raster to Polygon commands and evaluated for 5 levels of tourism comfort utilizing the Layer Properties→Symbology→ Quantities command (Figure 4).
Tourism assessment of hydrography
In the literature on the assessment of hydrographic objects from a touristic point of view [15-16] waterways (number and length of rivers, streams and canals); number and area of water basins; hydrographic network density; indicators such as the number of mineral waters and springs. Data on hydrographic objects that directly affect tourism in the Uzbek part of the Fergana Valley were obtained from sources situated at www.hydrosheds.org, www.humdata.org.
Data on the number and length of waterways in the valley were gathered from the Humdata database. The HOTOSM Uzbekistan Waterways (OpenStreetMap Export) shapefile data in the database was processed via ArcGIS using the steps systematically shown in Figure 5.
Using the order Geoprocessing→Intersect, waterways belonging to the object of study were separated from the general waterways of Uzbekistan. Rivers, canals, and streams were separated from the selected waterways by the Select by Attributes command, and their number and length were calculated as a result of the Selection→Create Layer From Selected Features command. According to research, the Uzbek part of the Fergana Valley has about 30 rivers (1,100 km), more than 10 canals (2,000 km) and about 70 rivers (1,400 km). Determining the density of a hydrographic network is found by dividing the length of the stream situated in the study object by the basin area (formula 3).
D=L/A (3)
here: D - hydrographic network density, L - hydrographic network length, A - basin area.
The shapefile data in the Hydrosheds database was processed using ArcGIS software. Using the ArcGIS program, the density of the hydrographic network (surface river, stream, canal, collector length) in the Fergana Valley was taken for every 10 km2 of network and the level of tourism comfort was assessed. The network size is selected depending on the size of the research object. For instance, the size of the network in the Fergana Valley can be 5 km2, and 1 km2 in the districts.
Estimation of the density of hydrographic networks of the valley with a network size of 10 km2 was carried out in the following sequence of methodological steps:
Step 1. The hydrographic network and the research object were designed using the commands ArcToolbox→Data Management ToolsProjections and Transformations→Project.
Step 2. A 10x10 km2 grid index was created across the object using the ArcToolbox→Cartography Tools→Data Driven Pages→Grid Index Features command.
Step 3. Designed hydrographic networks are placed in the grid index created by the command Geoprocessing→Intersect.
Step 4. Using the GeoprocessingDissolve command, the PageNumber row of the hydrographic networks placed in the grid index was separated.
Step 5. The lengths (km) of the hydrographic networks in the selected page number row were calculated using the Calculate Geometry command.
Step 6. The index area of the separated grids (km2) was calculated using the Calculate Geometry command.
Step 7. The number of hydrographic networks placed in the grid index was calculated using the ArcToolbox→CountFeature→CountFe atureByLocation commands for the grids.
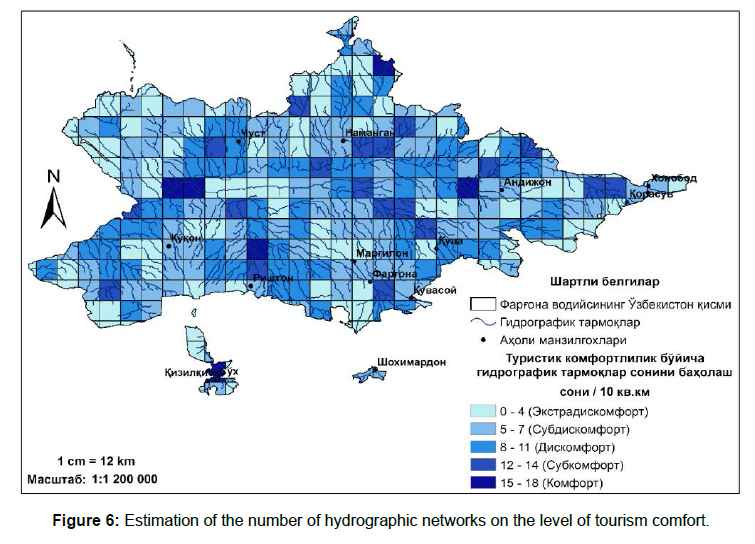
Step 8. The number of calculated hydrographic networks was estimated at 5 levels of tourism comfort using the Layer Properties→Symbology→Quantities command (Figure 6).
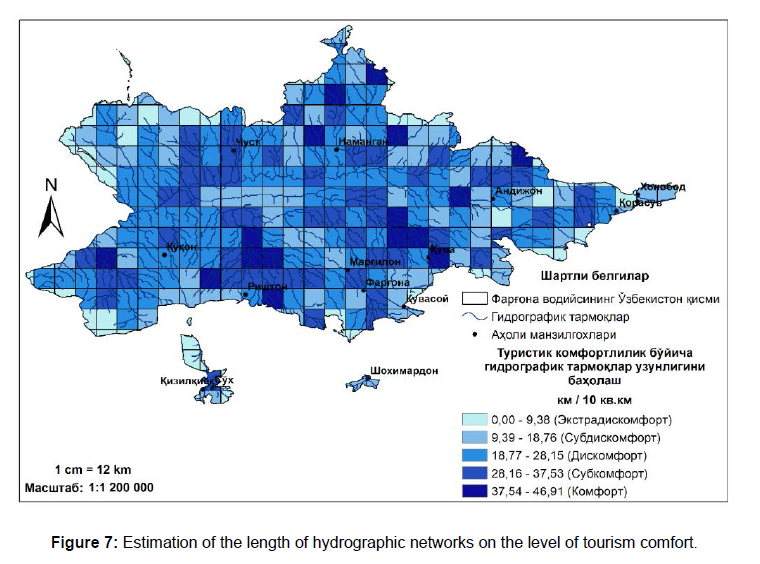
Step 9. The calculated hydrographic network length was combined into the object grid index with the Joins and Relates→Join→ command. The length of the hydrographic networks was assessed on 5 levels of tourism comfort using the Layer Properties→Symbology→Quantities command (Figure 7).
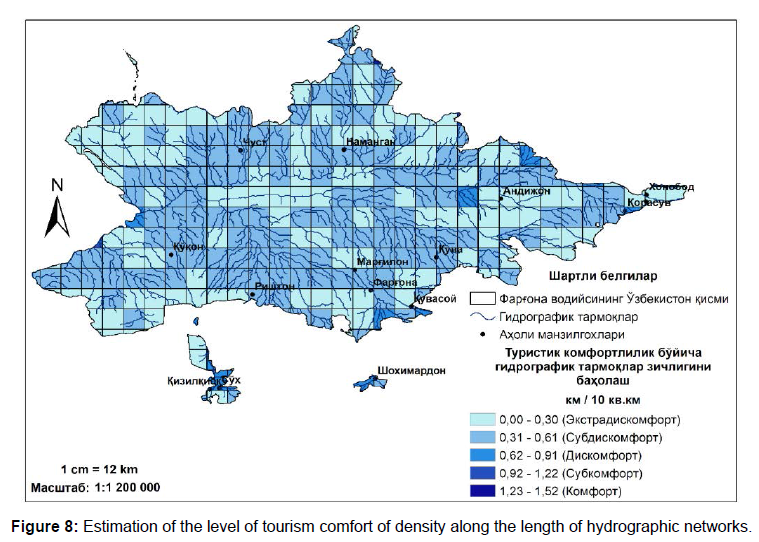
Step 10. The density of the hydrographic networks was determined by dividing the length of the L-hydrographic networks given in formula 3 by the A-basin area. These tasks were performed using the Field Calculator command of ArcGIS.
Step 11. Based on the calculated results, the density of hydrographic networks of the Fergana Valley Uzbekistan was assessed on 5 levels of tourism comfort by the order Layer Properties→Symbology →Quantities (Figure 8).
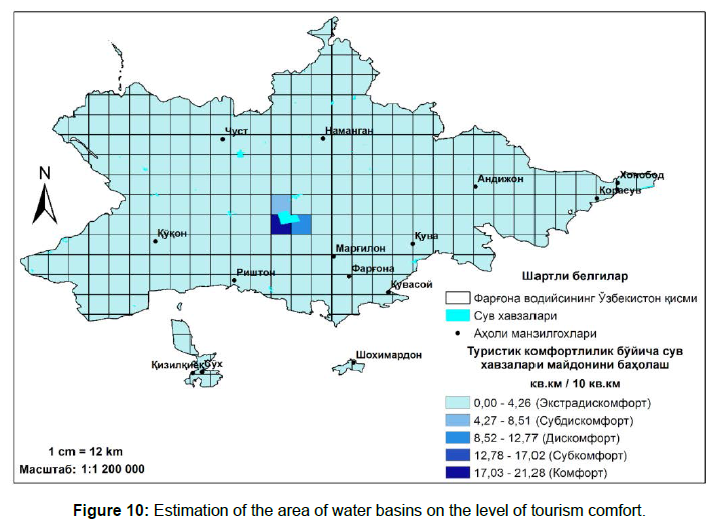
Data on the number of reservoirs and their area were obtained from the Hydrosheds and Humdata bases. The shapefile data from the databases were combined in ArcGIS using the Geoprocessing→Merge command, and only those belonging to the scope of the research object were extracted from them using the Geoprocessing→Intersect command (Figure 9). The number and area of all situated water basins were calculated. According to research, there are about 70 reservoirs in the valley. Their total area is 78 km2, occupying 0.37% of the valley area. The total number of reservoirs is 19 including floodplains (2) and reservoirs (31). They make up about 80% of the total body of water.
Using the ArcGIS program, the following steps were taken to assess the area of water bodies situated at the facility in terms of tourism comfort:
Step 1. Reservoirs and research objects were designed through the commands ArcToolbox→Data Management Tools→Projections and Transformations →Project.
Step 2. A 10x10 km2 grid index was created across the object through the ArcToolbox→Cartography Tools→Data Driven Pages→Grid Index Features command.
Step 3. Designed reservoirs were placed in the grid index created by the Geoprocessing→Intersect command.
Step 4. The Geoprocessing→Dissolve command separates the rows of water basins placed in the grid index (PageNumber).
Step 5. The area of the reservoirs in the selected page number row (km2) was calculated using the Calculate Geometry command.
Step 6. The index area of the separated grids (km2) was calculated via the Calculate Geometry command.
Step 7. The calculated water area was merged into the object grid index with the Geoprocessing → Merge command. The area of water basins is assessed on 5 levels of tourism comfort by the command Layer Properties→Symbology →Quantities (Figure 10).
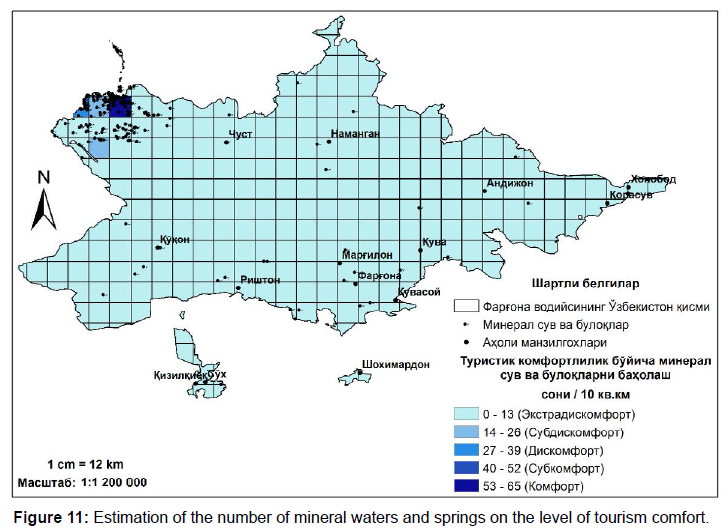
There are about 300 mineral waters and springs in the Uzbek part of the Fergana Valley. These days, recreation areas and sanatoriums have been built in the areas where they are situated. Data on mineral waters and springs were obtained through the NEXTGIS program QuickOSM→Natural→ Spring→Fergana, Andijan, Namangan regional commands. Data on mineral water and springs were quantified based on tourism comfort. The assessment was performed in the following steps in the ArcGIS program.
Step 1. Mineral water and springs and the research object were designed through the commands ArcToolbox→Data Management Tools→Projections and Transformations→Project.
Step 2. A 10x10 km2 grid index was created across the object using the ArcToolbox→Cartography ToolsData Driven Pages→Grid Index Features command. The size of the grids is opted depending on the size of the research object.
Step 3. Designed mineral water and springs were placed in the grid index created by the Geoprocessing→Intersect command.
Step 4. The number of mineral water and springs sited in the grid index was calculated through the ArcToolbox→CountFeature→Coun tFeatureByLocation commands for the grids.
Step 5. The calculated number of mineral waters and springs was marked on 5 levels of tourism comfort through the Layer Properties→Symbology →Quantitiescommand (Figure 11).
Tourism assessment of biological indicators
The regional biodiversity contributes greatly to the development of tourism, including ecotourism and agrotourism [17]. In addition, the areas situated for the protection and reproduction of declining flora and fauna also play a special role in the development of tourism. In the Uzbek part of the Fergana Valley, such areas are relatively rare. Currently, there are 3 natural monuments in the area. In assessing the tourism potential of the region, the following were selected as natural geographic indicators reflecting biodiversity. These include phyto and zoobiological diversity, soil fertility, forests and shrubs, pastures, irrigated arable land, and rocky and sandy areas.
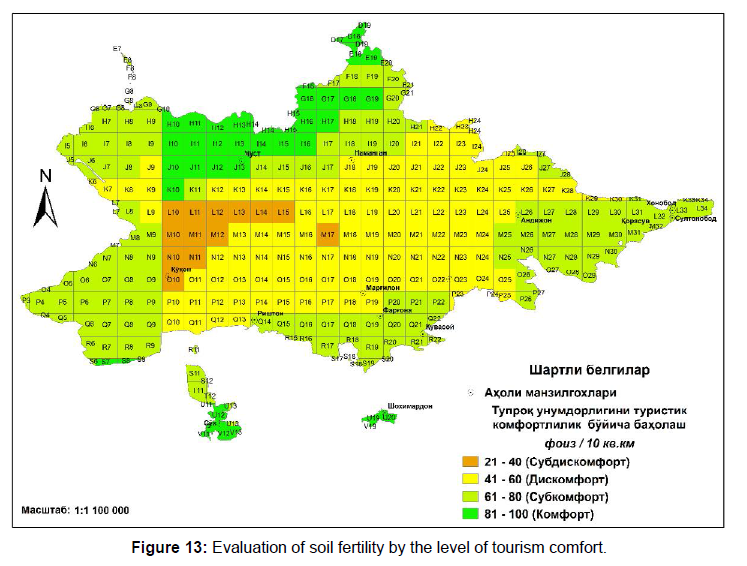
In the assessment of phyto and zobiological diversity of the research object based on tourism comfort from the database www.globio.info, soil data from the FAO-UNESCO Soil Map of the World shapefile data from the FAO SOILS PORTAL database and forest, shrub, pasture, irrigated arable land, rocky and sandy field data were used from 2020 Global Land Use Data (Sentinel-2 10m Land Use / Land Cover Timeseries) sources situated on the portal www.gislounge.com. Above mentioned raster and shapefile data situated in the databases were processed through ArcGIS software. The processing was carried out in the following stages.
Step 1. The raster shapefile data obtained were restricted by the ArcToolbox→Spatial Analyst Tool→Extraction Extract by Mask command using the ArcGIS program, and the shapefile data by the Geoprocessing→ Intersect command;
Step 2. The raster data for biological indicators in the restricted area was reclassified through the ArcToolboxSpatial Analyst Tool→Reclass→Reclassify command.
Step 3. The biological data and research object in the reclassified raster and shapefile format was designed using the commands ArcToolbox→Data Management Tools→Projections and Transformations→Project.
Step 4. A 10x10 km2 grid index was created across the object using the ArcToolbox→Cartography Tools→Data Driven Pages→Grid Index Features command.
Step 5. Designed biological data is placed in the grid index created by the command Geoprocessing→Intersect.
Step 6. Geoprocessing→Dissolve commands the flora and fauna species placed in the grid index to be separated from the page number (PageNumber).
Step 7. Biological indicators are assessed on 5 levels of tourism comfort through the command Layer Properties→Symbology→Quantities (Figure 12-13).
The natural indicators of the valley were digitized through the GIS program (ArcGIS 10.8) and their quantitative aspects were divided into 5 levels of tourism comfort. The tourism potential of the region was assessed based on 20 natural indicators. These evaluation indicators were divided into 4 groups (Table 5).
| Assessment indicators of the geographical tourism comfort of the Fergana Valley | Measurement unit | Assessment criteria (10 sq. km grid index) | ||||
| Extradiscomfort | Subdiscomfort | Discomfort | Subcomfort | Comfort | ||
| 0-20 | 21-40 | 41-60 | 61-80 | 81-100 | ||
| Geomorphological indicators | ||||||
| Absolute height | meters | 323-600 | 601-1200 | 1201-1800 | 1801-2400 3001-3426 | 2401-3000 |
| Sloping (summer season) | degrees | 70-57 | 56-43 | 42-29 | 28-15 | 14-0 |
| Sloping (winter season) | degrees | 0-14 | 15-28 | 29-42 | 43-56 | 57-70 |
| Climate indicators | ||||||
| Monthly maximum air temperature | degrees | 36-34 | 33-32 | 31-30 | 29-28 | 27-20 |
| Monthly minimum air temperature | degrees | -10 - -1 | 0-9 | 10-16 | 17-18 | 19-20 |
| Monthly precipitation | millimeters | 135-120 | 119,9-90 | 89,9-60 | 59,9-30 | 29,9-0 |
| Wind speed | kilometers / hour | >-38,52 | 38,52-24,30 | 24,29-12,24 | 12,23-5,76 | 5,75-0 |
| Hydrographic indicators | ||||||
| The number of hydrographic networks | number | 0-4 | 5-7 | 8-11 | 12-14 | 15-18 |
| Length of hydrographic networks | kilometers | 0-9,38 | 9,39-18,76 | 18,77-28,15 | 28,16-37,53 | 37,54-46,91 |
| The density of hydrographic networks | kilometers /sq. km. | 0-0,30 | 0,31-0,61 | 0,62-0,91 | 0,92-1,22 | 1,23-1,52 |
| Water basin area | hectare | 0-465,04 | 465,05-930,08 | 930,09-1395,12 | 1395,13-1860,16 | 1860,17-2325,2 |
| The number of mineral waters and springs | number | 0-13 | 14-26 | 27-39 | 40-52 | 53-65 |
| Biological indicators | ||||||
| Phytobiological diversity | number | 0-0,1 | 0,1-0,3 | 0,3-0,5 | 0,5-0,6 | 0,6-0,8 |
| Zoobiological diversity | number | 0-0,1 | 0,1-0,3 | 0,3-0,6 | 0,6-0,8 | 0,8-0,9 |
| Soil fertility | percent | 0-1,2 | 1,3-2,4 | 2,5-3,6 | 3,7-4,8 | 4,9-6 |
| Area of forests | hectare | 0-19,4 | 19,5-38,8 | 38,9-58,2 | 58,3-77,6 | 77,7-97 |
| Scrublandarea | hectare | 0-1501,6 | 1501,7-3003,2 | 3003,3-4504,8 | 4504,9-6006,4 | 6006,5-7508 |
| Grassland’s area | hectare | 0-17,4 | 17,5-34,8 | 34,9-52,2 | 52,3-69,6 | 69,7-87 |
| Cropsareas | hectare | 7395-5917 | 5916-4438 | 4437-2959 | 2958-1480 | 1479-0 |
| Area of rocky and sandy areas | hectare | 3615,3-2892,25 | 2892,24-2169,19 | 2169,18-1446,13 | 1446,12-723,07 | 723,06-0 |
Table 5: Natural geographical indicators determining the geographical tourism potential of the Fergana Valley.
The method of grid index was used to estimate the area. In the distribution of values of natural geographical indicators on the level of tourism comfort, the object of study, especially the Uzbek part of the Fergana Valley, is taken into account. For instance, when forest areas in a region are placed in the grid index, the grid with the largest forest area is assumed to be 100 percent and the values of the remaining grids are calculated based on that. This means that the selected values do not serve as a basis for evaluating other research objects in terms of levels of tourism comfort.
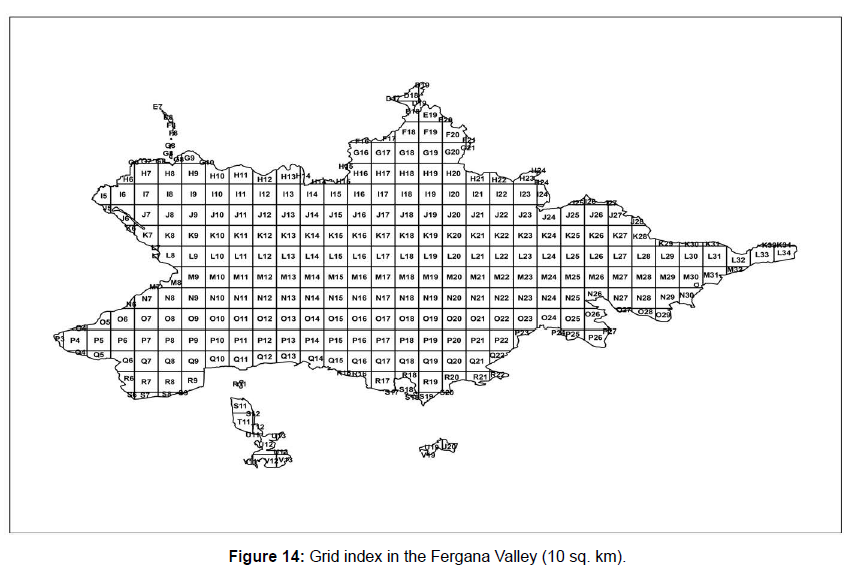
The results of the tourism assessment of the natural features of the Fergana Valley are summarized as follows. Initially, the area was divided into 304 grids of 10 sq. km. The separated grids were indexed and named (Figure 14). All identified natural indicators were evaluated on separate grids.
20 natural geographical indicators were taken as indicators in the assessment of the geographical tourism potential of the valley, and were divided into geomorphological (3), climatic (4), hydrological (5) and biological (8) groups. Each of the separated groups was evaluated individually and in a generalized manner. In the tourism assessment of natural geographical indicators gathered into groups, the grid index was calculated using the formula for finding the arithmetic mean (Formula 3).

here: a – is the natural geographic indicator, and n – is the number of natural geographic indicators.
In the generalization of natural geographical indicators, all indicators were brought to a single value. That is, each indicator was evaluated with numbers from 1 to 5 (from extra system to comfort). Based on these values, the indicators situated in each grid were evaluated by their value. To do this, in ArcGIS, the grids were calculated by comfort levels using the arithmetic mean formula using the Open Attribute table→Table Options→Add Field→Field Calculator commands. The value of the calculated grids is estimated on 5 levels of tourism comfort using the command Layer Properties→Sym bology→Quantities. The work on the geographical tourism assessment of the natural geographical features of the Fergana Valley yielded the following results.
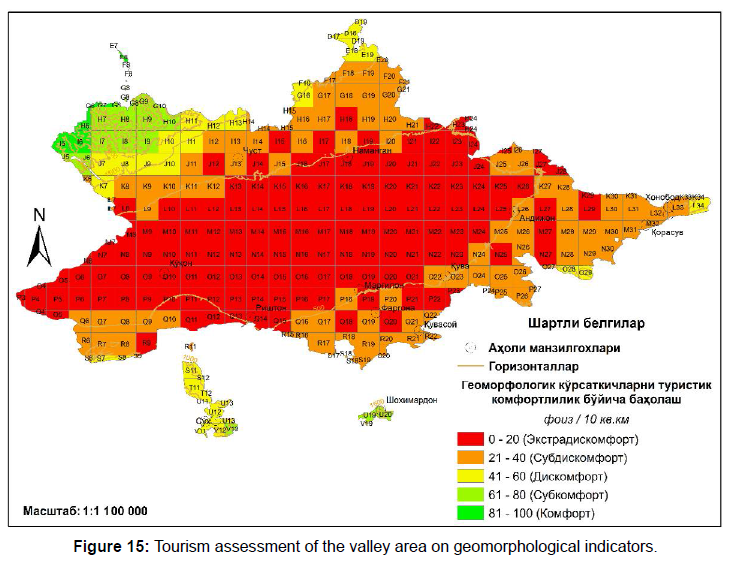
The group of geomorphological indicators includes the absolute height and slope of the area. The following results were obtained by separately evaluating the indicators in this group and summarizing the results obtained (Figure 15).
From the results of the assessment of geomorphological indicators, it can be seen that almost half of the valley area was assessed with an extra discomfort degree, while 2 percent of the area was assessed with a comfort level. It can be seen that the indicators in this group are characterized by a very low level of comfort for tourism in the valley area (Table 6).
| № | Levels of comfort | Number of grids | Percentage | |
|---|---|---|---|---|
| Comfort | 81-100 | 6 | 2 | |
| Subcomfort | 61-80 | 19 | 6 | |
| Discomfort | 41-60 | 30 | 10 | |
| Subdiscomfort | 21-40 | 103 | 34 | |
| Extradiscomfort | 0-20 | 146 | 48 | |
| Total: | 304 | 100 | ||
Table 6: Location of geomorphological indicators in the grid index separated by the territory of the valley.
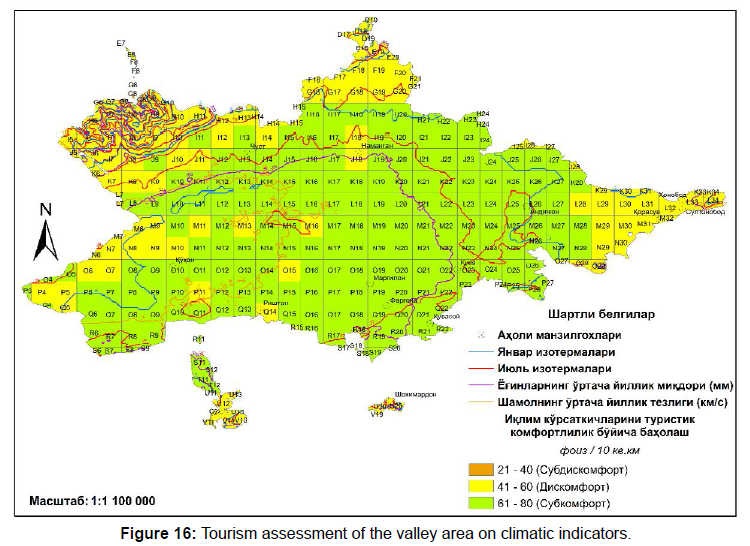
The group of climatic indicators includes measurements such as monthly maximum and minimum temperature, monthly precipitation and wind speed. The following results were obtained by evaluating each of the indicators in this group separately and summarizing the results (Figure 16).
Summarizing the results of the assessment of climatic indicators shows that 3/5 of the valley area is occupied by subcomfort areas. It also consists of 2/5 of the uncomfortable areas. However, it should be noted that there are no comfort and extra discomfort zones in the valley area (Table 7).
| № | Levels of comfort | The number of grids | Percentage | |
|---|---|---|---|---|
| Comfort | 81-100 | - | - | |
| Subcomfort | 61-80 | 191 | 63 | |
| Discomfort | 41-60 | 111 | 36 | |
| Subdiscomfort | 21-40 | 2 | 1 | |
| Extradiscomfort | 0-20 | - | - | |
| Total: | 304 | 100 | ||
Table 7: Location of climatic indicators in the grid index all situated by valley area.
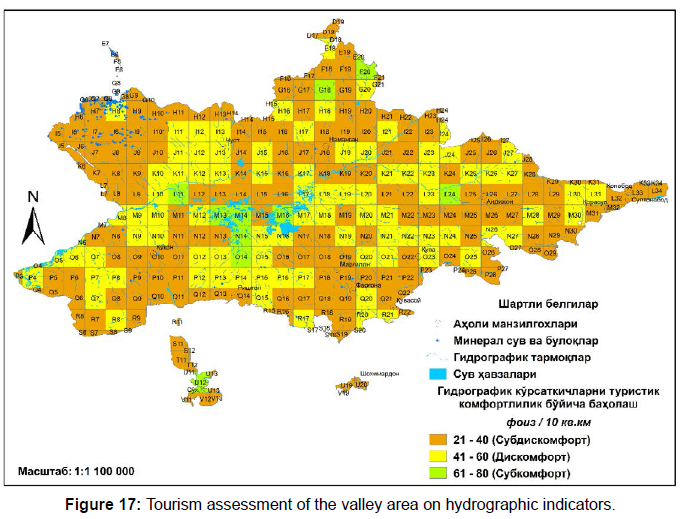
The group of hydrographic indicators includes values such as the number of hydrographic networks, the area of water bodies, the length of hydrographic networks, the number of mineral waters and springs, and the density along the lengt of hydrographic networks. The following outcomes were obtained by summarizing the results of a separate assessment of each of the indicators in this group [18-22] (Figure 17).
Summarizing the results of the assessment of hydrographic indicators shows that subdiscomfort areas occupy 1/2 of the valley area. It also consists of 1/3 of the discomfort areas. However, it should be noted that there are no comfort zones in the valley area (Table 8).
| № | Levels of comfort | The number of grid | Percentage | |
|---|---|---|---|---|
| Comfort | 81-100 | - | - | |
| Subcomfort | 61-80 | 10 | 3 | |
| Discomfort | 41-60 | 90 | 30 | |
| Subdiscomfort | 21-40 | 158 | 52 | |
| Ectradiscomfort | 0-20 | 46 | 15 | |
References
Indexed at, Google Scholar, Crossref Indexed at, Google Scholar, Crossref Indexed at, Google Scholar, Crossref Indexed at, Google Scholar, Crossref Indexed at, Google Scholar, Crossref Indexed at, Google Scholar, Crossref Indexed at, Google Scholar, Crossref Indexed at, Google Scholar, Crossref Indexed at, Google Scholar, Crossref Indexed at, Google Scholar, Crossref Indexed at, Google Scholar, Crossref Indexed at, Google Scholar, Crossref Indexed at, Google Scholar, Crossref Indexed at, Google Scholar, Crossref Indexed at, Google Scholar, Crossref Indexed at, Google Scholar, Crossref Indexed at, Google Scholar, Crossref Citation: Odiljon T (2022) Methodology for Assessing the Tourist Potential of the Nature of the Fergana Valley Using Gis Technologies and Experimental Methods. J Earth Sci Clim Change, 13: 640. DOI: 10.4172/2157-7617.1000640 Copyright: © 2022 Odiljon T. This is an open-access article distributed under the terms of the Creative Commons Attribution License, which permits unrestricted use, distribution, and reproduction in any medium, provided the original author and source are credited. Select your language of interest to view the total content in your interested language Share This ArticleRecommended JournalsOpen Access JournalsArticle ToolsArticle Usage
Peer Reviewed JournalsMake the best use of Scientific Research and information from our 700 + peer reviewed, Open Access Journals Journals by SubjectClinical & Medical JournalsInternational Conferences 2025-26
Conferences by CountryMedical & Clinical Conferences | ||||

