Metal Enrichment and Contamination in River and Estuary Sediments of Tamirabarani, South India
Received: 19-Sep-2018 / Accepted Date: 18-Oct-2018 / Published Date: 30-Oct-2018 DOI: 10.4172/2157-7617.1000497
Keywords: Tamirabarani; River and estuary; Sediments; Heavy metals; Enrichment factors; Contamination factor; Geo-accumulation index; Pollution Load Index
Introduction
In recent past, there have been increasing interests regarding heavy metal contaminations in the environments, apparently due to their toxicity and perceived persistency within the aquatic systems [1]. There are basically three reservoirs of metals in the aquatic environment: water, sediment and biota [2]. The analysis of river sediment is a useful method of studying heavy metals to assess environmental pollution [3,4]. Heavy metals accumulate in the sediments through complex physical and chemical adsorption mechanisms depending on the nature of the sediment matrix and the properties of the adsorbed compounds [5]. Atmospheric particles generated by the natural sources are found to be accumulated as atmospheric metal load. In isolated areas, the amount of metal load by natural processes is higher, while the other side it may be due to anthropogenic sources. Aeolian process carries the soil particles on global scale to the atmosphere and end up in rivers that transport metal containing particles to lakes and to the ocean. Volcanoes eruption discharged materials is also a prime source for certain amount of cadmium in the air. As well as the metals that are part of vegetation can be released and extend through forest fires. Heavy metal pollution of an aquatic ecosystem has become a potential global problem today and these heavy metals are among the most common environmental pollutants, as well as their occurrence in waters and sediments is originated from natural or anthropogenic sources. A trace amount of heavy metals is always present in fresh waters from terrigenous sources, such as weathering of rocks, which may be recycled through chemical and biological contaminates in sediments in these ecosystems [6-10]. Heavy metal contamination in sediments could affect the quality and bio-assimilation and bioaccumulation of metals in an aquatic ecosystem. Further, these metals are immobilised within the sediments and thus might be involved in absorption, co-precipitation and complex creation [9-13].
Materials and Methods
Study area
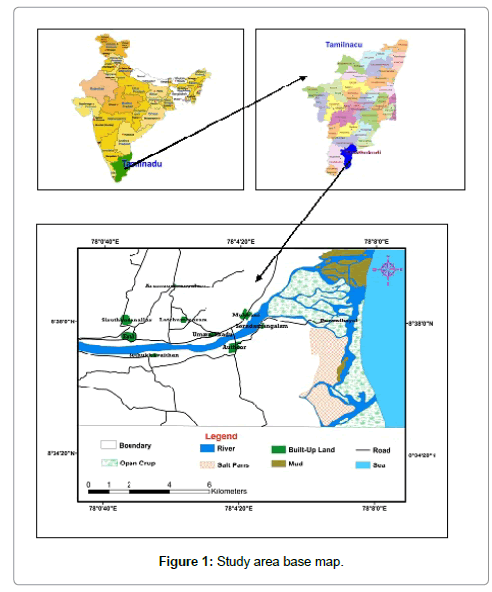
Tamirabarani River originates from western Ghat hills flows all along the East coast and drains at Bay of Bengal. The present estuarine region falls in the part of Thoothukudi districts, east coast of Tamil Nadu state, It lies in the SOI toposheet Nos. 58 L/2 and located in between 8°25’ N and 9°10’ N latitudes and 77°10’ E and 78° 15’ E longitudes, with an area of (169.226 Sq. km) (Figure 1). The study area is blessed with deltaic system with different active and inactive distributaries. The southwestern part is dominated by river and the northern part by the sea [14].
Sediments sampling and analysis
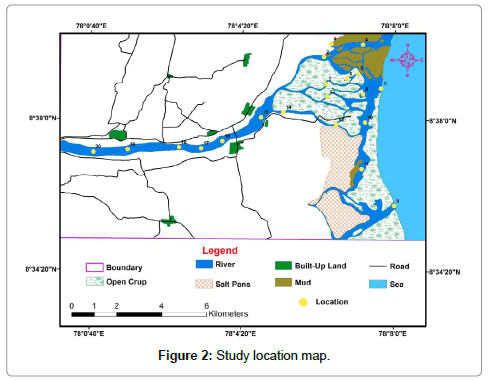
In the study area, twenty-four sediment samples were collected at the river mouth estuary and distributary channels for two seasons (summer and winter) (Figure 2). The sampling locations were identified and recorded using a hand-held GPS (Magellan); surface sediment’s samples collected and packed in thick polyethylene bags. In the laboratory, the collected samples were frozen at -4°C to avoid soil contamination. The freezing of the samples below -4°C, avoid the growth of microbes or bacteria, which can result in the variation of metal in sediments. These samples were then dried in a hot-air oven and after homogenized using pestle and mortar. Dry sieving is done in 2 mm mesh sieve and stored for further analysis [10,15,16]. The sediment’s samples were digested and extracted based on the procedure of Manasrah et al. [17] and subjected for the assessment of trace metals using AAS with specific flame and wavelength (Atomic Absorption Spectrometer, (Elico make) using a series of solution over the range 2–10 mg/l. The concentration of the metals was normalised and inferred for the following parameter.
Result And Discussion
Enrichment factor
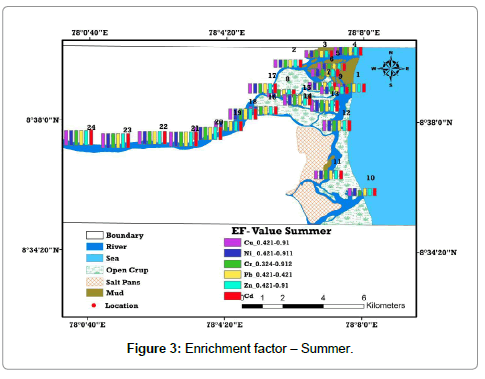
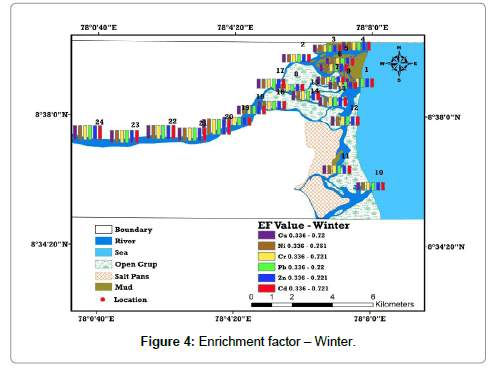
Enrichment factor (EF) is the proportional abundance of the chemical elements that helps to assess the degree of contamination. EF computed relative to the abundance of species in source material found in the Earth’s crust is considered as a better method for understanding the geochemical trends [8,9,18]. According to Harikuma et al., Sekabira et al., and Chandrasekaran et al. [8-10] has derived six categories as background concentration 1, depletion to minimal enrichment 1–2, moderate enrichment 2–5, significant enrichment 5–20, very high enrichment and 20–40 extremely high enrichment 40 (Table 1). It was found that the entire samples plunge below 1 and thus it is inferred that they represent the background concentration [19-21]. Moreover, the samples with higher Cd and Pb concentration are found in all locations of the study area comparatively higher than others due to the sea interface, which has high pH and salinity (Tables 1-3) and (Figures 3 and 4).
| Enrichment Factor | Status |
|---|---|
| <1 | No enrichment |
| 1-2 | Depletion to Minor enrichment |
| 2-5 | Moderate enrichment |
| 5-20 | Significant enrichment |
| 20-40 | Very high enrichment |
| >40 | Extremely high enrichment |
Table 1: Enrichment factor standard values.
| Location | Cu | Ni | Cr | Pb | Zn | Cd |
|---|---|---|---|---|---|---|
| 1 | 0.534 | 0.534 | 0.534 | 0.534 | 0.534 | 0.534 |
| 2 | 0.46 | 0.46 | 0.46 | 0.46 | 0.46 | 0.46 |
| 3 | 0.421 | 0.421 | 0.421 | 0.421 | 0.421 | 0.42 |
| 4 | 0.524 | 0.524 | 0.524 | 0.524 | 0.524 | 0.524 |
| 5 | 0.468 | 0.468 | 0.468 | 0.468 | 0.468 | 0.468 |
| 6 | 0.488 | 0.488 | 0.488 | 0.488 | 0.488 | 0.488 |
| 7 | 0.46 | 0.46 | 0.46 | 0.46 | 0.46 | 0.46 |
| 8 | 0.455 | 0.455 | 0.455 | 0.455 | 0.455 | 0.455 |
| 9 | 0.436 | 0.437 | 0.437 | 0.436 | 0.437 | 0.437 |
| 10 | 0.453 | 0.453 | 0.324 | 0.453 | 0.453 | 0.453 |
| 11 | 0.517 | 0.516 | 0.517 | 0.517 | 0.517 | 0.517 |
| 12 | 0.605 | 0.605 | 0.605 | 0.605 | 0.605 | 0.605 |
| 13 | 0.688 | 0.688 | 0.688 | 0.688 | 0.688 | 0.688 |
| 14 | 0.674 | 0.669 | 0.674 | 0.674 | 0.674 | 0.674 |
| 15 | 0.603 | 0.603 | 0.603 | 0.603 | 0.603 | 0.603 |
| 16 | 0.517 | 0.516 | 0.516 | 0.516 | 0.516 | 0.516 |
| 17 | 0.601 | 0.6 | 0.601 | 0.601 | 0.601 | 0.6 |
| 18 | 0.64 | 0.639 | 0.637 | 0.639 | 0.639 | 0.64 |
| 19 | 0.563 | 0.562 | 0.563 | 0.562 | 0.562 | 0.562 |
| 20 | 0.775 | 0.774 | 0.775 | 0.775 | 0.775 | 0.773 |
| 21 | 0.854 | 0.854 | 0.854 | 0.853 | 0.854 | 0.853 |
| 22 | 0.812 | 0.811 | 0.812 | 0.811 | 0.812 | 0.812 |
| 23 | 0.873 | 0.872 | 0.872 | 0.872 | 0.867 | 0.871 |
| 24 | 0.91 | 0.911 | 0.912 | 0.91 | 0.91 | 0.954 |
Table 2: Enrichment factor-Summer.
| Location | Cu | Ni | Cr | Pb | Zn | Cd |
|---|---|---|---|---|---|---|
| 1 | 0.432 | 0.432 | 0.432 | 0.432 | 0.433 | 0.433 |
| 2 | 0.388 | 0.388 | 0.388 | 0.388 | 0.388 | 0.388 |
| 3 | 0.36 | 0.36 | 0.36 | 0.36 | 0.36 | 0.36 |
| 4 | 0.403 | 0.403 | 0.403 | 0.403 | 0.403 | 0.402 |
| 5 | 0.378 | 0.378 | 0.378 | 0.378 | 0.378 | 0.378 |
| 6 | 0.362 | 0.369 | 0.369 | 0.369 | 0.369 | 0.369 |
| 7 | 0.38 | 0.38 | 0.38 | 0.38 | 0.38 | 0.38 |
| 8 | 0.371 | 0.371 | 0.371 | 0.371 | 0.371 | 0.371 |
| 9 | 0.336 | 0.336 | 0.336 | 0.336 | 0.336 | 0.336 |
| 10 | 0.369 | 0.369 | 0.369 | 0.369 | 0.369 | 0.369 |
| 11 | 0.396 | 0.396 | 0.396 | 0.396 | 0.396 | 0.396 |
| 12 | 0.431 | 0.431 | 0.431 | 0.431 | 0.431 | 0.431 |
| 13 | 0.443 | 0.443 | 0.443 | 0.443 | 0.444 | 0.443 |
| 14 | 0.413 | 0.413 | 0.413 | 0.413 | 0.413 | 0.411 |
| 15 | 0.428 | 0.428 | 0.428 | 0.428 | 0.428 | 0.428 |
| 16 | 0.402 | 0.402 | 0.402 | 0.402 | 0.402 | 0.403 |
| 17 | 0.429 | 0.429 | 0.429 | 0.429 | 0.429 | 0.428 |
| 18 | 0.409 | 0.409 | 0.409 | 0.409 | 0.409 | 0.409 |
| 19 | 0.388 | 0.388 | 0.388 | 0.387 | 0.388 | 0.388 |
| 20 | 0.72 | 0.751 | 0.721 | 0.72 | 0.721 | 0.721 |
| 21 | 0.609 | 0.609 | 0.609 | 0.609 | 0.609 | 0.61 |
| 22 | 0.663 | 0.663 | 0.663 | 0.663 | 0.663 | 0.663 |
| 23 | 0.59 | 0.59 | 0.59 | 0.59 | 0.597 | 0.589 |
| 24 | 0.694 | 0.694 | 0.694 | 0.694 | 0.694 | 0.694 |
Table 3: Enrichment factor-Winter.
Contamination factor (CF)
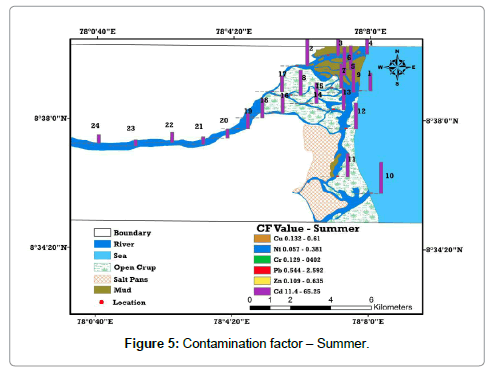
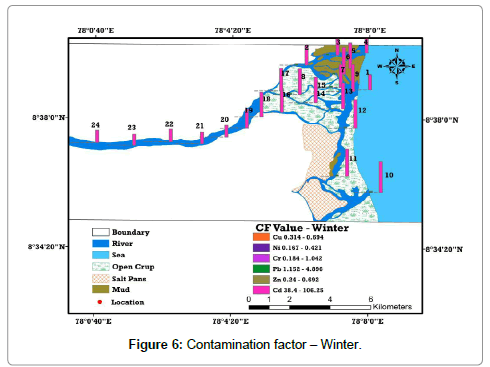
The levels of contamination in sediment by metals are frequently expressed in terms of a contamination factor (CF). If CF, CF >3 means moderate contamination; 3>CF >6 indicates considerable contamination and CF >6 specifies very high contamination. The complete analysis of this contamination factor value of the metals in the study area is compared with the background and toxicological reference values of sediments. It appears that all the metals are low to moderately contaminated, except Cd, which shows very high contamination in all locations than summer. Especially locations from 5 to 18 in downstream area has observed Cd contamination ranging from 78.35 to 106.25 and considerable absorption of Pb is found in downstream (Location 2 to 12) due to variation in salinity, which governs the formation of non-bio available Cd chloride complex, anthropogenic inputs and industrial wastage (Tables 4 and 5) and (Figures 5 and 6).
| Location | Cu | Ni | Cr | Pb | Zn | Cd |
|---|---|---|---|---|---|---|
| 1 | 0.43 | 0.184 | 0.198 | 1.308 | 0.291 | 32.15 |
| 2 | 0.61 | 0.189 | 0.288 | 1.939 | 0.468 | 48.3 |
| 3 | 0.539 | 0.24 | 0.268 | 2.296 | 0.495 | 43.25 |
| 4 | 0.599 | 0.381 | 0.294 | 1.466 | 0.552 | 47.15 |
| 5 | 0.548 | 0.282 | 0.272 | 1.42 | 0.577 | 42.6 |
| 6 | 0.523 | 0.261 | 0.315 | 1.488 | 0.596 | 51.05 |
| 7 | 0.487 | 0.286 | 0.289 | 1.664 | 0.497 | 43.35 |
| 8 | 0.603 | 0.221 | 0.355 | 1.744 | 0.551 | 45.75 |
| 9 | 0.592 | 0.189 | 0.294 | 1.176 | 0.574 | 52.6 |
| 10 | 0.5 | 0.301 | 0.402 | 1.712 | 0.635 | 56.25 |
| 11 | 0.487 | 0.218 | 0.384 | 2.592 | 0.566 | 42.35 |
| 12 | 0.579 | 0.167 | 0.273 | 1.936 | 0.412 | 46.75 |
| 13 | 0.531 | 0.258 | 0.381 | 2.18 | 0.426 | 38.95 |
| 14 | 0.365 | 0.237 | 0.397 | 1.144 | 0.467 | 32.05 |
| 15 | 0.332 | 0.185 | 0.348 | 1.112 | 0.588 | 37.8 |
| 16 | 0.307 | 0.179 | 0.389 | 1.008 | 0.401 | 34.15 |
| 17 | 0.322 | 0.162 | 0.397 | 1.128 | 0.354 | 29.1 |
| 18 | 0.341 | 0.208 | 0.387 | 1.008 | 0.289 | 33.7 |
| 19 | 0.298 | 0.17 | 0.277 | 1.056 | 0.264 | 28.95 |
| 20 | 0.132 | 0.097 | 0.146 | 0.672 | 0.127 | 15.9 |
| 21 | 0.154 | 0.089 | 0.132 | 0.632 | 0.132 | 13.55 |
| 22 | 0.176 | 0.103 | 0.129 | 0.544 | 0.126 | 18.65 |
| 23 | 0.159 | 0.074 | 0.147 | 0.618 | 0.133 | 11.4 |
| 24 | 0.166 | 0.057 | 0.134 | 0.694 | 0.109 | 15.6 |
Table 4: Contamination factor-Summer.
| Location | Cu | Ni | Cr | Pb | Zn | Cd |
|---|---|---|---|---|---|---|
| 1 | 0.469 | 0.25 | 0.418 | 1.74 | 0.397 | 52.15 |
| 2 | 0.68 | 0.264 | 0.864 | 4.896 | 0.532 | 68 |
| 3 | 0.594 | 0.298 | 1.042 | 4.193 | 0.552 | 71.25 |
| 4 | 0.69 | 0.421 | 0.97 | 4.192 | 0.596 | 61.65 |
| 5 | 0.651 | 0.375 | 0.866 | 4.432 | 0.662 | 87.6 |
| 6 | 0.614 | 0.357 | 0.545 | 4.296 | 0.69 | 93.05 |
| 7 | 0.556 | 0.366 | 0.589 | 4.192 | 0.568 | 78.35 |
| 8 | 0.694 | 0.328 | 0.542 | 4.112 | 0.623 | 87.25 |
| 9 | 0.687 | 0.309 | 0.612 | 4.368 | 0.581 | 92.6 |
| 10 | 0.596 | 0.408 | 1.026 | 4.896 | 0.692 | 106.25 |
| 11 | 0.578 | 0.327 | 0.964 | 4.384 | 0.623 | 92.35 |
| 12 | 0.663 | 0.295 | 0.897 | 4.096 | 0.54 | 97.25 |
| 13 | 0.613 | 0.272 | 0.405 | 2.536 | 0.549 | 88.95 |
| 14 | 0.493 | 0.304 | 0.642 | 2.107 | 0.567 | 83.55 |
| 15 | 0.441 | 0.29 | 0.383 | 1.832 | 0.667 | 87.8 |
| 16 | 0.428 | 0.33 | 0.416 | 1.785 | 0.552 | 81.7 |
| 17 | 0.413 | 0.322 | 0.446 | 1.64 | 0.498 | 76.6 |
| 18 | 0.469 | 0.277 | 0.404 | 1.808 | 0.446 | 83.7 |
| 19 | 0.407 | 0.296 | 0.347 | 1.856 | 0.35 | 63.95 |
| 20 | 0.314 | 0.19 | 0.194 | 1.152 | 0.263 | 40.9 |
| 21 | 0.336 | 0.183 | 0.189 | 1.354 | 0.276 | 39.55 |
| 22 | 0.321 | 0.197 | 0.189 | 1.266 | 0.24 | 43.15 |
| 23 | 0.349 | 0.167 | 0.194 | 1.418 | 0.261 | 38.4 |
| 24 | 0.331 | 0.177 | 0.184 | 1.31 | 0.248 | 42.1 |
Table 5: Contamination factor-Winter.
Geo-accumulation index (Igeo)
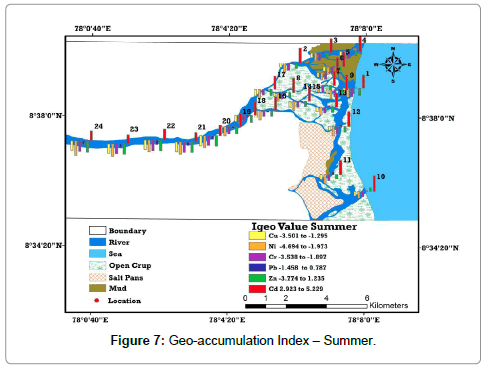
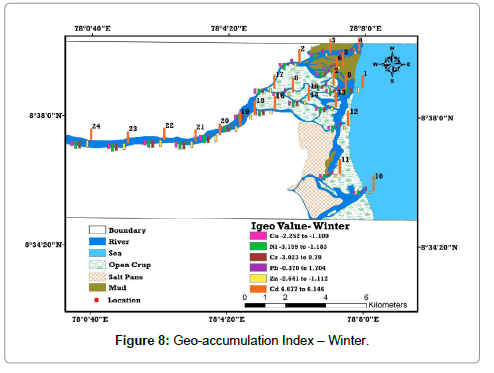
Enrichment of metal absorption was calculated by adopting geoaccumulation [22] methods, termed the geo-accumulation index (Igeo). This method provides the metal pollution in terms of seven (0 to 6) enrichment classes ranging from background concentration to very heavily polluted. (Table 6). Based on the classification system Igeo factors for all samples displays strongly to extremely polluted index for Cd and moderately polluted index for Pb. This higher value is chiefly owing to the salinity factor, comparatively higher than summer. The Igeo ‘‘uncontaminated’’ label is clearly appropriated for overall description of the heavy metals in sediments of estuary. The diagrammatic view of Igeo illustrate that higher values of Cd are distinguished in the estuarine part of the study area and it decreases in upstream area (Tables 7 and 8) and (Figures 7 and 8).
| Igeo value | Sediment Quality | Location | |||||
|---|---|---|---|---|---|---|---|
| Cu | Ni | Cr | Pb | Zn | Cd | ||
| < 0 | Unpolluted | - | - | - | - | - | - |
| 0-1 | From unpolluted to moderately polluted | - | - | - | - | - | - |
| 1-2 | Moderately polluted | - | - | - | 2 to 12 | - | - |
| 2-3 | From moderately polluted to strongly polluted | - | - | - | - | - | - |
| 3-4 | Strongly polluted | - | - | - | - | - | - |
| 4-5 | From strongly to extremely polluted | - | - | - | - | - | 20, 21, 22, 23, 24 |
| >5 | Extremely polluted | - | - | - | - | - | 1 to 19 |
Table 6: Geo-accumulation index standard values.
| Location | Cu | Ni | Cr | Pb | Zn | Cd |
|---|---|---|---|---|---|---|
| 1 | -1.797 | -3.026 | -2.916 | 0.196 | -2.362 | 4.421 |
| 2 | -1.295 | -2.986 | -2.375 | 0.368 | -1.677 | 5.006 |
| 3 | -1.471 | -2.641 | -2.481 | 0.611 | -1.598 | 4.847 |
| 4 | -1.322 | -1.973 | -2.348 | 0.029 | -1.441 | 4.973 |
| 5 | -1.451 | -2.408 | -2.461 | 0.076 | -1.375 | 4.827 |
| 6 | -1.518 | -2.518 | -2.249 | 0.009 | -1.328 | 5.086 |
| 7 | -1.621 | -2.388 | -2.375 | 0.149 | -1.591 | 4.856 |
| 8 | -1.312 | -2.76 | -2.076 | 0.215 | -1.441 | 4.93 |
| 9 | -1.338 | -2.98 | -2.348 | 0.348 | -1.455 | 5.129 |
| 10 | -1.581 | -2.315 | -1.897 | 0.189 | 1.235 | 5.229 |
| 11 | -1.621 | -2.78 | -1.963 | 0.787 | -1.401 | 4.817 |
| 12 | -1.368 | -3.159 | -2.455 | 0.365 | -1.863 | 4.96 |
| 13 | -1.495 | -2.534 | -1.973 | 0.538 | -1.813 | 4.697 |
| 14 | -2.036 | -2.657 | -1.916 | -0.388 | -1.681 | 4.415 |
| 15 | -2.172 | -3.016 | -2.106 | -0.428 | -1.348 | 4.654 |
| 16 | -2.285 | -3.063 | -1.946 | -0.571 | -1.9 | 4.508 |
| 17 | -2.215 | -3.205 | -1.913 | -0.408 | -2.079 | 4.275 |
| 18 | -2.132 | -2.85 | -1.95 | -0.571 | -2.372 | 4.488 |
| 19 | -2.328 | -3.139 | -2.435 | -0.504 | -2.504 | 4.269 |
| 20 | -3.501 | -3.943 | -3.358 | -1.156 | -3.554 | 3.405 |
| 21 | -3.279 | -4.059 | -3.504 | -1.245 | -3.495 | 3.172 |
| 22 | -3.086 | -3.853 | -3.538 | -1.458 | -3.571 | 3.634 |
| 23 | -3.229 | -4.328 | -3.348 | -1.275 | -3.495 | 2.923 |
| 24 | -3.172 | -4.694 | -3.475 | -1.109 | -3.774 | 3.378 |
Table 7: Geo-accumulation Index Summer.
| Location | Cu | Ni | Cr | Pb | Zn | Cd |
|---|---|---|---|---|---|---|
| 1 | -1.674 | -2.578 | -1.84 | 0.212 | -1.916 | 5.119 |
| 2 | -1.139 | -2.501 | -0.794 | 1.704 | -1.491 | 5.501 |
| 3 | -1.335 | -2.325 | -0.524 | 1.481 | -1.438 | 5.568 |
| 4 | -1.116 | -1.183 | -0.627 | 1.481 | -1.328 | 5.358 |
| 5 | -1.202 | -1.996 | 0.79 | 1.561 | -1.176 | 5.867 |
| 6 | -1.285 | -2.069 | -1.458 | 1.521 | -1.118 | 5.953 |
| 7 | -1.428 | -2.033 | -1.345 | 1.481 | -1.398 | 5.704 |
| 8 | -1.109 | -2.192 | -1.468 | 1.451 | -1.265 | 5.86 |
| 9 | -1.122 | -2.275 | -1.292 | 1.541 | -1.365 | 5.946 |
| 10 | -1.328 | -1.877 | -0.544 | 1.704 | -1.112 | 6.146 |
| 11 | -1.375 | -2.196 | -0.637 | 1.544 | -1.265 | 5.943 |
| 12 | -1.176 | -2.342 | -0.74 | 1.448 | -1.471 | 6.016 |
| 13 | -1.289 | -2.461 | -1.887 | 0.757 | -1.448 | 5.89 |
| 14 | -1.601 | -2.302 | -1.222 | 0.488 | -1.401 | 5.797 |
| 15 | -1.76 | -2.365 | -1.966 | 0.285 | -1.166 | 5.87 |
| 16 | -1.803 | -2.182 | -1.847 | 0.249 | -1.438 | 5.767 |
| 17 | -1.857 | -2.215 | -1.474 | 0.126 | -1.588 | 5.674 |
| 18 | -1.674 | -2.435 | -1.89 | 0.269 | -1.744 | 5.8 |
| 19 | -1.877 | -2.335 | -2.109 | 0.305 | -2.099 | 5.411 |
| 20 | -2.252 | -2.973 | -2.95 | -0.378 | -2.508 | 4.767 |
| 21 | -2.219 | -3.033 | -2.986 | -0.146 | -2.438 | 4.72 |
| 22 | -2.219 | -2.926 | -2.986 | -0.242 | -2.641 | 4.843 |
| 23 | -2.102 | -3.159 | -2.95 | -0.077 | -2.518 | 4.677 |
| 24 | -2.176 | -3.073 | -3.023 | -0.192 | -2.594 | 4.81 |
Table 8: Geo-accumulation index-Winter.
Pollution Load Index
Tomlinson et al. [23] has employed a simple method for Pollution Load Index (PLI) to assess the extent of pollution in metals of estuarine sediments. It is given as, if, PLI >1 as “polluted” and if < 1 as “no pollution”. In the study area, pollution load index values exhibited gives valuable information for the policy and decision makers on the pollution level of the area. The highest PLI values were observed in lower part of the river or estuary were water interchanges area of the river. The river with more water gives an idea about comparatively lower PLI values.
The PLI values for summer and winter for Pb are (1.240 and 2.566) and Cd (2,615 and 69.963) describes higher PLI in winter than summer. It is noted that Pb and Cd are the major pollutants contributing elevated PLI values in the study area (Table 9).
| Metals | Seasons | Standard value | Remarks | |
|---|---|---|---|---|
| Summer | Winter | |||
| Cu | 0.367 | 0.498 | >1 | Unpolluted |
| Ni | 0.179 | 0.282 | >1 | Unpolluted |
| Cr | 0.269 | 0.476 | >1 | Unpolluted |
| Pb | 1.240 | 2.566 | <1 | Polluted |
| Zn | 0.349 | 0.472 | >1 | Unpolluted |
| Cd | 2.615 | 69.963 | <1 | Polluted |
Table 9: Pollution load index.
Conclusion
It is estimated that EF of all samples in the study area go down below 1 and thus it is inferred that they represent the background concentration. Moreover, the samples with higher Cd and Pb concentration are found in all locations. This enrichment factors suggest minor to moderate enhancement of Cd and Pb is present in the sediments. Higher concentration of Cd and Pb are observed in winter season is due to high pH, salinity and anthropogenic activity in seaward and in downstream direction as a result of sea interface. The comprehensive analysis of the contamination factor for the average values of the metals in the study is compared with the background and toxicological reference values of sediments. It appears that all the metals are low to moderately contaminated, except Cd, which shows very high contamination. The element contribution and enrichment of metals compared with the toxicological levels shows that Tamirabarani River and estuary sediments are moderately polluted. The spatial distributions of contamination factor illustrate higher values for Cd is nearer the estuary region with varied salinity and tidal fluctuation, which is in agreement with the earlier interpretations. Based on the classification system proposed for Igeo factors, all samples have strongly to extremely polluted index for Cd and moderately polluted index for Pb. This upper value is mainly due to the salinity factor in summer. Spatial representation of Igeo shows that higher values of Cd are noted in estuarine part of the study area and decreases towards inland followed by Pb. Hence, it is inferred that the variation of this metal is mainly due to the variation in physico-chemical factors in the estuary. The highest PLI values were observed in lower part of the estuary, by outstanding massive mixing of sea and river water. The main streams with enormous water illustrate relatively lower PLI values. The PLI values for most of the sites confirm higher values in winter than in summer and Pb and Cd are the major pollutants contributing high PLI values. The results could be used as a baseline data for future prediction of anthropogenic effects, which can be utilized to assess and defined to establish a better management decision plan to reduce pollution.
References
- Tijani MN, Onodera S, Adeleye MA (2005) Environmental implications of adsorbed and total trace metals concentrations in bottom-sediments of an urban drainage network in a developing country. Materials and Geoenvironment 52: 127-130.
- Saha SB, Abhijit SB, Choudhury A (2001) Status of sediment with special reference to heavy metal pollution of a brackish water tidal ecosystem in northern Sundarbans of West Bengal. Tropical Ecol 42: 127-132
- Batley GE (1989) Trace metal speciation: Analytical methods and problems. CRC Press, Boca Raton, Florida, USA.
- Goorzadi A, Vahabzadeh G, Carbassi AR (2009) Assessment of heavy metals pollution in Tilehbon River sediments. Iranian J Sci 9: 1190-1193.
- Ankley GT, Lodge K, Call DJ, Balcer MD, Smith BJ (1992) Heavy metal  concentrations in surface sediments in a near shore environment, Jurujuba Sound, Southeast Brazil, Environ Pollut 109: 1-9.
- Muwanga A (1997) Environmental impacts of copper mining at Kilembe, Uganda: A geochemical investigation of heavy metal pollution of drainage waters, stream, sediments and soils in the Kilembe valley in relation to mine waste disposal. Ph.D., dissertation. Universitat Braunschweig, Germany.
- Zvinowanda CM, Okonkwo JO, Shabalala PN, Agyei NM (2009) A novel adsorbent for heavy metal remediation in aqueous environments. Int J Environ Sci Tech 6: 425-434.
- Harikuma PS, Nasir UP, Mujeebu-Rahman MP (2010) Distribution of heavy metals in the core sediments of a tropical wetland system. Int J Environ Sci Tech 6: 225-223.
- Sekabira K, Origa HO, Basamba TA, Mutumba G, Kakulidi E (2010) Assessment of heavy metal pollution in the urban stream sediments and its tributaries. Int J Sci Tec 7: 435-446.
- Chandrasekaran A, Mukesh MV, Chidambaram S, Singarasubramanian SR, Rajendran, et al. (2014) Assessment of heavy metal distribution pattern in the sediments of Tamirabarani river and estuary, east coast of Tamil Nadu, India. Jo Springer-Environ Earth Sci 73: 2441-2452.
- Okafor ECH, Opuene K (2007) Preliminary assessment of trace metals and polycyclic      aromatic hydrocarbons in the sediments. Int J Environ Sci Technol 4: 233-240.
- Mohiuddin KM, Zakir HM, Otomo K, Sharmin S, Shikazono N (2010) Geochemical distribution of trace metal pollutants in water and sediments of downstream of an urban river. Int J Environ Sci Technol 7: 17-28.
- Chandrasekaran A (2015) A study on environmental geochemistry of Tamirabarani River and Estuary. Annamalai University, Thoothukudi District, Tamil Nadu, India.
- Chandrasekaran A, Mukesh MV, Anantharaman P, Tamilselvi M, Muthukumarasamy P, et al. (2013) Sediment quality and seasonal variation of trace metal in Tamirabarani Estuary, East Coast of Tamilnadu. Int Res J Environ 2: 17-23.
- Praveena SM, Ahmed A, Radojevic M, Abdullah MH, Aris AZ (1997) Factor-cluster analysis and enrichment study of mangrove sediments-an example from Mengkabong, Sabah. Malays J Anal Sci 11: 421-430.
- Shetye SS, Sundhakar M, Mohan R, Tyagi S (2009) Implications of organic carbon, trace elemental and CaCO3 variation in a sediment core from the Arabian sea. Indian J Mar Sci 38: 432-438.
- Manasrah W, Hilat I, El-Hasan T (2010) Heavy metal and anionic contamination in the water and sediments in Al-Mujib Reservoir, central Jordan. Environ Earth Sci 60: 613-621.
- Simex SA, Helz GR (1981) Regional geochemistry of trace elements in Chesapeake Bay.   Environ Geol 3: 315-323.
- Charkravarty M, Patgiri AD (2009) Metal pollution assessment in sediments of the Dikrong river, NE India. J Hum Ecol 27: 63-67.
- Olubunmi FE, Olorunsola OE (2010) Evaluation of the status of heavy metal pollution of sediment of Agbabu bitumen deposits area, Nigeria. Eur J Sci Res 41: 373-382.
- Mmolawa KB, Likuku AS, Aboutloeloe GK (2011) Assessment of heavy metal pollution in soils along major roadside areas in Botswana. Afr J Environ Sci Technol 5: 186-196.
- Muller G (1969) Index of geoaccumulation in sediments of the Rhine River. Geo J 2: 108-118.
- Tomlinson DL, Wilson JG, Harris CR, Jeffney DW (1980) Problems in the assessment of heavy metal levels in estuaries and the formation of a pollution indexâ€. Helgol Wiss Meeresunters 33: 566-572.
Citation: Mukesh MV, Chandrasekaran A, Premkumar R, Keerthi BN (2018) Metal Enrichment and Contamination in River and Estuary Sediments of Tamirabarani, South India. J Earth Sci Clim Change 9: 497. DOI: 10.4172/2157-7617.1000497
Copyright: © 2018 Mukesh MV, et al. This is an open-access article distributed under the terms of the Creative Commons Attribution License, which permits unrestricted use, distribution, and reproduction in any medium, provided the original author and source are credited.
Select your language of interest to view the total content in your interested language
Share This Article
Recommended Journals
Open Access Journals
Article Tools
Article Usage
- Total views: 4900
- [From(publication date): 0-2018 - Nov 03, 2025]
- Breakdown by view type
- HTML page views: 3982
- PDF downloads: 918

