Meta-Analysis of EEG Findings on Pain Perception: Exploring Nociceptive and Neuropathic Pain response Patterns
Received: 01-May-2024 / Manuscript No. cmb-24-136296 / Editor assigned: 04-May-2024 / PreQC No. cmb-24-136296 / Reviewed: 18-May-2024 / QC No. cmb-24-136296 / Revised: 25-Jul-2024 / Manuscript No. cmb-24-136296 / Published Date: 31-Jul-2024
Abstract
This meta-analysis examines research articles examining nociceptive and neuropathic pain perception using electroencephalography (EEG). The purpose of this article is to compare the results of articles in accordance with the theory of the three-route model of pain perception. The results of the meta-analysis contain pooled observations from multiple studies that allow us to specify the characteristic changes observed in EEG rhythms in different brain regions during the sensation of pain. This meta-analysis contributes to defining the relationship between pain perception and EEG activity by identifying the roles of distinct brain regions in the processing of pain.
Introduction
Pain is a universal human experience and is one of the most common symptoms experienced by humans. It can be physical, emotional and psychological in nature and has a significant impact on people’s quality of life and well-being.
Understanding the mechanisms and processes involved in pain perception is essential for the development of effective treatments and management of pain. In recent years, research in the field of pain perception has gained new impetus for development. Thanks to advances in medical technology and neuroscience, scientists are able to study pain responses at the level of the brain and nervous system, allowing for a better understanding of how the brain perceives and processes pain signals and how these signals are transmitted throughout the body.
According to the nature of pain, a distinction is made between nociceptive and neuropathic pain [1].
Nociceptive pain refers to pain that arises from tissue damage and can manifest as either somatic or visceral pain. Somatic pain receptors are found in various structures such as the skin, subcutaneous tissue, fascia, connective tissues, periosteum, endosteum, and joint capsules. Stimulation of these receptors typically produces localized pain sensations, which can range from sharp to dull. However, burning pain is not commonly associated with involvement of the skin and subcutaneous tissue in the pathological process. On the other hand, visceral pain receptors are located in most internal organs and the surrounding connective tissue. When there is damage to the organ capsule or deep connective tissue elements, visceral pain may be more distinct and localized, often presenting as acute discomfort [2].
Neuropathic pain refers to a specific kind of pain that occurs due to abnormal activity of neurons in either the peripheral or central nervous system, which are responsible for responding to physical injury. This type of pain can be characterized by abnormal sensations, known as dysesthesia, or pain triggered by stimuli that would not typically cause pain, called allodynia. Neuropathic pain can manifest as a constant discomfort or occur in episodes, with the latter being described as sharp or resembling electric shocks [3].
Research on this process has been going on for some time, and there are currently several models that explain some aspects of the pain perception process:
- Gating model of pain. According to this model, pain signals are transmitted from damaged tissues through peripheral nerves to the spinal cord. In the spinal cord, pain signals pass through “gate cells” that act as a filter. Depending on various influences, the gate cells can either ”open”, allowing pain signals to reach the brain and cause the sensation of pain, or “close”, blocking the transmission of signals and reducing the sensation of pain [4].
- Model of the ascending pain system. This model suggests that pain signals are transmitted from damaged tissues through nerve fibers to the brain, passing through various structures such as the spinal cord and thalamus. The brain further processes the signals, resulting in the sensation of pain [5].
Various electrophysiology methods are used to study brain processes. One such method is electroencephalography (EEG), which provides information about activity on the surface of the cerebral cortex. The process of pain perception has also been studied in detail using fMRI, CT, PET but the most relevant method of research was the electroencephalography (EEG) method [6].
The purpose of this study is to compare the results of studies of pain perception processes using EEG recordings with the model of the ascending pain system (three-route model of pain perception).
This article is organized in three parts. In the first part (sections II-III), we describe the problems of using EEG as a research tool for pain brain activity and propose a hypothetical model of the relationship between brain regions during pain perception. In the second part (sections IV-V), we list the studies used to conduct the construction of the hypothesized model and describe the method of its construction. In the third and final part of the article (section VI) we describe the obtained model of pain perception and compare the results obtained on the basis of literature data [7].
Studies of EEG recordings
Studies of pain perception using EEG have been described in detail in systematic reviews. The authors of these reviews come to similar conclusions about the impossibility at the moment to identify brain regions responsible for pain activity using EEG, and as a consequence, the impossibility to use EEG recordings as biomarkers of pain activity [8].
The authors emphasize the inconsistencies of the results presented in the articles and provide recommendations for future research on this topic. They suggest developing detailed research protocols that would take into account various factors affecting EEG recordings (open/closed eyes, attention disorders during the experiment, etc.); applying machine learning algorithms for data processing; taking into account quantitative characteristics of pain stimulus sources; developing more universal methods of subjective assessment of perceived pain [9].
The authors of the reviews also propose to further consider the process of pain sensation not as a result of brain activity of one specific brain zone, but as a result of the work of the system of several brain zones [10].
Three-pathway model of pain perception
Pain is defined as an unpleasant sensory and emotional experience resulting from actual or potential tissue damage. Central pain processing is known to be carried out by a neural network involving several cortical and thalamic regions of the brain. In healthy control subjects, studies have shown that using brain imaging techniques such as functional magnetic resonance imaging (fMRI), neurons correlate with the applied exogenous nociceptive stimulus. This so-called ”pain matrix” includes the thalamus, anterior and posterior insular cortex (aIC and pIC), lateral and medial prefrontal cortex (lPFC and mPFC), anterior, middle and posterior cingulate cortex (ACC, MCC, PCC), primary and secondary somatosensory cortex (S1 and S2), orbitofrontal cortex (OFC), basal ganglia, premotor cortex, midbrain, cerebellum, and posterior parietal cortex (PPC) [11-14].
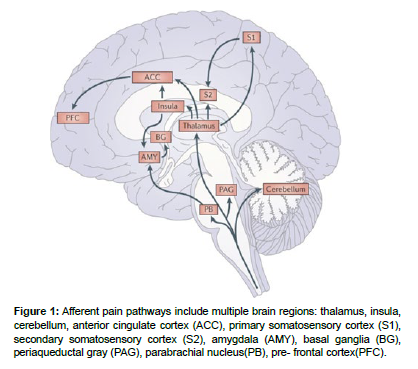
A similar scheme of the pain perception process was proposed in the articles based on electrophysiological, anatomical, and psychological studies. In this study, the authors examined in detail the influence of emotional and thought processes and attention processes on pain perception. Based on their research, they proposed possible routes by which these processes occur in the brain at the time of pain perception. In this model, the system of pain perception, in which processing is carried out along three different routes, includes the following brain regions: thalamus, insula, cerebellum, anterior cingulate cortex, primary somatosensory cortex, secondary somatosensory cortex, amygdala, basal ganglia, periaqueductal gray, parabrachial nucleus, prefrontal cortex [15].
According to this scheme, the zones of the anterior cingulate cortex and amygdala at the moment of pain sensation are responsible for processes related to motivation and emotions; S1 and S2 are responsible for decoding information about the place of pain sensation and its duration. Based on researches, the area of the prefrontal cortex is responsible for cognitive processes (attention, memory, decision making) [16] (Figure 1).
Figure 1: Afferent pain pathways include multiple brain regions: thalamus, insula, cerebellum, anterior cingulate cortex (ACC), primary somatosensory cortex (S1), secondary somatosensory cortex (S2), amygdala (AMY), basal ganglia (BG), periaqueductal gray (PAG), parabrachial nucleus(PB), pre- frontal cortex(PFC).
In a study of the insula, S1 and thalamus were activated when pain sensation was presented during imagined movement of the amputated arm.
Articles for analysis
Criteria for selection of articles
For this analysis, articles were searched using keywords and combinations of ”neuropathic pain, nociceptive pain, EEG, thalamus, thalamic activity, amygdala, somatosensory cortex” in PubMed, Scopus, and Google Scholar databases and article libraries. The articles then specified the following criteria for analysis:
- Articles that investigated nociceptive stimulation of healthy patients should have described in detail the protocols for conducting experiments and algorithms for processing the results. This makes it possible to ensure the reliability and accuracy of the obtained data;
- The articles should have explicitly stated changes in electroencephalogram (EEG) rhythms. The EEG is a useful tool for studying the electrical activity of the brain and can be used to assess changes associated with nociceptive or neuropathic pain;
- The articles should also have specified the topological distributions of EEG activity. Topographic analysis allows us to determine which areas of the brain are activated or deactivated in association with nociceptive or neuropathic pain. This helps to better understand which brain regions are associated with pain perception.
Using these criteria, the most relevant research literature was selected for this analysis. This provided a robust and informative set of articles for the study of nociseptive pain and its relationship to changes in EEG rhythms and topological distribution of brain activity [17-20].
Articles investigating EEG recordings with nociceptive stimulation
This group included articles that investigated brain activity induced by stimulated nociseptive pain in healthy subjects. Stimulations were carried out by different methods, which included the following methods:
- Stimulation of thermal pain induced by contact-thermal thermodrome
- Stimulation of hypothermia of hands in a bucket of ice water
- Electrical stimulation
- Intramuscular injection of hypertonic saline solution
- Topical application of capsaicin cream
- Stimulation of pain from pressure tourniquet cuffs
In these studies, pain was stimulated in the hands. The results of these studies include descriptions of the results of EEG recordings (localization of rhythm changes, nature of rhythm changes) during these stimulations, images of topographic distributions of EEG rhythm power changes [21-27].
Articles on the study of EEG recordings with neuropathic pain
This group included articles investigating neuropathic pain in patients with various neurologic diseases (multiple sclerosis, aging-induced thalamic disorders) using EEG. Studies have observed the following types of neuropathic pain:
- Central neuropathic- pain these articles dealt with neuropathic pain caused by central nervous system disorders (multiple sclerosis) and spinal cord injuries;
- Peripheral pain- these articles considered patients with chronic ortofacial neuropathic pain and postherpetic neuralgia;
- Mixed neuropathic pain [28-30].
Method of analysis
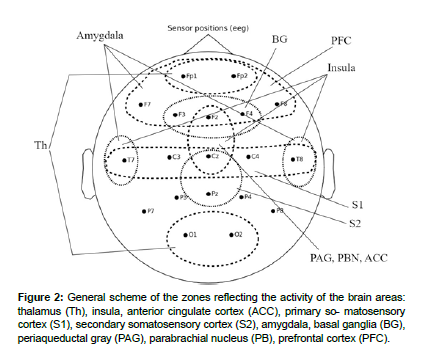
For analysis the brain activity recorded by the EEG, there were selected zones of scalp surface that corresponded to the brain zones proposed in the theory of ascending pain.
Primary somatosensory cortex: The primary somatosensory cortex (S1) is a well-defined area of the brain that is involved in processing somatosensory information. Electrical activity generated in S1 can be detected on EEG recordings in the central scalp areas (C3 and C4) [31].
Prefrontal cortex: The prefrontal cortex is an area of the brain that plays a crucial role in cognitive decision-making and working memory. Electrodes associated with the prefrontal cortex on EEG recordings include the frontal area electrodes (Fp1, Fp2, F3, F4, F7, F8, and AFz) [32].
The internal structures of the brain: Since a number of the brain regions considered in this model paper are located deep within the brain and cannot be explicitly recorded by EEG, brain surface areas have been identified by which the activity of deep regions can be indirectly ascertained [33].
Thalamus: Activity caused by thalamocortical interactions at the brain surface can be captured by changes in alpha and delta rhythm across the brain surface. Anterior electrodes Fp1 and Fp2 showing delta activity and occipital electrodes O1 and O2 showing alpha activity indirectly indicate thalamic activity [34].
Insular gyrus: Due to the special position of the islet gyrus relative to the brain surface, it is difficult to record activity in this area using EEG electrodes. Indirectly, the activity of this area can be identified by changes in electrical activity at the frontal (Fz, FCz), central (Cz) and temporal electrodes (T3, T4) [35].
Amygdala: In studies of processes associated with the amygdala using EEG, changes have been observed at frontal (Fp1, Fp2, F3, F4, F7 and F8) and temporal electrode sites (T7 and T8), making these areas of the cerebral surface possible indicators of amygdala activity [36].
Secondary somatosensory cortex: Due to the location of S2 and its relationship with S1 on EEG recordings, S2 activity is usually observed in the parietal regions of the skull. The electrodes reflecting these activities are electrodes Pz and CPz. Also, activity in the areas of electrodes Cp3 and Cp4 is also associated with activity of the secondary sensorimotor cortex [37].
Basal ganglia: Brain surface activity evoked by the basal ganglia is expressed in the activity of fronto-central (Fz, FCz) and fronto-right (F4) electrodes. These cortical areas are functionally connected to the basal ganglia and may show altered activity in certain motor disorders or conditions affecting the basal ganglia [38].
Periaqueductal gray, parabrachial nucleus, anterior cingulate cortex: In activity studies, the periaqueductal gray, Parabrachial nucleus and anterior cingulate cortex are often examined using the medial frontal (Fz) and central areas (Cz, Fcz) [39].
Cerebellum: This section of the brain is located deep in the back of the brain, making detection of its activity using electrodes on the surface of the head quite problematic due to the limited spatial resolution of the EEG [40].
The general scheme of the zones reflecting the activity of the brain areas considered in the article is shown in (Figure 2).
Figure 2: General scheme of the zones reflecting the activity of the brain areas: thalamus (Th), insula, anterior cingulate cortex (ACC), primary so- matosensory cortex (S1), secondary somatosensory cortex (S2), amygdala, basal ganglia (BG), periaqueductal gray (PAG), parabrachial nucleus (PB), prefrontal cortex (PFC).
Results
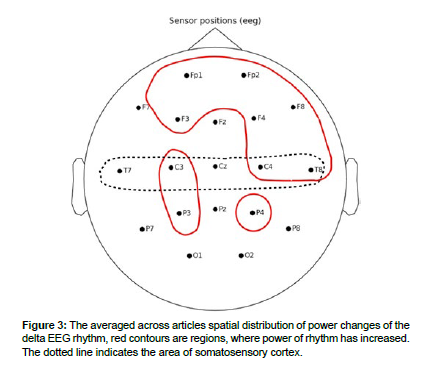
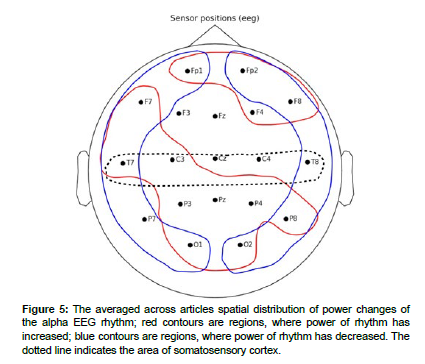
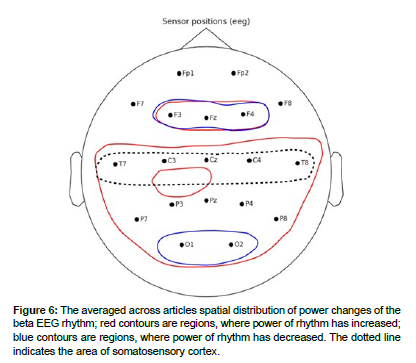
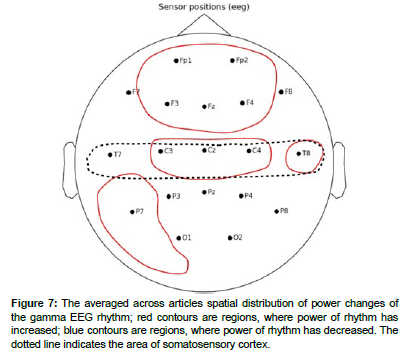
The EEG rhythm power changes described in the articles were sorted out by brain areas where these changes were observed. The general results of analysis are shown in Table 1. The averaged across articles spatial distributions are schematized in Figures 3 - 7.
Delta rhythm
In articles during painful stimulations, an increase in the power of delta rhythm was recorded. The distribution of delta rhythm changes is presented in (Table 1 and Figure 3).
| Lobe | Delta | Theta | Alpha | Beta | Gamma |
|---|---|---|---|---|---|
| P.F.C | N.A. | inc. | inc. | inc. | inc. |
| F.C. | inc. | inc./dec. | inc./dec. | inc. | inc. |
| P.C. | inc. | N.A. | inc./dec. | inc. | dec. |
| T.C. | inc. | inc./dec. | dec. | inc. | inc. |
| O.C. | inc. | N.A. | inc./dec. | N.A. | N.A. |
| P.F.C: Prefrontal cortex, FC: Frontal cortex, P.C: Parietal cortex, T.C: Temporal cortex, O.C: occipital cortex; inc: increased, dec: decreased | |||||
Table 1: General results of article analysis:
In the prefrontal lobe of the brain, an increase in delta rhythm was observed in the articles. Increases in delta rhythms in this area were also recorded in the article.
Increases in delta rhythm power in the frontal lobe were observed during the experiments in the articles. Increases in delta rhythm power were also observed in frontal lobe areas contralateral to the stimulated hemisphere in the article.
The temporal lobes showed an increase in delta rhythm power in the right hemisphere.
No changes in delta rhythm were observed in the parietal and occipital lobes [41-45].
Theta rhythm
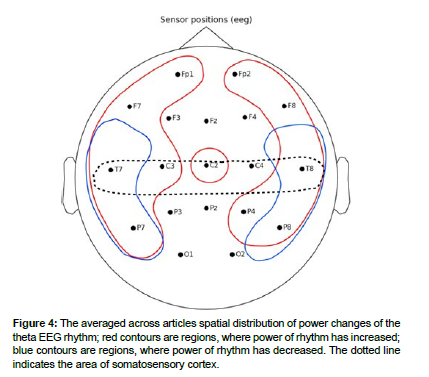
Changes in the theta rhythm are of mixed character. In frontal, central, temporal and occipital regions, an increase in theta-rhythm power was recorded. At the same time, mixed results were observed in the same temporoparietal regions. The spatial distribution of theta-rhythm changes is presented in (Figure 4).
In the prefrontal lobe, an increase in the theta rhythm was observed as described in. A simultaneous increase in theta rhythm power was observed in the medial prefrontal cortex and dorsolateral prefrontal cortex regions in the article [46].
In the frontal cortex, increases in theta power were observed in the bilateral insular cortex and in the contralateral precuneus and posterior cingulate cortex. Increases in theta power were also observed in patients with thalamic nuclei dysfunction in the article, and this article also described gradual decreases in theta power after nucleus surgery [47].
In the temporal lobes, there were significant decreases in the power of the theta rhythm in the left temporal region at the T7 electrode, with a simultaneous increase in the power in the right temporal region at the T8 electrode. In patients with multiple sclerosis, there was an increase in theta rhythm power in the temporal lobes of the right hemisphere. Also, an increase in theta rhythm power during pain stimulation was observed at temporal electrodes in the right hemisphere. Decreases in the theta rhythm were observed in the article. Decreases in theta rhythm in the parietal lobe were described in the article [48,49].
Patients before surgery on the thalamic nuclei showed increased power of the theta rhythm in the left hemisphere, and as a consequence, a decrease was observed in the article after surgery.
No changes in the theta rhythm were observed in the occipital lobe.
Alpha rhythm
The spatial distribution of alpha-rhythm changes is presented in (Figure 5).
In article, an increase in alpha rhythm power was observed in regions of the medial prefrontal cortex and dorsolateral prefrontal cortex.
Increases in alpha rhythm power were observed in the frontal region and correlated with changes in pain stimulus intensity and pain severity. At the same time, decreases in alpha-1 rhythm power in the frontal brain region were observed in the frontal brain region in the articles.
Decreases in alpha rhythm power were observed at temporal electrodes of both hemispheres. Decreased alpha-1 activity in temporal brain regions [50].
In the parietal lobe, a decrease in alpha power was observed in most articles. Also, a decrease in power was observed in areas contralateral (P3-P4) to the stimulated arm. Despite this, an increase in alpha rhythm in both parietal regions was described in the paper. In- creased alpha rhythm power in the occipital and parietal regions was recorded in the.
In the occipital lobe area, both decreases in alpha rhythm in the articles and increases in alpha-1 power in the occipital area were observed in the article [51,52].
Beta rhythm
In most of the article, an increase in beta rhythm power was recorded during the sensation of pain. The spatial distribution of theta-rhythm changes is presented in (Figure 6).
In article, simultaneous increases in beta rhythm power were observed in regions of medial prefrontal cortex and dorsolateral prefrontal cortex.
In the frontal lobe, increases in beta rhythm power were observed in the frontal lobe during the experiments in the articles and were asymmetric in nature [53].
An increase in beta rhythm power was recorded in the temporal lobes during the experiments in articles. Increases in beta rhythm power during nociceptive pain studies were observed in contralateral brain regions relative to the stimulated arm (T5, T9). Increased power of beta-1 and beta-2 rhythms was observed in patients with multiple sclerosis and with neuropathic pain in the temporal lobes of both hemispheres.
In the articles in bilateral posterior parietal lobe regions, an increase in beta-1 rhythm power was described. An increase in beta-2 rhythm in the right posterior parietal region was described in the article. A decrease in beta rhythm was observed in the article.
In the occipital regions of both hemispheres, an increase in beta rhythm power was recorded in [54]
Gamma rhythm
The articles described the increase in gamma rhythm power. The distributions of gamma rhythm changes are presented in (Figure 7).
Increases in gamma rhythm power were recorded in the prefrontal area during.
An increase in gamma rhythm power in frontal central and central frontal lobe regions during painful stimuli was observed in the articles. Also during painful stimuli, a significant increase in gamma rhythm power was observed in the contralateral to handedness brain region in frontal brain areas (FT7), while a decrease in gamma rhythm power was observed in the ipsilateral region (FT8). Increases in gamma rhythm power in temporal lobes were observed in.
In the parietal zones, an increase in the magnitude of the gamma rhythm was observed in the article.
No changes in gamma rhythm were observed in the occipital and temporal lobes [55].
Discussion
The studies presented in this analysis demonstrate that during the process of pain perception, activity on the surface of the brain changes throughout the brain, supporting the hypothesis that several connected sections of the brain, rather than a specific brain region, are responsible for pain perception in the brain.
Characteristic changes in EEG rhythms can be distinguished for each zone:
- In the prefrontal cortex, increases in the power of delta, theta, and gamma rhythms were observed. The alpha rhythm in this area showed mixed power Beta rhythm almost did not change;
- The primary somatosensory cortex showed an increase in beta and gamma rhythm Theta and alpha rhythms showed mixed results. The delta rhythm was virtually unchanged in this area. Also in this area the rhythms changed contra laterally to the stimulated body parts;
- Changes in delta rhythm in areas Fp1 and Fp2 and changes in alpha rhythm in occipital cortex indicate activity of the thalamus in pain perception processes;
- The following changes were observed in the areas of frontal and temporal electrodes indirectly indicating the activity of the insular gyrus. In the temporal lobes mixed changes of theta and alpha rhythm power were observed. Only in the right temporal lobe there were increases in delta and gamma Beta rhythm increased in all areas responsible for the insular gyrus;
- In frontal and temporal regions responsible for the activity of the amygdala, there was an increase in the power of delta, theta, and gamma The alpha rhythm both increased and decreased in these areas. Beta rhythm showed mixed changes only in frontal electrodes(F3, Fz, F4);
- In the area reflecting the activity of periaqueductal gray, parabrachial nucleus and anterior cingulate cortex, delta and alpha rhythms did not change, theta rhythm increased at the central electrode(Cz), beta and gamma rhythms increased in the whole area;
- In the secondary somatosensory cortex region, delta and gamma rhythms did not change, theta rhythm increased only in the right region, which could be due to a contralateral sensory response, and alpha and beta rhythms increased;
- In the area reflecting basal ganglia activity, there was an increase in delta rhythm only around electrode F4, theta and alpha rhythms did not change, beta rhythm showed mixed results, gamma rhythm increased over the whole area.
Increased activity in the prefrontal cortex correlated with the processes of higher nervous activity during the experiments - attention, learning, planning of executive functions, which determines the role of this section of the brain in the processing of pain processes. In the parietal lobe of the brain in the area of somatosensory cortex there were clearly recorded synchronous with changes in pain stimuli decreases in alpha rhythm power, which indicates the role of this section of the brain in pain perception - spatial perception of pain in the body [56].
Despite research, the use of EEG to record brain activity associated with pain is complicated by spatial resolution and the complex structure of the brain - many areas responsible for pain perception are located under the outer cortex, which allows only indirectly recording their activity. As a result, in order to obtain more detailed information for studying this activity, it is necessary to use additional non-invasive methods of brain research together with EEG: fMRI, MEG.
One possible solution to increase the accuracy of pain activity studies may be the application of machine learning algorithms to the study of EEG recordings. .
An important aspect in the issue of research on brain activity of pain sensations is the aspect of interconnection of different brain regions and the influence of their interconnections on the observed activity - coherence of brain sections. Such a study was cited in the article, which analyzed the coherence of changes in the rhythms of different parts of the brain and their influence on neighboring areas. The use of machine learning algorithms to investigate this aspect of the pain perception process may increase the accuracy of the research [57].
Acknowledgement
None
Conflict of Interest
None
References
- Brodersen KH, Wiech K, Lomakina EI, Lin CS, Buhmann JM, et al. (2012) Decoding the perception of pain from fMRI using multivariate pattern analysis. Neuroimage 63: 1162-1170.
- Longe SE, Wise R, Bantick S, Lloyd D, Johansen-Berg H, et al. (2021) Counter-stimulatory effects on pain perception and pro- cessing is significantly altered by attention: an fMRI study. Neuroreport 12: 21-25.
- Damascelli M, Woodward TS, Sanford N, Zahid HB, Lim R, et al. (2022) Multiple Functional Brain Networks Related to Pain Perception Revealed by fMRI. Neuroinformatics 20: 155-172.
- Hugdahl K, Rosen G, Ersland L, Lundervold A, Smievoll AI, Barndon R, et al. (2001) Common pathways in mental imagery and pain perception: An fMRI study of a subject with an amputated arm. Scand J Psychol 42: 269-275.
- Raff GL, Chinnaiyan KM, Cury RC, Garcia MT, Hecht HS, et al. (2014) SCCT guidelines on the use of coronary computed tomographic angiography for patients presenting with acute chest pain to the emergency department: A Report of the Society of Cardiovascular Computed Tomography Guidelines Committee. J Cardiovasc Comput Tomogr 8: 254-271.
- Newberg AB, LaRiccia PJ, Lee BY, Farrar JT, Lee L, Alavi A, et al. (2005) Cerebral blood flow effects of pain and acupuncture: a preliminary single-photon emission computed tomography imaging study. J Neroimaging 15: 43-49.
- Kanpolat Y, Ugur HC, Ayten M, Elhan AH (2009) Computed tomography-guided percutaneous cordotomy for intractable pain in malignancy. Neurosurgery 64: 187-93.
- Su IW, Wu FW, Liang KC, Cheng KY, Hsieh ST, et al. (2016) Pain Perception Can Be Modulated by Mindfulness Training: A Resting-State fMRI Study. Front Hum Neurosci 10: 570.
- Xu X, Fukuyama H, Yazawa S, Mima T, Hanakawa T, et al. (1997) Functional localization of pain perception in the human brain studied by PET. Neuroreport 8: 555-559.
- Boly M, Faymonville ME, Schnakers C, Peigneux P, Lambermont B, et al. (2008) Perception of pain in the minimally conscious state with PET activation: an observational study. Lancet Neurol 7: 1013-1020.
- Muller C, Klega A, Buchholz HG, Rolke R, Magerl W, et al. (2010) Basal opioid receptor binding is associated with differences in sensory perception in healthy human subjects: a [18F]diprenorphine PET study. Neuroimage. 49: 731-737.
- Zis P, Liampas A, Artemiadis A (2022) EEG recordings as biomarkers of pain perception: where do we stand and where to go? Pain Ther 11: 369-380.
- Mussigmann T, Bardel B, Lefaucheur JP (2022) Resting-state electroencephalography (EEG) biomarkers of chronic neuropathic pain. A systematic review. Neuroimage 1: 369-380.
- Melzack R, Casey KL (1968) Sensory, motivational and central control determinants of pain: a new conceptual model. Pain 28: 423-443.
- Apkarian AV, Bushnell MC, Treede RD, Zubieta JK (2005) Human brain mechanisms of pain perception and regulation in health and disease. Eur J Pain 9: 463-463.
- Chen ACN, Feng W, Zhao H, Yin Y, Wang P, et al. (2008) EEG default mode network in the human brain: Spectral regional field powers. Neoroimage 41: 561-574.
- Dube AA, Duquette M, Roy M, Lepore F, Duncan G, et al. (2008) Brain activity associated with the electrodermal reactivity to acute heat pain. Neuroimage 45: 169-180.
- Moisset X, Bouhassira D (2007) Brain imaging of neuropathic pain. Neuroimage 37.
- Peyron R, Laurent B, Garcıa-Larrea L (2000) Functional imaging of brain responses to pain. A review and meta-analysis. Neurophysiol Clin30: 263-288.
- Bushnell MC, Ceko M, Low LA (2013) Cognitive and emotional control of pain and its disruption in chronic pain. Nat Rev Neurosci 14: 502-511.
- Duque L, Fricchione G (2019) Fibromyalgia and its New Lessons for Neuropsychiatry. Med Sci Monit Basic Res 25: 169-178.
- Roe AW, Chen LM, Friedman R (2020) Intrinsic Signal Imaging of Somatosensory Function in Nonhuman Primates. Front Neurosci 20: 288-301.
- Rausell E, Jones EG (1991) Histochemical and immunocytochemical compartments of the thalamic VPM nucleus in monkeys and their relation- ship to the representational map. J Neurosci 11: 210-225.
Google Scholar, Crossref, Indexed at
Google Scholar, Crossref, Indexed at
Google Scholar, Crossref, Indexed at
Google Scholar, Crossref, Indexed at
Google Scholar, Crossref, Indexed at
Google Scholar, Crossref, Indexed at
Google Scholar, Crossref, Indexed at
Google Scholar, Crossref, Indexed at
Google Scholar, Crossref, Indexed at
Google Scholar, Crossref, Indexed at
Google Scholar, Crossref, Indexed at
Google Scholar, Crossref, Indexed at
Google Scholar, Crossref, Indexed at
Google Scholar, Crossref, Indexed at
Google Scholar, Crossref, Indexed at
Google Scholar, Crossref, Indexed at
Google Scholar, Crossref, Indexed at
Google Scholar, Crossref, Indexed at
Google Scholar, Crossref, Indexed at
Google Scholar, Crossref, Indexed at
Google Scholar, Crossref, Indexed at
Google Scholar, Crossref, Indexed at
Google Scholar,
Citation:
Lipnitskii M (2024) Meta-Analysis of EEG Findings on Pain Perception:Exploring Nociceptive and Neuropathic Pain response Patterns. Cell Mol Biol, 70:322. Copyright: © 2024 Lipnitskii M. This is an open-access article distributed underthe terms of the Creative Commons Attribution License, which permits unrestricteduse, distribution, and reproduction in any medium, provided the original author andsource are credited.
Select your language of interest to view the total content in your interested language
Share This Article
Recommended Journals
Open Access Journals
Article Usage
- Total views: 1060
- [From(publication date): 0-2024 - Dec 05, 2025]
- Breakdown by view type
- HTML page views: 781
- PDF downloads: 279

