Mapping and Assessing Impervious Surface Areas and Urban Heat Island in Osogbo, Nigeria
Received: 26-Sep-2017 / Accepted Date: 25-Nov-2017 / Published Date: 30-Nov-2017 DOI: 10.4172/2157-7617.1000424
Abstract
This paper assessed the percent impervious surface as indicators of surface urban heat island effects in a tropical rapidly urbanizing environment by investigating the change that occurred over 29 years period starting from 1986-2015. Landsat Thematic Mapper (TM) and Operational Land Imager (OLI) data were used to estimate the land surface temperature (LST) for two different periods in the study area. A map of percent impervious surface was also generated for the same period using linear spectral mixture analysis. The results showed that the change in impervious surface value ranged from -9% to 51% between 1984 and 2006, while, the minimum values of LST increased by 2.6°C whereas the maximum LST values exhibited a decrease by 8.5°C; the mean LST values increased by 4.6°C within the same period. The results indicate that increase in imperviousness results in higher temperature. Over the years, the gradual transition of land use from suburban to urban land in peri-urban districts around the highly urbanized hotspots resulted in an increase of 51% in the imperviousness and 29% in temperature. This result suggests that uncontrolled rapid population increase resulting in expansion of impervious surfaces can lead to significant increase in urban heat island formation in urban and peri-urban districts.
Keywords: Impervious surface area; Land surface temperature; Spectral mixture analysis; Urbanization; Urban heat island
Introduction
The world is increasingly becoming urbanized and the rate at which city populations grow and countries urbanized is indicative of the pace of social and economic change [1]. Before now, majority of the world population has lived primarily in rural areas, by 2030; roughly 60% of the world population is expected to reside in urban centers [2]. In comparison, the world’s rural population is expected to decline thus nearly the entire future population growth is expected to be in towns and cities [2].
Impervious surfaces represent those materials that do not absorb water or moisture, and most urban infrastructures, such as rooftops, streets, highways, parking lots, and sidewalks, are impervious. These materials effectively seal surfaces, repel water and prevent precipitation and melt water from infiltrating soils. According to Barnes et al. impervious surfaces are nearly 100 percent hydrologically active, and high percentages of such surfaces occur within urbanized areas containing commercial, industrial, transportation, and medium to high density residential land uses.
The impervious (built-up) area is generally considered as a parameter for quantifying the urban sprawl (Torrens and Alberti, 2000; Barnes et al., 2002 and Epstein et al., 2002) [3]. Urban sprawl has been quantified by considering the impervious area as the key feature of urban sprawl, which can be obtained either from physical survey or through remotely acquired data [4,5].
Because of their built environment, cities create their own microclimate, which generally enhances the effects of global climate change [6]. There is growing appreciation that the populations, infrastructure and ecology of cities are at risk from the impacts of climate change.
The impacts of different land use for example in urban areas, can also lead to an increase in temperature at the city center compared to the surrounding country side, known as the UHI effect [7,8]. Thus, the average temperatures of cities and towns become 2 – 6 degrees Celsius more than that of the surrounding countryside [9]. Different factors contribute to the UHI such as roofs covering material, urban structure, existence of vegetation, street width, directions, etc. The UHI significantly affect the human health, living conditions, increase energy consumption and atmospheric pollution [10]. Numerous studies have focused on the impact of the urban heat island on urban environment [11-13]. Most of the known studies of the urban climatology of tropical cities focus mainly on the diurnal analysis based on data collected over a short period of time. Related examples abound in the investigation carried out by Nakamura in Nairobi, Kenya, where the urban minimum temperature was observed to be greater than that at the International Airport by 1.3 K. Oguntoyinbo also observed that the heat island in Ibadan was between 5.0 K and 7.5 K, in the month of March. Adebayo reported that the mean heat island, reflected by the night-time minimum temperature, is about 1.0 K during the dry season and 0.5 K during the rainy season.
Remote sensing data supply a practicable approach for the investigation of both phenomenon of land use change and LST [14,15] on wide spatial and temporal scales. Remote sensing techniques have been used for monitoring the spatio-temporal and dynamic changes in land use/land cover at regular intervals, using optical and near infrared bands of multi-temporal remote sensing satellite data such as Landsat TM images. The thermal band in Landsat satellite series i.e., (MSS, TM and ETM+) have also been proven to have a crucial role in estimating surface temperature. Different algorithms developed by different authors have been used to extract land use/land cover change [16] and land surface temperature (LST) from remote sensing data for several decades. Geographic Information System provides the platform on which data on such images are stored, processed and analyzed for decision making [17]. Thermal infrared remotely sensed data in the bandwidth of 10.4-12.5 μm, acquired over urban areas during the day and at night available from Landsat-7 Thematic Mapper and Enhanced Thematic Mapper (TM and ETM+), which has 60 m resolution in thermal region have been used to monitor the heat island effect associated with urban areas. It was in view of the remarkable rate of urbanization in Osogbo and surrounding districts within the last few decades and the need to carry out more studies on the urban climate of tropical cities that this study was conceived. The effect of urbanization using impervious surface area as indicator on the urban heat island is therefore being examined in the study area.
Methodology
Study area
The study area was Osogbo and the ten local districts that surround it, which is located in Osun State, in the South-western region of Nigeria, located within latitude 7°46ʺN and 7°48ʺN and between longitude 4°31ʺE and 4°35ʺE. The area of study includes Osogbo, Ede North, Olorunda, Obokun, Egbedore, Ede South, Orolu, Ifelodun, Boripe, Atakumosa West and Ilesa West (Figure 1). The rapid pace of urbanization of Osogbo which can be dated back to 1991 when it became the capital city of the newly created Osun State [18]. Not long after the state was created neighbouring towns such as Ede North, Olorunda and Ifelodun began to experience increase administrative and economic activities leading to rural-urban migration for people in search of greener pasture. At the same time the numbers of commercial and residential buildings continue to increase while the construction of roads, buildings, factories, and manufacturing plants became more rampant. The phenomenal growth in the population overtime is related to the introduction of modern technology and administration as Osogbo became a growth center that pulled population from its neighbouring settlements through centripetal forces triggered by industrial growth. Road transport allowed dispersal of development in all direction from the traditional core. Osogbo has over the years become a capital with several core areas [19].

Figure 1: The study area, Nigeria (a), Osun State (b) Osogbo
The climate of Osogbo is dominated by the influence of three major wind currents, namely; the maritime tropical (mT) air mass, the continental tropical (cT) air mass and the equatorial easterlies [20]. The mT air mass originates from the southern high-pressure belt located off the coast of Namibia, and in its trajectory, pick up moisture from over the Atlantic Ocean, crosses the Equator and enters Southwest Nigeria [21]. The cT air mass originates from the highpressure belt north of the Tropic of Cancer. It picks up little moisture along its path and is thus dry. This influences the dry harmattan season. The harmattan season occurs in the middle of the dry season around December and extends till February and March where it clears off as rainy season approaches. The season is thus characterized by low insolation as a result of dusty wind from Sahara desert which brings about haze in the atmosphere.
Data acquisition
Two scenes of Landsat-5 Thematic mapper (TM) and Landsat-8 Operational Land Imager (OLI) of (190/55) acquired on 15 January 1986 and 2015 respectively were used in this research. The datasets were provided by the United State Geological Survey (USGS) websites.
Image preprocessing
Data processing: The imageries were firstly pre-processed for geometric rectification. The image bands used for this study were geometrically rectified to Geographic Coordinate System; WGS_84_UTM Zone 31N. Atmospheric corrections, contrast stretching, histogram equalization and spatial filtering were as well carried out in order to improve the spectral information of the bands combination, for land cover change assessment.
Linear Spectral Mixing Analysis (LSMA)
The linear spectral mixture analysis (LSMA) approach is based on the assumption that the spectrum was a linear combination of the spectral of all components in a pixel; the spectral proportions of the components represented the percentage of the surface features [22]. These included vegetation, High albedo (New concretes, iron roofs of the factory) and Low Albedo (old concrete roofs, asphalt rods). Each type of endmembers was normalized by the average value of that type. The constrained MSA was finally used to process the pixel values of the masked image with endmembers’ spectra. It was also assumed that there was no interaction between the photons reflected by each component.
The linear spectral mixture analysis (LSMA) was adopted in this study for un-mixing pixels. The mathematical model of LSMA could be expressed as:
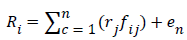 ---------(1)
Where,
Rn =The reflectance for the ith pixel.
rj = The spectral reflectance of the jth surface component.
fij =The fraction of the jth surface component in the ith pixel.
Endmember fractions
The pixel values of the masked Landsat images were separated into fractions for the three endmembers by resolving the linear mixture spectral model of equation (2) as shown above, as an urban feature with a wide range of spectral properties, impervious surfaces can possess both high and low albedo values. Therefore, a linear mixture of low and high albedo was regarded as a good representation of imperviousness as in equation (2) below, and the fraction of impervious surface for each pixel could be seen as the sum of fractions of high albedo and low albedo [23].
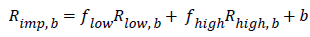 --------(2)
Where:
Rimp,b =Reflectance of impervious surfaces for band b
Rlow,b =Reflectance of low albedo impervious surfaces for band b
Rhigh,b =Reflectance of high albedo impervious surfaces for band b
Flow =Fraction of low albedo
Fhigh =Fraction of high albedo
Eb =error for band b
Impervious surface estimation
A constrained least-squares solution was applied to un-mix the MNF result into five fraction images. The vegetation was the sum of forest fraction and farm land fraction. Equation (1) was used to calculate the impervious surface coverage using high albedo and low albedo fraction images (2)
Image classification
The thermal bands with temperature values in Celsius were further classified using the ISODATA unsupervised classification. The obtained classes were sieved, clumped, combined and vectorized. The vectors were later exported to shapefiles for further processing in ArcGIS 10.3 environment. The spatial distribution of %ISA was classified as high albedo, vegetation and low albedo based on their fraction at the pixel level since they were determined from a linear unmixing model.
Calculation of land surface temperature
Regardless of atmospheric attenuation, LST can be derived from spectral radiance by the following two formulas. The resulting temperatures in Kelvin were further converted to Celsius values.
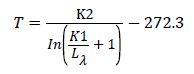
Where; T=at-satellite brightness temperature [Celsius degree], K1=calibration constant 1 [W/(m2sr μm)], K2=calibration constant 2 [Kelvin], In=natural logarithm, Lλ=spectral radiance at the sensor's aperture [W/(m2sr μm)]
Estimation of Land Surface Emissivity (LSE)
In estimating LSE, Normalized Differential Vegetative Index (NDVI) was utilized for emissivity correction,
0.004pv + 0.986
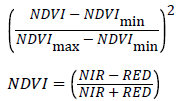
Where, Pv=Proportion of vegetation, NIR=Near InfraRed Band, Red=Red Band, NDVImin=Minimum value of NDVI, NDVImax=Maximum value of NDVI
Estimating LST
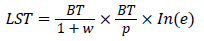
Where, BT=At-sensor brightness temperature, w =wavelength of emitted radiance, 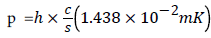 , h=Plank’s constant
  , s=Boltzmann constant
 , c =velocity of light(2.998 × 10⁸m/s), e =Land Surface Emissivity
Impervious surface area extraction
The impervious surface areas of two years were extracted from the classified images, from which we later derived dynamic changes of urban sprawl in the study area. For the Landsat TM images, the builtup areas were extracted after image pre-processing and image classification and then built-up areas were regarded as one of the indicators to measure urban sprawl.
GIS operations and generation of zonal statistics
ArcGIS 10.3 was basically used for all GIS operations. The zonal statistics was generated from the classified images using the percentage impervious surface image and land surface temperature image. This function summarized the values of the raster within the zones of another data and the report of the results was presented as a Table 1.
| Satellite (Sensor) | Path/Row | Date/Time of Acquisition | Sun Elevation | Cloud Cover | Image Quality |
|---|---|---|---|---|---|
| Landsat TM (1986) | 190/55 | 15-01-1986 09:24:08 |
44.38036505 | 0.00 | 9 |
| Landsat OLI/TIRS (2015) | 190/55 | 15-01-2015 09:56:47 |
50.41217703 | 0.01 | 9 |
Table 1: Details of satellite imageries used.
Results and Discussion
Percentage impervious surface area distribution
The percentage impervious surface area distribution over the Linear Spectral Unmixing (LSU) images composed of three classes of high albedo, vegetation and low albedo.
The result in Figure 2 revealed that rural areas of Orolu, Egbedore, Ede South, Atakumosa West, Obokun, Ilesa West, Ifelodun and Boripe have low percentage impervious surface area lower than 15%. The areas were mainly located in the farmlands and forest and were all classified in the study as vegetation considering their collective high reflectance in the near infrared (NIR) bands. The peri-urban district, which lies in the middle (Olorunda) has 24%. It is located in the nearby cities surrounding the core urban areas and around the fringes. In addition, it was noticed that the middle percentage was closely connected with human activities in developing new residential areas around the main urban city. The high percentage ISA (>45%) was however observed within the most urbanized areas of Osogbo and Ede North (Table 2).

Figure 2: Comparison of 1986 and 2015 Change in Percentage Impervious Surface Area
| LGA | Mean 1986 | Mean 2015 | Difference | % Change in Impervious |
|---|---|---|---|---|
| Orolu | 124.95 | 142.75 | 17.80 | 14 |
| Egbedore | 111.82 | 120.48 | 8.66 | 8 |
| Osogbo | 84.78 | 124.07 | 39.29 | 46 |
| Ede North | 107.88 | 162.76 | 54.88 | 51 |
| Olorunda | 158.87 | 196.86 | 37.99 | 24 |
| Ede South | 168.47 | 186.84 | 18.36 | 11 |
| Atakumosa West | 214.83 | 216.00 | 1.16 | 1 |
| Obokun | 193.84 | 175.59 | -18.24 | -9 |
| Ilesa West | 144.91 | 134.27 | -10.63 | -7 |
| Ifelodun | 136.99 | 153.48 | 16.49 | 12 |
| Boripe | 176.33 | 175.85 | -0.48 | 0 |
Table 2: Percentage change in impervious surface area.
The high percentage impervious surface area of 46% recorded for Osogbo and 51% recorded for Ede North could be attributed indirectly to human activities resulting from urbanization through the conversion of vegetated areas into commercial and residential buildings in the high density urban areas. Others include construction of roads, buildings, factories, and manufacturing plants. Hence, human activity (notably by population increase) is the most important factor driving the increase of the impervious surface areas.
Conversely, the decrease in imperviousness of -9%, -7% and 0% in rural districts like Obokun, Ilesa West and Boripe respectively could be attributed to rural-urban migration and loss of interest in farming activities in the rural areas and the peri-urban communities (Figure 3).

Figure 3: Percentage impervious surface area distribution in the study area
Many development policies have failed to encourage young rural farmers because they have supported either willingly or unwillingly the development of those who already have land, power, influence and political clout. This further alienates the rural poor and this may further put the pressure back on rural-urban migration. This finding agrees with Oloukoi et al. who argues that urban settlement attracts people as they offer better economic opportunities and provide access to basic social needs like water and sanitation, better health care and well-being. Oyinloye and Adesina analyzing the situation in Ibadan city observed that one human phenomenon that has been impacting severely on the environment is urbanization.
Land surface temperature patterns and statistics
The digital remote sensing method provides not only a measure of the magnitude of surface temperatures of the entire district, but also the spatial extent of the surface heat island effects (Table 3). The 2015 LST map had a range of 20.51°C –37.72°C with the highest surface temperatures located in the central business district areas of Osogbo and Ede North and the peri-urban of Olorunda. The 1986 LST showed low SUHI effects with urban and rural surface temperature contrasts. General patterns of SUHI with a mean temperature of 21.23°C in 1896 and 25.85°C in 2015 for the entire study area with the percentage changes in LST are shown in Table 3.
| Year | Tmin (°C) | Tmax (°C) | Tmean (°C) | S.D |
|---|---|---|---|---|
| 1986 | 17.99 | 46.17 | 21.23 | 1.44 |
| 2015 | 20.51 | 37.72 | 25.85 | 2.05 |
Table 3: Temporal distribution of land surface temperature in Osogbo and its environment.
Three apparent hot spots; Osogbo, Ede North and Olorunda can be identified. It was also clear that temperature difference increases towards the center of the highly urbanised area and decreases in the direction of the peripheries (Table 4).
| LGA | Mean 1986 | Mean 2015 | Difference | % Change in LST |
|---|---|---|---|---|
| Orolu | 21.34 | 25.13 | 3.78 | 18 |
| Egbedore | 22.24 | 27.23 | 4.99 | 22 |
| Oshogbo | 22.35 | 28.72 | 6.37 | 29 |
| Ede North | 21.45 | 28.11 | 6.66 | 31 |
| Olorunda | 20.76 | 26.08 | 5.32 | 26 |
| Ede South | 21.21 | 25.25 | 4.04 | 19 |
| Atakumosa West | 20.51 | 24.79 | 4.28 | 21 |
| Obokun | 20.96 | 25.21 | 4.24 | 20 |
| Ilesa West | 21.89 | 26.88 | 4.99 | 23 |
| Ifelodun | 22.06 | 27.35 | 5.28 | 24 |
| Boripe | 21.57 | 26.17 | 4.59 | 21 |
Table 4: Percentage change in land surface temperature of the local government areas.
The general extent of the heat island was covered essentially by the State Capital boundary, which delineates the outer reaches of the regional utility services and urban development. The 1986 LST values displayed a range of figures which can be comparable to that of the 2015 LST map, but their thermal patterns were different, especially in rural areas where vegetated surfaces had cooler temperatures than peri-urbans. As urbanization therefore spreads east and west of the highly urbanized districts, neighbouring districts including Ilesa West, Ede North and Ifelodun gradually became warmer (Figure 4) and this may explain why most of the increase in mean temperature has occurred in these districts [24]. On this map, (Figure 4) the urban center and peri-urbans were much warmer than the rural areas covered by vegetation. The coolest temperatures were in the western rural part of the study area where urbanization is minimal. The difference in mean surface temperature resulting in the more distinct urban heat island can be attributed to the gradual transition of landuse from suburban to urban land [13].

Figure 4: Comparison of 1986 and 2015 land surface temperature.
The highly urbanized Osogbo and Olorunda districts in this study, shows a more compacted urban form which gradually evolved during the study frame and led to UHI increase (Table 4). However, most of the increase in temperature happened mostly in regions that border the highly urbanized districts which include Ede North, Ilesa West, and Ifelodun than in other district.
Relationship between land surface temperature and impervious surface area
The highest percentage change of both land surface temperature and impervious surface areas in the study was recorded in Osogbo and Ede North local government areas (Figure 5). It was recorded that Osogbo had 29% increase in LST and 46% increase in ISA and Ede North had 31% and 51% increment both in LST and ISA respectively. The percentage impervious surfaces in areas like Obokun decreased by 9% and Ilesa West by 7%. In most of the more urbanized area where bare surface had reduced, impervious surfaces are limited. Some areas close to the highly urbanized centres like Olorunda, Ifelodun, Ede South, and Orolu local government areas have moderate temperature and impervious surface areas (Figure 5). There is significant (p=0.01) and positive (0.81) correlation between the land surface temperature and impervious surface area (Figure 6).

Figure 5: Percentage change in land surface temperature and impervious surface in the study area.

Figure 6: Correlation between the change in land surface temperature and impervious surface area.
The expansion of urban lands also generated larger impervious surface area in the cities and the impervious surfaces which were almost totally built by humans contribute a very large share to the urban heat island problem in the study area. The contributions of impervious surfaces to the urban heat island effect have been linked to reducing human comfort especially during the dry season. The increment in both temperature and imperviousness especially in those towns could also result in incessant flood occurrence, harsh temperature and human health diseases (skin reactions and respiratory diseases) among other consequences. Increase in temperature has also been indicated to influence physiologic discomfort, as a result of increased heat stress. Studies by Meehi et al. suggested that a change in climate occur from increasing greenhouse gases and could lead to an increase in heat. Harlan et al. also stated that in addition to elevated mortality, heat stroke, serious illness such as exhaustion, dehydration, cardiovascular diseases, displaying increased blood viscosity and other physiological changes are experienced by people that are exposed to heat and this therefore will increase health risks.
Conclusion
The LST results showed a variation from the rural/vegetated area (with lowest temperatures) to the middle built up areas (with medium temperatures) and then to the central urbanized areas (with the highest temperatures). This helped in concluding that LST was a good indicator of surface urban heat island effect within Osogbo and the ten local government areas that surround it. This study result suggests that the rapid population increase resulted in an obvious expansion of impervious surfaces and urban heat island especially in the urban districts of Osogbo and Ede North. The strong relationship between LST and %ISA revealed in this study suggested that it was %ISA that contributes a very large share to the urban heat island problem in Osogbo.
References
- Donk VM (2006) Positive urban futures in Sub-Saharan African: HIV/AIDS and the Need for a Broader Conceptualisation (ABC)
- United Nations Centre for Human Settlements (UN- Habitat) (2006). Cities-Magnets of Hope. World Habitat Day Celebration Release, Nairobi.
- Jensen JR (2000) Remote sensing of the environment: An earth resource perspective. Prentice-Hall, New Jersey 181-243
- Ewing R, Pendall R, Chen D (2002) Measuring sprawl and its impact. Report of Smart Growth America 1: 1-42.
- Kent BB, Morgan JM, Roberge MC, Lowe S (2001) Sprawl development: Its patterns, consequences, and measurement. Towson University, Towson 24.
- Grimmond S (2007) Urbanization and global environmental change: Local effects of urban warming. The Geographical Journal 173: 83-88
- Burchell RW, Lowenstein G, Dolphin WR, Galley CC, Downs A, et al. (2000) Costs of sprawl
- Squires GD (2002) Urban sprawl: Causes, consequences, and policy responses. The Urban Institute, USA
- Parker DE (2010) Urban heat island effects on estimates of observed climate change. Wiley Interdisciplinary Reviews: Climate Change 1: 123-133
- Rizwan AM, Dennis LYC, Liu C (2008) A review on the generation, determination and mitigation of urban heat island. Journal of Environmental Sciences 20: 120– 128
- Chen XL, Zhao HM, Li PX, Yin ZY (2006) Remote sensing image – Based analysis of the relationship between urban heat island and land use/cover changes. Remote Sensing of Environment 104: 133–146
- Hart MA, Sailor DJ (2009) Quantifying the influence of land-use and surface characteristics on spatial variability in the urban heat island. Theoretical and Applied Climatology 95: 397-406
- Zhi Q, Guangjin T, Lixiao Z, Xinliang X (2014) Influences of urban expansion on urban heat island in Beijing during 1989-2010. 1-12
- Weng Q (2002) Land use change analysis in the Zhujiang Delta of China using satellite remote sensing, GIS and stochastic modelling. Journal of Environmental Management 64: 273-284
- Weng Q, Lu D, Schubring J (2004) Estimation of land surface temperature-vegetation abundance relationship for urban heat island studies. Remote sensing of environment 88: 467-483
- Herold M, Couclelis H, Clarke KC (2005) The role of spatial metrics in the analysis and modeling of urban land use change. Computers, environment and urban systems 29: 369-399
- Maguire DJ (1991) An overview and definition of GIS. Geographic Information Systems: Principles and Applications 1: 9-20
- Abegunde AA (2009) The Role of community based organisations in economic development in Nigeria: The case of Oshogbo, Osun state, Nigeria. International NGO Journal 4: 236-252
- Aguda AS, Adegboyega SA (2013) Evaluation of spatio-temporal dynamics of urban sprawl in Osogbo, Nigeria using satellite imagery and GIS techniques. International Journal of Multidisciplinary and Current Research 1-14
- Odekunle TO (2004) Rainfall and the length of the growing season in Nigeria. International Journal of Climatology 24: 467-479
- Omogbai BE (2010) An empirical prediction of seasonal rainfall in Nigeria. Journal of human Ecology 32: 23-27
- Fanglei F, Yingbin D, Renrong C (2012) Extraction and analysis of impervious surfaces based on a spectral un-mixing method using Pearl River Delta of China Landsat TM/ETM+ Imagery from 1998 to 2008, Sensors 12: 1-17
- Christina M (2003) Assessing the impact of urban development on net primary productivity in the Southeastern United States. Remote Sensing of the Environment Journal 86: 401-410
- Akinbode OM, Eludoyin AO, Fasae OA (2008) Temperature and relative humidity distributions in a medium-size administrative town in Southwest Nigeria. Journal of Environmental Management 87: 95-105
Citation: Adewale AO, Adepoju KA, Awotoye OO (2017) Mapping and Assessing Impervious Surface Areas and Urban Heat Island in Osogbo, Nigeria. J Earth Sci Clim Change 8: 424 DOI: 10.4172/2157-7617.1000424
Copyright: © 2017 Adewale AO, et al. This is an open-access article distributed under the terms of the Creative Commons Attribution License, which permits unrestricted use, distribution, and reproduction in any medium, provided the original author and source are credited.
Select your language of interest to view the total content in your interested language
Share This Article
Recommended Journals
Open Access Journals
Article Tools
Article Usage
- Total views: 7239
- [From(publication date): 0-2017 - Dec 15, 2025]
- Breakdown by view type
- HTML page views: 6119
- PDF downloads: 1120