Research Article Open Access
Long-Memory Trends in Disturbances of Radon in Soil Prior to the Twin ML=5.1 Earthquakes of 17 November 2014 Greece
| Nikolopoulos D1*, Petraki E2, Nomicos C3, Koulouras G3, Kottou S4 and Yannakopoulos PH1 | |
| 1TEI of Piraeus, Department of Electronic Computer Systems Engineering, Petrou Ralli and Thivon 250, GR-12244, Aigaleo, Greece | |
| 2Brunel University, Department of Engineering and Design, Kingston Lane, Uxbridge, Middlesex UB8 3PH, London, UK | |
| 3TEI of Athens, Department of Electronic Engineering, Agiou Spyridonos, GR-12243, Aigaleo, Athens, Greece | |
| 4University of Athens, Medical School, Department of Medical Physics, Mikras Asias 75, GR-11527 Athens, Greece | |
| Corresponding Author : | Nikolopoulos D TEI of Piraeus, Department of Electronic Computer Systems Engineering Petrou Ralli & Thivon 250, GR-12244 Aigaleo, Greece Tel: +0030-21 5381560 E-mail: dniko@teipir.gr |
| Received November 26, 2014; Accepted December 20, 2014; Published January 01, 2015 | |
| Citation: Nikolopoulos D, Petraki E, Nomicos C, Koulouras G, Kottou S, et al. (2015) Long-Memory Trends in Disturbances of Radon in Soil Prior to the Twin ML=5.1 Earthquakes of 17 November 2014 Greece. J Earth Sci Clim Change 6:244. doi: 10.4172/2157-7617.1000244 | |
| Copyright: ©2015 Nikolopoulos D, et al. This is an open-access article distributed under the terms of the Creative Commons Attribution License, which permits unrestricted use, distribution, and reproduction in any medium, provided the original author and source are credited. | |
Visit for more related articles at Journal of Earth Science & Climatic Change
Abstract
On 17 November 2014, at 23:05 and 23:09 local time, two shallow earthquakes of ML=5.1 occurred in Prokopion, Chalkis, 86 km North-West of Athens, Greece. Prior to the earthquakes a significant radon anomaly was observed by a telemetric radon station operating with a Barasol MC2 probe (Algade France). The anomaly lasted approximately between 24 Oct 2014 and 10 November 2014. This paper reports the trends of long-memory that were addressed through Rescaled Range (R/S) analysis and Detrended Fluctuation Analysis (DFA). Hurst exponents above 0.8 were found by R/S analysis during the radon anomaly. The signal exhibited persistent behavior. DFA verified the findings of R/S analysis within the anomaly.
| Keywords |
| Earthquakes; Thermal spas; Radon in soil; R/S analysis; DFA |
| Introduction |
| Radon is an alpha emitting noble gas that is produced by the radioactive decay of uranium (238U) series [1]. The most significant isotope is 222Rn because it's concentration is higher when compared to the trivial concentrations of the other radon isotopes [1]. 222Rn (hereafter, radon) has a relatively long half-life (3.8 days). For this reason it appears at measurable levels in the environment. As radon decays it may dissolve in soil’s pores and fluid [1]. Thereafter, it migrates near or far and dilutes in atmosphere, surface and underground water [1]. Anomalous radon variations have been observed prior to earthquakes in groundwater, soil gas, atmosphere and thermal spas [2-14]. It has been identified as a potential short-term [15] earthquake precursor. The related research is still in progress, investigating further potential associations between radon and earthquakes [2-14]. Nevertheless, no universal model exists to serve as a pre-earthquake signature [16,17]. Moreover, there is no definite rule to link any kind of pre-earthquake anomaly to a specific forthcoming seismic event, either if this is intense or mild [16-18]. For these reasons, despite the fairly abundant circumstantial evidence, the scientific community still debates the precursory value of premonitory anomalies detected prior to earthquakes [16]. On the other hand, well established criteria exist to identify pre-earthquake patterns hidden in time-series which are based on the concepts of fractality and self-organization [15-47]. Four recent reports revealed fractal Self-Organized Critical (SOC) characteristics of radon disorders prior to significant earthquakes in Greece [18- 21]. An important recent paper [22] reported also pre-earthquake fractal characteristics of a 3 year radon signal through the method of multifractal Detrended Fluctuation Analysis. The recent radon related papers [18-22] employed methods such as the wavelet spectral fractal analysis, the Detrended Fluctuation Analysis and the entropy analysis and reported that the investigated disorders exhibited self-affine persistent–antipersistent behavior similar to those of the pre-seismic electromagnetic disturbances of the ULF, LF and HF range [23-47]. |
| This paper reports the anomalous radon signal that was collected by the telemetric radon station prior to the twin ML=5.1 earthquakes of 17 November 2014 that occurred in Greece. Trends of long-memory are searched through Rescaled Range (R/S) analysis [48,49] and Detrended Fluctuation Analysis (DFA) [50-56]. Results are interpreted in terms of Hurst exponents [48,49]. |
| Materials and Methods |
| Instrumentation |
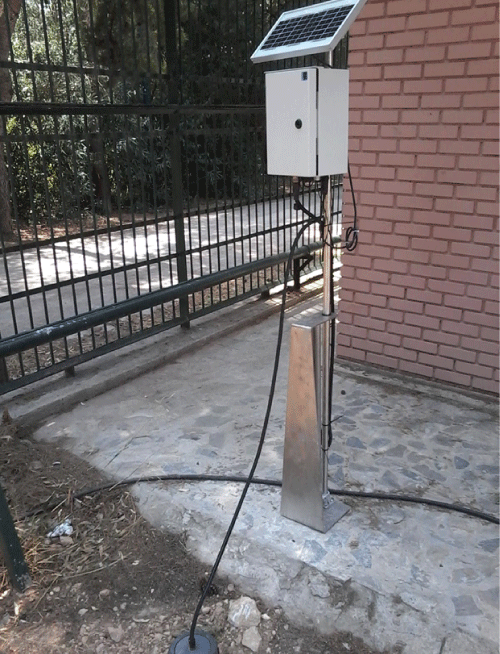
| Radon measurements were conducted with VDG Baracol (ALGADE, France) in the Campus of Technological Educational Institution of Athens. Radon in soil was monitored by a telemetric radon station operating with the radon probe Barasol MC2 (BMC2). The main quantities measured by the BMC2 probe were the concentration of 222Rn, the temperature and the atmospheric pressure. For the measurement, the BMC2 sensor (implanted silicon detector) authorizes counting of atoms of 222Rn and its daughter products by spectrometry. The calibration of the sensor enables the volumetric activity of 222Rn to be calculated. The instrument is designed to be used in difficult environments and to collect passive measurements with no disturbance of the environment. For monitoring purposes, the BMC2 probe was installed in a borehole at 1 m depth and data sampling was performed at the rate of 1 measurement per 15 minutes. The radon station is depicted in Figure 1. |
| Mathematical methods |
| Hurst exponent: Hurst exponent (H) is a mathematical quantity which can detect long-range dependencies in time-series [48,49]. It can estimate the temporal smoothness of time-series and can search if the related phenomenon is a temporal fractal [18,19,21,24,25,27,35,36,45-47]. H-values between 0.5<H<1, manifest long-term positive autocorrelation in time-series. This means that a high present value will be, possibly, followed by a high future value and this tendency will last for long future time-periods (persistency) [20,21,23,24,57,58]. H-values between 0<H<0.5 indicate time-series with long-term switching between high and low values. Namely, a high present value will be, possibly, followed by a low future value, whereas the next future value will be high and this switching will last long, into future (anti-persistency) [20,21,23,24,57,58]. H=0.5 implies completely uncorrelated time-series. |
| Rescaled range (R/S) method: The R/S method was introduced by Hurst [48] and attempts to find patterns that might repeat in the future. The method employs two variables, the range, and the standard deviation, S, of the data. According to the R/S method, a natural record in time, X (N )= x(1), x(2),..., x(N ) is transformed into a new variable, y(n, N )in a certain time period n ( n=1,2,...,N ) from the average, |
 |
| over a period of N time units [48]. y(n, N ) is called accumulated departure of the natural record in time [48]. The transformation follows the formula: |
 |
| The rescaled range is calculated from the following equation [48,57,59-61]: |
 |
| The range is defined as the distance between the minimum and maximum value of y(n, N ) by: |
 |
| The standard deviation S (n) is calculated by: |
 |
| R/S is expected to show a power-law dependence on the bin size: |
 |
| where H is the Hurst exponent and C is a proportionality constant. The log transformation of the last equation is a linear relation |
 |
| from which, exponent H can be estimated as the slope of the best fit line. |
| Detrended Fluctuation Analysis (DFA): Detrended Fluctuation Analysis is a method for scaling the long-range auto-correlation of nonstationary, noisy or randomized signals and sometimes of short data length [19,50-57]. It is based on the quantification of the complexity of the signals. It is a modified root-mean-square analysis of a random walk based on the observation that a stationary time-series with long-range correlations can be integrated to form a self-similar process. Mean square distance of the signal from the local trend line is analyzed as a function of scale parameter. There is usually power-law dependence and interesting parameter is the exponent. In short, the original timeseries is integrated once; then the fluctuations F(n) of the integrated signal are determined around the best linear fit in a time window of size n . The slope of the line relating log(F(n))-log(n) determines the scaling exponent (self-similarity parameter) b . This line may display a deflection (crossover) at a certain time scale where the slope abruptly changes. The interpretations of power-law scaling exponents and the crossovers are system dependent. |
| The DFA algorithm on 1-dimensional signal yi ,( i = 1,....,N ), involves the following six steps [19,50-57]: |
| (i) In the first step, the integrated profile is determined: |
 |
| where <...> denotes the mean and is the symbol of the different time scales. |
| (ii) The integrated signal, y(k), is divided into non-overlapping bins of equal length , n. |
| (iii) In each bin of length n, y(k) is fitted by using a polynomial function of order 1, which represents the trend in that box. A linear fit is usually used. The y coordinate of the fit line in each box is denoted by yn(k). |
(iv) The integrated signal is detrended by subtracting the local
trend, yn(k), in each box of duration . The detrended signal  is
hence calculated in each box as: is
hence calculated in each box as: |
 |
| (v) For a given bin size n, the root-mean-square (rms) fluctuations of this integrated and detrended signal is calculated as: |
 |
Hence, F(n) represents the rms fluctuations of the detrended timeseries  . . |
| (vi) The above is repeated for a broad range of scale box sizes (n) to provide a relationship between F(n) and the box size n. In general F(n) will increase with the size of segment n. Then a logarithmic graph (logF(n) vs log(n)) is created. The linear dependence between the average root-mean square fluctuation F(n) and the bin size n indicates the presence of long-lasting self-fluctuations: |
 |
| the slope of the line, i.e., the scaling exponent, quantifies the strength of the long-range correlations in the time-series. |
| Results and Discussion |
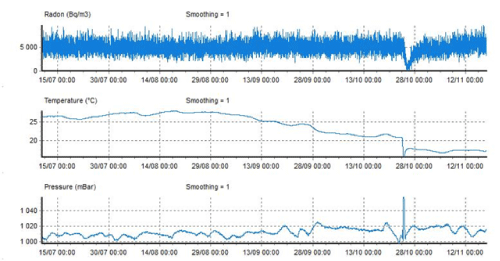
| Figure 2 presents the radon signal recorded by the monitoring station of radon in Athens (Greece) prior to the earthquakes of 17 November 2014. It also presents the evolution of temperature and air pressure measured by the BMC2 probe. The measurement data presented in Figure 2 spanned from 10 September 2014 to 17 November 2014, namely they ended approximately one hour after the twin earthquakes. A significant radon anomaly was observed. The anomaly started approximately on 24 October 2014 and lasted roughly up to 10 November 2014. During this radon anomaly, significant disturbances were addressed in pressure and temperature in the borehole of the measurements. The environmental conditions in the interim interval did not exhibit any extreme alterations. No external influence was observed as well. Noteworthy is the simultaneous downturn of temperature and pressure in the borehole. Remarkable is also the sudden increase in pressure which may have act as a piston-like procedure for radon emanation. The pressure profile may partially explain the drop of radon concentration; however, it may not explain the gradual increase of it. Most importantly, the source of these alterations could not be attributed to changes of environmental conditions or external influences. On the other hand, a geological long-lasting procedure attributive to the twin earthquakes of 17 November 2014 could justify the noteworthy concentration changes of radon in soil of the borehole between 24 October 2014 and 10 November 2014. |
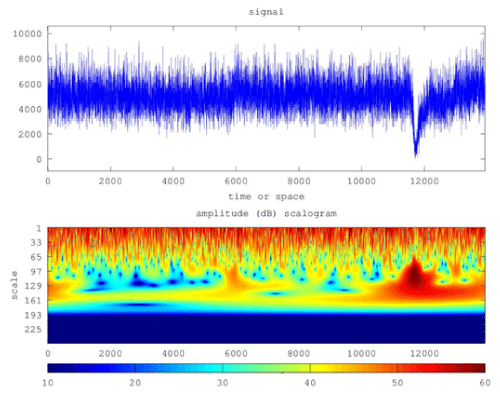
| Figure 3 shows the 50 db wavelet scalogram of the radon signal of Figure 2a. The scalogram was produced with a logarithmic Gabor filter of 256 scales. Of significance are the following issues. |
| (a) The scalogram of the first 11500 signal's samples did not exhibit alterations; |
| (b) The useful scale range was approximately from scale 1 to scale 160. Scales above did not contribute in the representation of the signal. Considering that the high scalogram scales (130-160) correspond to the small spatial frequencies, more power was allocated to the high scales viz. the small spatial frequencies. Investigators [10,57] have declared this as a footprint of earthquake generation; |
| (c) The radon anomaly in the scalogram of Figure 3 lasted approximately between samples 11500 and 13000. Each sample corresponded to 15 min of recordings of radon in soil. Hence the radon anomaly in Figure 3, lasted 1500 samples of fifteen minute duration, viz. approximately 15 days. This finding is in accordance to the data of Figure 2a; |
| (d) The wavelet transform employed in Figure 3 is superior to the Fourier transform since it involves space and time in a combined way [10-21,25,27,57]. The temporal variations can be corresponded to spatial frequencies, viz., scale parts the earth-system that fracture in the crust. Hence, time can be corresponded to space, namely regions in the earth that break; |
| Further to the above it should be mentioned that, as the wavelet spectrogram analysis of Figure 3, the Fourier spectrogram analysis [19] revealed that the background variations of radon in soil were characteristically different in Fourier space than those of the anomalous parts [19]. In addition, the Fourier spectrograms, presented [19], as the wavelet scalograms, more power at the high frequencies and, most importantly, similar db profiles of the background parts as those of the scalograms. Hence, it may be supported that the first 11500 samples of Figure 3 referred to background concentrations of radon in soil in the borehole of TEI of Athens. |
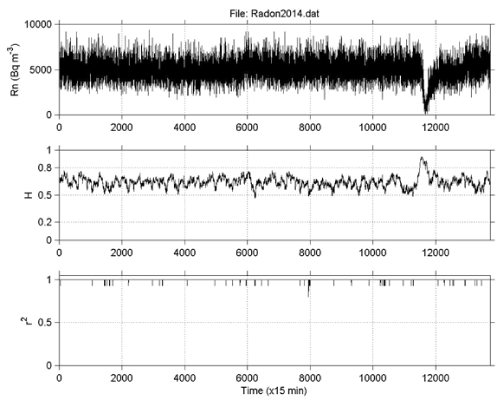
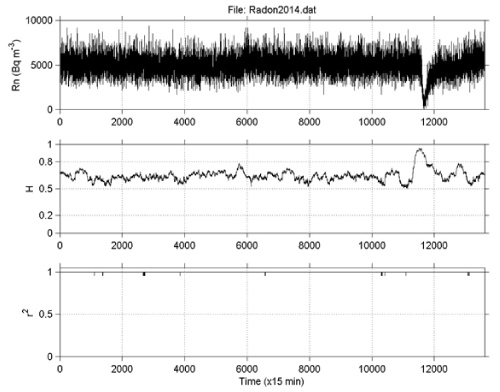
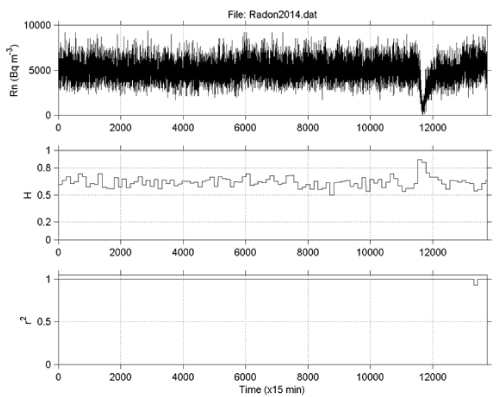
| Figures 4-6 present the results from the application of the R/S method to the radon signal of Figure 2a, through two different approaches namely sliding window technique and lumping. To apply the sliding window technique the following four steps were followed: |
| (i) The signal was divided in segments-windows of certain size (number of samples). |
| (ii) In each segment-window, R/S analysis was applied. |
In each segment, the least square method was applied to the  linear representation of equation (7). Successive
representations were considered those exhibiting squares of Spearman’s
correlation coefficient above 0.95. linear representation of equation (7). Successive
representations were considered those exhibiting squares of Spearman’s
correlation coefficient above 0.95. |
| The window was slid for one sample and steps (i)-(iii) were repeated until the end of the signal. |
| To apply the lumping technique, step (iv) was modified. Instead of the continuous sliding of one-sample per segment, the signal was lumped at the whole size of the segment, viz. the sliding step was set equal to the segment size. It is noted that the segment-size of 128 corresponds to radon recordings of 1,920 min duration, i.e., approximately 32 h of segmented analysis. The double value of the window-size (256) in Figure 5 corresponds roughly to 64 h of segmented R/S analysis. It is worth to mention, that lumping is considered advantageous according by some researchers [28,29]. |
| Figures 4-6 reveal very important information about the time evolution of the Hurst exponent. It can be observed that all Hurst exponent values were in the range 0.5<H<1. This means that the radon time-series had underlying memory associated with persistency. This implies that if the signal has a tendency to increase its values in a certain time period, it is most probable to continue increasing the values. In an alternative interpretation, if the signal decreases in a time period, it will continue to decrease. Within the anomaly, Hurst exponents increased above 0.8. This is indicative of very long memory. This has certain implications. The radon concentrations in a certain time period of long memory refer to their past values so as to define their present values and their future values. Moreover, Hurst peaking within the anomaly implies that the anomaly generating earth-system was not random. On the contrary, it was produced by fracture of cracks which propagated in the crust in a way that a certain crack of the past was a source of a present crack which was a source of a future crack. Investigators have proposed such a crack propagating procedure as a pre-earthquake signature [16,17]. In this sense, the cracks of the past were organized with the cracks of the presence and the future, generating a backbone of self-organized asperities [16-21]. This roadway, i.e., the asperities backbone provided a pathway for either radon sucking (continuous or abrupt decrease due to under pressure in the asperities) or radon emanation (continuous or abrupt increase due to over pressure in the asperities). Researchers have described this process under the so called DD model (dilatation and dilatancy) [18,61]. In this sense, the DD model could be descriptive of behavior of the Hurst exponent (Figures 4-6) only within the self-organization phase of the asperities. It is important to note that the aforementioned long-memory process was not quick since it lasted approximately 15 days. It is very important also that similar slow behavior of anomalous concentration of radon in soil was also reported for Ileia, Greece prior to a very disastrous earthquake of 2008 in Kato Achaia, Peloponnisos Greece [16-20]. It was also similar to a pre-earthquake anomaly of radon in soil detected in Lesvos, Island, Geece in 2008 [21]. |
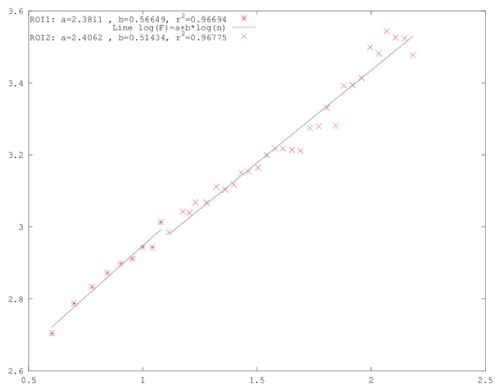
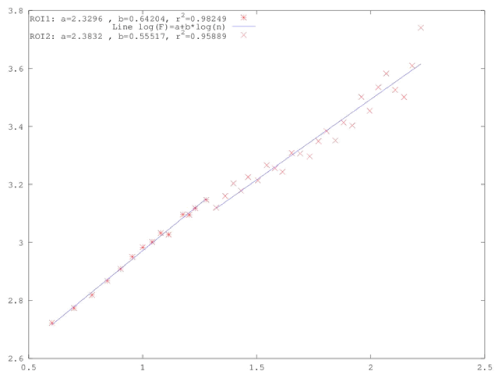
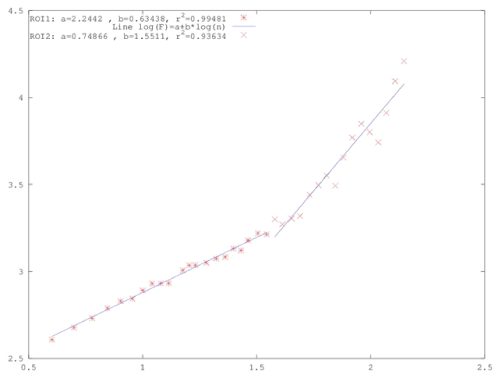
| It is significant that the Hurst exponents peaked well above 0.8 for the same time period as the radon anomaly. More significant is that this peaking was observed both through the sliding window technique and through lumping. This fact indicates that the Hurst exponent increase during the anomalous concentration of radon in soil of Figure 2a, was not an artifact of the method. Further evidence can be provided by the DFA method. Figures 7, 8 and 9 present three characteristic DFA plots similar to those proposed by Peng et al. [52-56]. To apply the DFA method the experimental data were fitted to equation (11), viz., F(n)~nb. To identify existing long-lasting self-fluctuations in the experimental data, the outputs of the DFA method were plotted in log(F(n))-log(n) representation and fitted to linear trendlines. It may be recalled that the linear trendline is not constant (independent of scale) and crossovers exist, i.e., its slope differs between the short and the long time scales. All generated DFA plots verified this and exhibited one crossover. This crossover was observed as a change in the slope of the linear trendline of the DFA plot. The crossover can be observed in Figures 7-9 as change in the slope of the two trendlines. It should be mentioned, that some electromagnetic disturbances of the MHz range presented DFA plots with not one, but two crossovers [19]. |
| The DFA plots prior and after the anomalous radon part were similar (Figures 7 and 8). The slopes of the short and long scales were analogous. On the contrary, the plots within the anomaly were mirrorlike in comparison to those of the background. The characteristic plot of Figure 9, shows clearly that within the anomaly the long-scales have significantly higher slope of the linear trendline. Note that this tendency was identified in the DFA of the signal of the Ileia [19] and the one of Lesvos [21]. Most importantly, the slope of the long scales was above 1.5, namely 1.5<b<1.8. Similar b - value range was found for the long scales in previous publications [19,21,57] as well. Note that DFA is considered as very advantageous in short signals with high variations [52-56]. It is also of importance that in the whole F(n)-n range, the trend is linear in both parts of the log -log transformation with high values of the square of the Spearman's correlation coefficient (r 2>0.95) in all cases. |
| According to Peng et al. [54], the DFA results within the radon anomaly show characteristic persistent long range correlations. This characteristic epoch of the radon signal is separated by the radon background through DFA. More precisely, in the radon background the DFA exponent of the small scales (bROI-1) presented values between 0.51 and 0.70, while in the region of the anomaly, between (bROI-2) 1.5 and 1.8. The aforementioned values of the DFA slopes indicate that radon background is consistent with a fGn-model ( 0<a<1 ) [19,54,57]. On the contrary, the region of the radon anomaly presented DFA exponents consistent with a fBm-model (1<a<2 ) [19,54,57]. It is very important as well that the DFA exponent b and the spectral power-law fractal exponent β [19-21,24,25,27,44-47,59] are related with the formula β = 2.b-1 for both the fBm and fGn models [62]. According to this formula the range 0.51<bROI-1<0.70 corresponds to power-law values of 0.01<β<0.30 (ROI-1, short scales). These β - values are indicative of the fGn class [19,54,57]. On the contrary, the DFA value range within the radon anomaly corresponds to the range (ROI-2 long-scales). It is of importance that this β - value range in ROI-2 (long-scales) has been identified as a pre-earthquake signature by several publications [16- 21,23-25,27,30,31,35,36,44-47]. It is also identified as a characteristic pattern of persistent long-memory (β > 2). This finding verifies in an alternative manner the outcomes of the R/S analysis. |
| The Hurst exponent H is related to the power-law exponent β by the formula β = 2·H +1 (1<β<3) for the time-series model of fractional Brownian motion (fBm) and β = 2 · H -1 (-1<β <1) for the timeseries model of fractional Gaussian (fGn) [20,54,57]. By employing the aforementioned formula of β = 2 · b -1 for both the fBm and fGn models [62], the relationship between Hurst and DFA exponents is derived: H=b-1 for 1<b<2 and H=b for 0<b<1. In this sense, the range corresponds to Hurst exponents (radon background)(ROI-1) and the range1.5 < bROI-2 <1.8 within the radon anomaly, to 0.5 < H < 0.80 Although DFA did not identify the peaking of Hurst exponents that was observed through the sliding-window R/S analysis, the DFA results are in agreement with those of the R/S analysis. The latter is very significant because two independent techniques provide similar evidence regarding the long-memory of the system that generated the radon anomaly. This further suggests that the underlying dynamics are governed by positive feedback mechanisms and, hence, external influences tend to lead the system out of equilibrium [62]. In this manner, the system acquires a self-regulating character and, to a great extent, the property of irreversibility, one of the important components of prediction reliability [16-21]. All these issues further imply longrange temporal correlations, i.e., strong system memory. Furthermore, each value correlates not only to its most recent value but also to its long-term history in a scale-invariant, fractal manner [16-21]. The system refers to its history in order to define its future (non-Markovian behavior) [16-21]. From another viewpoint this behavior implies that the final output of fracture is affected by many processes that act on different time scales [16-21]. The aforementioned results are in good agreement with the relevant prediction based on the hypothesis that the evolution of the Earth’s crust toward the general failure may take place as a SOC phenomenon. All these issues are compatible with the last stage of earthquake generation [16-21]. |
| In conclusion it can be supported that the findings of this paper provide evidence regarding the existence of long memory in time-series of radon in soil derived prior to the recent twin ML = 5.1 earthquake of 17 November 2014 occurred in Chalkis, Greece. The findings of the R/S analysis and DFA were comparable and provided analogous estimations for the Hurst exponents. Within the radon anomaly persistent behavior was identified. The results seem to be compatible with the last stages of the earthquake generation process. |
| Conclusion |
| 1. This paper reported time-series of concentration of radon in soil recorded prior to the recent twin ML = 5.1 earthquake of 17 November 2014 occurred in Chalkis, Athens Greece. The data were derived by a telemetric radon station that operated with a BMC2 probe installed in TEI of Athens, Greece. A significant radon anomaly was observed approximately 2-3 weeks prior to the twin earthquakes. |
| 2. The data were analysed through the R/S technique and DFA. The results were interpreted in terms of Hurst exponents. Both techniques provided comparable results and analogous estimations of the Hurst exponents. R/S was employed through sliding-windows and lumping. During the radon anomaly, significant increase in Hurst exponents was addressed by the R/S technique. DFA did not identified this peaking. |
| 3. Trends of long-memory were identified during the recorded radon anomaly. The texture of the anomaly and the results of the related analysis were comparable to the texture and the long-memory patterns reported for two other radon signals collected by the team during 2008. Despite the similarities and the noteworthy radon variations, it is still an open issue to collect more data and to investigate the topic further. The continuation of the study will provide additional information regarding the pre-earthquake variations of radon in soil and the prospects of the related analysis |
| 4. The findings are compatible with a SOC phase characteristic of generation of earthquakes. |
References
|
Figures at a glance
 |
 |
 |
 |
 |
| Figure 1 | Figure 2 | Figure 3 | Figure 4 | Figure 5 |
 |
 |
 |
 |
| Figure 6 | Figure 7 | Figure 8 | Figure 9 |
Relevant Topics
- Atmosphere
- Atmospheric Chemistry
- Atmospheric inversions
- Biosphere
- Chemical Oceanography
- Climate Modeling
- Crystallography
- Disaster Science
- Earth Science
- Ecology
- Environmental Degradation
- Gemology
- Geochemistry
- Geochronology
- Geomicrobiology
- Geomorphology
- Geosciences
- Geostatistics
- Glaciology
- Microplastic Pollution
- Mineralogy
- Soil Erosion and Land Degradation
Recommended Journals
Article Tools
Article Usage
- Total views: 14508
- [From(publication date):
January-2015 - Apr 02, 2025] - Breakdown by view type
- HTML page views : 9919
- PDF downloads : 4589
