Lipid Profile and BMI Correlations in Iraqi Patients: Implications for Cardiovascular Risk
Received: 17-Nov-2023 / Manuscript No. jomb-23-120418 / Editor assigned: 20-Nov-2023 / PreQC No. jomb-23-120418 (PQ) / Reviewed: 04-Dec-2023 / QC No. jomb-23-120418 / Revised: 11-Dec-2023 / Manuscript No. jomb-23-120418 (R) / Published Date: 18-Dec-2023 DOI: 10.4172/jomb.1000186
Abstract
In this study, lipid profiles and body mass indices (BMI) were examined in persons from Iraq with various clinical diagnoses, including diabetes, diabetes, and ischemic heart disease (IHD), and patients with IHD alone. Healthy volunteers with a comparable BMI and age made up the control group. The National Diabetes Center, Al-Karama Teaching Hospital, and Al-Yarmouk Teaching Hospital’s outpatient clinics served as the source of patients. The aim of this study was to examine the lipid profiles and body mass indices (BMI) of Iraqi persons with various clinical diagnoses, including diabetes, diabetes, and ischemic heart disease (IHD), and patients with IHD alone. The study aimed to contrast these profiles and BMI measures with those of a control group of healthy volunteers with comparable BMI and age. The researcher sought to learn more about potential relationships between these variables and certain medical disorders by examining the lipid profiles and BMI of people with various clinical diagnoses. The study’s goal may have been to investigate any possible links or patterns that may have resulted from the analysis and how lipid profiles and BMI are affected by diabetes, IHD, or their combination. After a 12-hour fasting the previous night, blood was drawn from each participant to establish their lipid profile using enzymatic methods. In comparison to the control group, Group III (IHD patients) had significantly higher baseline LDL cholesterol (LDL-c) readings. At baseline, group I’s (diabetes patients) LDL-c levels were significantly greater than the controls. Group III had considerably lower HDL cholesterol (HDL-c) values. Compared to controls, every patient group’s VLDL cholesterol (VLDL-c) blood levels were noticeably greater. The LDL-c/HDL-c ratios and atherogenic indices were considerably higher in all patient groups. The researcher adopted a controlled approach to compare the lipid profiles and BMI of the patient groups with the control group. They divided the 75 Iraqi patients into three groups based on their clinical diagnoses: Group I was made up of 25 patients with Type 2 diabetes mellitus (D.M.), Group II was made up of 25 people with Type 2 diabetes mellitus and ischemic heart disease (IHD), and Group III was made up of 25 people with IHD alone. These groups were chosen from patients utilizing the National Diabetes Center, Al-Karama Teaching Hospital, and Al-Yarmouk Teaching Hospital’s outpatient clinics. In Iraqi patients, particularly those with IHD, this study revealed atherogenic risk and dyslipidemic tendencies. In order to reduce these individuals’ risk of cardiovascular diseases, the findings highlight the necessity of managing their obesity and dyslipidemia. Novel medications must be investigated more thoroughly, involving larger sample numbers and longitudinal follow-up to improve lipid profiles and reduce cardiovascular risk.
Keywords
Body mass index; Cardiovascular risk; Obesity; Dyslipidemia
Introduction
Obesity, dyslipidemia, and hyperglycemia are all quite common. Diverse analyses have shown contradictory dyslipidemic patterns, as seen below: 80%, 58%, 68%, 5%, and 17-6%, respectively, were the prevalence rates for type 2 diabetes mellitus for hypercholesterolemia, hypertriglyceridemia, hyper-LDL-cholesterolemia, and low HDLcholesterolemia, according to data obtained at Kuala Lumpur Hospital. Having a weight problem with abdominal obesity, the risk of CAD increases [1,2]. Individuals who are obese have a mortality risk from cardiovascular disease that is 90% higher in individuals with severe obesity and about 50% higher in people of medium weight. According to current information and epidemiological studies, elevated T.G. levels represent a substantial independent risk factor. Higher T.G. was thought to increase the risk of CAD by cooperating with other lipid abnormalities, according to a different study hypothesis. Obesity is defined by Gonzalez MC as having a body mass index of more than 30 kg/m2. Quetelet’s index is calculated as weight in kilograms divided by height in square meters [3].
Materials and Techniques
Patients and control
In this quantitative study, the researcher aimed to collect numerical data and statistically analyze the relationships between lipid profiles, body mass index (BMI), and various clinical diseases. By contrasting the lipid profiles and BMI of three patient groups with a control group, they used a controlled technique to achieve this. The 75 Iraqi patients were separated into three groups based on their clinical diagnosis. Type 2 diabetes mellitus (D.M.) was present in 25 of the patients in Group I, Type 2 diabetes mellitus with ischemic heart disease (IHD) was present in 25 of the patients in Group II, and IHD was present in 25 of the patients in Group III. The National Diabetes Center, Al- Karama Teaching Hospital, and Al-Yarmouk Teaching Hospital all have outpatient clinics where these individuals were chosen. Twelve healthy volunteers who were comparable to the patients in terms of age and BMI were also chosen by the researcher to create a baseline for comparison. As the control group, these volunteers were used. The participants had been off their medications for more than three months before enrolment and were in good health.
Sample collection (data analysis description to be placed here)
The researcher used a controlled design to compare the lipid profiles and BMI of the patient groups with the control group. They divided the 75 Iraqi patients into three groups based on their clinical diagnoses. The collected blood samples underwent a series of procedures for data analysis. After fasting for twelve hours, five milliliters of venous blood were drawn from each patient and control subject. This process was carried out for the three patient groups before the initiation of therapy, followed by monthly assessments of the same parameters. In the case of group three patients who experienced a myocardial infarction (MI) episode lasting less than three months, the assessment of their lipid profile was postponed for three months. The blood samples were collected in clean, unadorned tubes and thickened for 30 minutes. Subsequently, the centrifuged serum was transferred to clear tubes to quantify glucose, cholesterol, HDL-c (high-density lipoprotein cholesterol), and T.G. (triglycerides). These parameters were of interest for analyzing the lipid profiles. The tubes were maintained at four °C for seven days to preserve the samples. This ensured the stability and integrity of the collected serum for subsequent laboratory analysis of the lipid profile components. The data obtained from the analysis of these blood samples would provide the necessary information to compare and evaluate the lipid profiles of the patient groups and control groups lipid profiles. The measured glucose, cholesterol, HDL-c, and T.G. values would be subjected to further statistical analysis to explore any significant differences or patterns among the groups at baseline and during the monthly follow-up assessments.
Results
Determination of lipid profile
An enzymatic technique was used to assess serum cholesterol using the cholesterol Kit PAP 100. By employing the enzymatic technique, the T.G. kit PAP 150 tested serum T.G. Using the cholesterol enzyme reagent, it is possible to identify HDL from the cholesterol and phospholipids in the supernatant that results from centrifugation. The absorbance was measured at 500 nm and after 5 minutes at 37°C [4,5]. Using the Friedwald Equation, low-density lipoprotein-cholesterol (LDL-c) was calculated. In mg/100 ml, all measurements were given. Mean SD was used to express statistical analyses. The difference in the measured parameters’ means was investigated using the students’ T-test-r, or Pearson correlation. A P-value of less than 0.05 was considered significant, according to Obilor and Amadi [6].
Patients before treatment
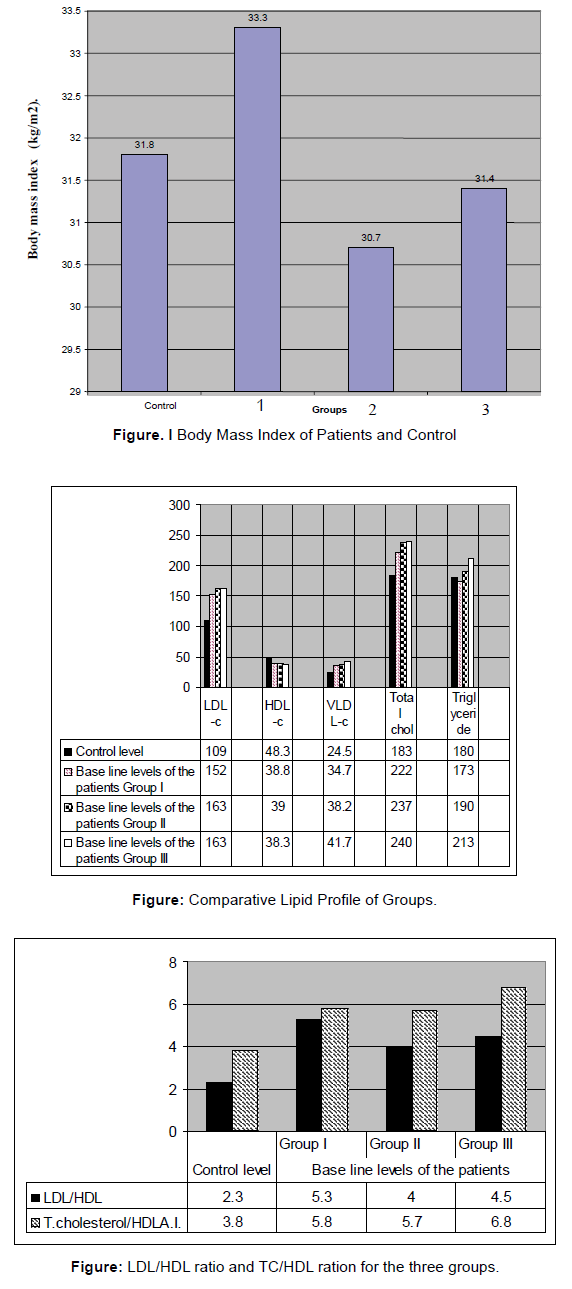
Mean ± S.D. of body mass index (BMI) and age of different groups of patients and control: The information in the Table 1. and the Figure 1. below demonstrated that the patients’ BMI and age values were not statistically different from those of the control group (p > 0.05).
| Variables | Control level | Baseline levels of the patients | Total of all group | ||
|---|---|---|---|---|---|
| Group 1 | Group 2 | Group 3 | |||
| BMI (kg/m2) | 31.8 ± 7.4 n=12 |
33.3♦ ± 5.7 n=25 |
30.7♦ ± 3.8 n=25 |
31.4♦ ± 3.1 n=25 |
32.1♦ ± 4.4 |
| Age (years) | 50 ± 9.7 n=12 |
48♦ ± 7.9 n=25 |
55.3♦ ± 6.9 n=25 |
47.7♦ ± 5.4 n=25 |
50.25♦ ± 7.4 |
Table 1. Mean ± S.D. of Body Mass Index (BMI) and Age of different groups of patients and control.
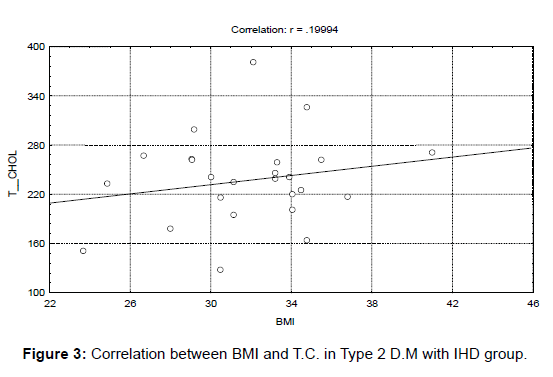
According to the data in the table above and the graphic that goes along with it, there were no statistically significant variations in the BMI and age values between the patients and the control group (p > 0.05). With a p-value of 0.005, further examination of Table 1 and the graphs indicates that Group III’s baseline LDL-c level (163.3 mg/100 ml) increased significantly compared to the control level (109 mg/100 ml). The baseline LDL-c level in Group I was likewise significantly higher than the control level (152 mg/100 ml). Only Group III showed a discernible drop in HDL concentration (38.3 mg/100 ml) compared to the control level (48.3 mg/100 ml).
In addition, serum VLDL-C levels significantly rose in each patient group compared to the control level (24.5 mg/100 ml), reaching an average of 34.7 mg/100 ml in each group. These distinctions, however, were not statistically significant (p > 0.05). Comparing the LDL-C/HDL ratio to the control level, Group I showed a significant rise (p 0.005), Group II showed a significant increase (p 0.05), and Group III showed a large increase (p 0.05). (2.3). In addition, all three groups (Groups I, II, and III) showed a highly significant rise (p 0.005) in the atherogenic index when compared to the baseline level (3.8), with values of 5.8, 5.7, and 6.8, respectively.
Correlation In Type 2 D.M. with IHD Group
There is a link between BMI and LDL-c. The graph below (r=0.17309) illustrates the substantial positive relationship between BMI and LDL-c in type 2 diabetes mellitus with the IHD group. This study found a substantial positive relationship between BMI and LDL-c (low-density lipoprotein cholesterol) in this study’s Type 2 Diabetes Mellitus with Ischemic Heart Disease group. This shows that those with ischemic heart disease and Type 2 diabetes mellitus had higher BMI values and LDL-c levels (Figure 2).
Correlation between body mass index and total cholesterol
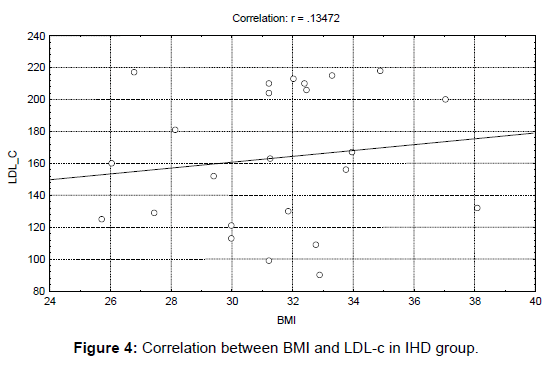
A positive correlation was found between BMI and total cholesterol(r=0.19994), as shown in the figure below. The relationship between Body Mass Index (BMI) and Total Cholesterol is positively correlated, as shown by the correlation coefficient of 0.19994. As a result, there is a correlation between rising BMI and rising total cholesterol levels. Therefore, people with higher BMI values are more likely to have higher total cholesterol levels (Figure 3).
Correlation between BMI and LDL in IHD group
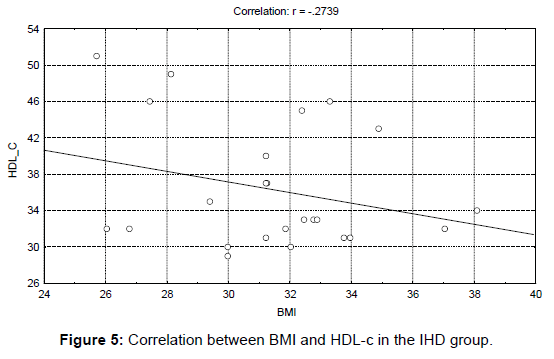
The picture below illustrates the link between BMI and LDL-c in the IHD group (r=0.13472). Body Mass Index (BMI) and LDL-c (lowdensity lipoprotein cholesterol) in the IHD (ischemic heart disease) group appear to be positively correlated, according to the correlation coefficient of 0.13472. This suggests that within the IHD group, LDL-c values tend to rise when BMI rises. In the IHD group, those with higher BMIs are more likely to have higher LDL-c levels (Figure 4).
Correlation between BMI and HDL IHD group
As shown in the picture below, there was a negative association between BMI and HDL-c in the IHD group ((r=-0.2739). The correlation coefficient of-0.2739 indicates a negative association between Body Mass Index (BMI) and HDL-c (high-density lipoprotein cholesterol) in the IHD (Ischemic Heart Disease) group. Thus, the HDL-c values within the IHD group tend to decline as BMI rises. In the IHD group, those with higher BMI values are thus more likely to have lower levels of HDL-c, sometimes called “good” cholesterol (Figure 5).
Correlation between BMI and VLDL in IHD group
The IHD group had a significant relationship between BMI and VLDL-c (r=0.10186), as shown in the graph below. The Body Mass Index (BMI) and VLDL-c (very low-density lipoprotein cholesterol) are positively correlated with IHD (ischemic heart disease), according to the correlation value of 0.10186. This suggests that the VLDL-c levels within the IHD group tend to rise as BMI increases. In other words, those in the IHD group with higher BMI values are more likely to have higher levels of VLDL-c, a cholesterol linked to an elevated risk of cardiovascular disease.
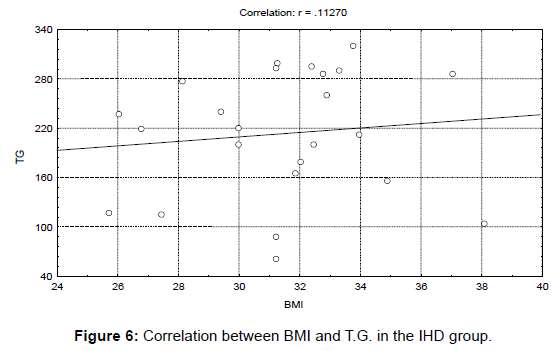
Correlation between BMI and T.G. in IHD group
The graph below shows the BMI and triglyceride levels in the IHD group to have a positive connection (r=0.11270). The Body Mass Index (BMI) and triglyceride levels in the IHD (Ischemic Heart Disease) group appear to be positively correlated, according to the correlation coefficient of 0.11270. This suggests that the triglyceride levels within the IHD group will likely rise along with rising BMI. To put it another way, people in the IHD group with higher BMI values are more likely to have higher blood levels of triglycerides, a form of fat that can raise the risk of cardiovascular disease (Figure 6).
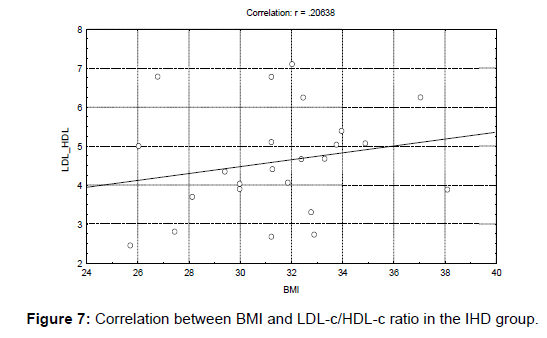
Correlation between BMI and LD L/HDL ratio in IHD group
The IHD group had a significant relationship (r=0.20638) between BMI and LDL/HDL ratio. The correlation coefficient of 0.20638 indicates a positive relationship between Body Mass Index (BMI) and LDL/HDL ratio in the IHD (Ischemic Heart Disease) group. This indicates that the LDL/HDL ratio has a propensity to rise in the IHD group when BMI rises. This means that persons in the IHD group with higher BMI values are more likely to have a greater ratio of LDL (low-density lipoprotein cholesterol) to HDL (high-density lipoprotein cholesterol), a marker linked to an increased risk of cardiovascular disease (Figure 7).
Discussion
As observed, the BMI and age distributions of the patients and controls used in this experiment are comparable. In line with this tendency, the patients and the control are middle-aged and obese. Most patients had a BMI of more than 30 kg/m2, as defined by the WHO classification [7]. This offers a sense of the mortality ratio, the relative risk of fatal coronary heart disease, and non-fatal MI since it is consistent with several studies demonstrating that mild to moderate overweight increases the risk of CHD. Higher LDL/HDL ratio and atherogenic index indicate that the dyslipidemic pattern in all groups was conducive to accelerated atherogenesis [8]. Amen et al. [9] hypothesize that HDL’s anti-inflammatory, antioxidant, and anti-atherogenic benefits have been weakened due to the significant reduction in HDL-c level shown in Group III of the present research. However, group I and II HDL-c levels remained stable, consistent with past studies [10]. According to the above results, all research groups showed a combination of borderline and high-risk blood values, indicating familial mixed dyslipidemia or diabetes. Increasing the incidence of dyslipidemia and diabetes, and obesity increases the risk of CAD [11]. According to this study’s findings, there were positive correlations between BMI and LDL, T.C., VLDL, and T.G. Another finding was that BMI and the LDL/HDL ratio were positively correlated, although the HDL-c connection was negative. However, a favorable relationship exists between BMI and FBG [12]. The above results concur with previous research, demonstrating that visceral adipose tissue’s anatomical location and metabolic characteristics may affect the atherogenic metabolic profile.
Limitations
When analyzing the results, it’s important to consider the research constraints mentioned in the section. These limitations include:
1. Limited Sample Size: The experiment included only 12 healthy volunteers and 25 patients, 25 in each group. The results’ generalizability and statistical power would increase with a larger sample size.
2. Selection Bias: The text uncertainly presents the participant selection procedure. For this to be successful, the patients and the control group must fairly represent the population under study. If the participant selection process wasn’t random or if certain criteria were used, it might introduce bias and impair the generalizability of the findings.
3. The research doesn’t say whether it considered possible confounding variables like diet, exercise, or medication usage. These factors could impact the lipid profile and raise the level of result variability.
4. Lack of Longitudinal Design: Most of the study is crosssectional, with measures taken at baseline and every month after that. A longitudinal design would allow researcher to learn more about lipid profile changes and how they relate to clinical diagnoses, BMI, and other factors by obtaining data over a longer period.
5. Limited Follow-up: The research only refers to extra steps for group three’s lipid profile calculation after three months if there was no MI incident. A longer-term follow-up would be necessary to determine how long the observed lipid profile alterations would last and their impact on clinical outcomes.
6. Single-Center Study: In Iraq, a diabetic center and a few specific hospitals were the study sites. It might be challenging to extrapolate the findings to other populations or contexts since the prevalence and consequences of diabetes, IHD, and dyslipidemia can change by region and ethnicity.
7. Restricted Set of Measures: The study’s primary emphasis was lipid profile variables (glucose, cholesterol, HDL-c, and T.G.) and their relationship to BMI. Other important variables like blood pressure, inflammatory markers, or genetic factors weren’t considered. A more in-depth examination may better explain the factors impacting dyslipidemia and atherosclerosis.
Conclusion
The research was conducted on Iraqi patients separated into three groups based on their clinical diagnoses (diabetic, diabetic with IHD, and just IHD patients) to analyze the lipid profile and its connection with BMI. The findings of the research indicate several significant findings and repercussions.
First, the patient and control groups’ BMI and age trends indicated that they were both middle-aged and obese. This research, consistent with the WHO categorization, highlights the elevated risk of coronary heart disease (CHD) linked with obesity, even in people who are slightly to moderately overweight. The dyslipidemic patterns seen in all patient groups are consistent with elevated LDL/HDL ratio and atherogenic index as indications of increased atherogenesis. Additionally, HDL-c levels in Group III were much lower, indicating a potential loss of HDL’s anti-inflammatory, antioxidant, and anti-atherogenic effects. But, in line with past studies, the findings of Groups I and II did not demonstrate a decline in HDL-c levels. These results suggest that the study groups had familial combined or diabetes-related dyslipidemia [13].
The correlations between BMI and LDL, total cholesterol, VLDL, and triglycerides were positive. In contrast, those between BMI and HDL were shown to be negatively correlated in the IHD group. According to these results, there is a connection between lipid abnormalities and obesity, and visceral adipose tissue and its metabolic characteristics may contribute to creating an atherogenic metabolic profile. Most study findings point to elevated atherogenic risk and dyslipidemic tendencies in patient populations, particularly those with IHD. The results highlight the need to manage obesity and dyslipidemia in these people to lower the risk of cardiovascular consequences, including coronary artery disease [14]. Even so, the study contributes to our understanding of dyslipidemia and atherogenesis by providing important information on the lipid profile and its relationship to BMI in the patient population from Iraq.
References
- Gonzalez MC, Correia MIT, Heymsfield SB (2017) A requiem for BMI in the clinical setting.Curr opin clin nutr metab care20: 314-321.
- Bloomfield J, Fisher MJ (2019) Quantitative research design.J Austr Rehabilitation Nurses Assoc 22: 27-30.
- Mustafa WW, Moahammed SS, Al-Jewari WM, Abdulrahman HS, Hussain SA, et al. (2020) Association of visceral adiposity index, lipid profile, and serum leptin with glucose intolerance risks in Iraqi obese patients: A cross-sectional study.J Pharm Bioallied Sci12: 468-474.
- Obilor EI, Amadi EC (2018) Test for significance of Pearson's correlation coefficient.Internat J Inno Math Stat Ener Poli6: 11-23.
- Hedayatnia M, Asadi Z, Zare-Feyzabadi R, Yaghooti-Khorasani M, Ghazizadeh H, et al. (2020) Dyslipidemia and cardiovascular disease risk among the MASHAD study population.Lipids health dis19: 1-11.
- Islam MA, Amin MN, Siddiqui SA, Hossain MP, Sultana F, et al. (2019) Trans fatty acids and lipid profile: A serious risk factor to cardiovascular disease, cancer and diabetes.Diabetes Metab Syndr 13: 1643-1647.
- Amen SO, Baban ST, Yousif SH, Hawez AH, Baban ZT, et al. (2020) Prevalence of the most frequent risk factors in Iraqi patients with acute myocardial infarction.Med J Babylon17: 6-18.
- Miao L, Yin RX, Huang F, Chen WX, Cao XL, et al. (2017) The effect of MVK-MMAB variants, their haplotypes and G× E interactions on serum lipid levels and the risk of coronary heart disease and ischemic stroke.Oncotarget8: 72801.
- Ormazabal V, Nair S, Elfeky O, Aguayo C, Salomon C, et al. (2018) Association between insulin resistance and the development of cardiovascular disease.Cardiovasc diabetol17: 1-14.
- Su L, Fu J, Sun S, Zhao G, Cheng W, et al. (2019) Effects of HIIT and MICT on cardiovascular risk factors in adults with overweight and/or obesity: A meta-analysis.PloS one14: e0210644.
- Umer A, Kelley GA, Cottrell LE, Giacobbi P, Innes KE, et al. (2017) Childhood obesity and adult cardiovascular disease risk factors: a systematic review with meta-analysis.BMC public health17: 1-24.
- Yan S, Tian Z, Li M, Li B, Cui W, et al. (2019) Effects of probiotic supplementation on the regulation of blood lipid levels in overweight or obese subjects: a meta-analysis.Food & funct10: 1747-1759.
Indexed at, Google Scholar, Crossref
Indexed at, Google Scholar, Crossref
Indexed at, Google Scholar, Crossref
Indexed at, Google Scholar, Crossref
Indexed at, Google Scholar, Crossref
Indexed at, Google Scholar, Crossref
Indexed at, Google Scholar, Crossref
Indexed at, Google Scholar, Crossref
Citation: Hassan MS (2023) Lipid Profile and BMI Correlations in Iraqi Patients:Implications for Cardiovascular Risk. J Obes Metab 6: 186. DOI: 10.4172/jomb.1000186
Copyright: © 2023 Hassan MS. This is an open-access article distributed underthe terms of the Creative Commons Attribution License, which permits unrestricteduse, distribution, and reproduction in any medium, provided the original author andsource are credited.
Share This Article
Open Access Journals
Article Tools
Article Usage
- Total views: 1059
- [From(publication date): 0-2023 - Apr 21, 2025]
- Breakdown by view type
- HTML page views: 843
- PDF downloads: 216
