Research Article Open Access
Leptin and Metabolic Syndrome in Obese Pediatric Population: A Crosssectional Study
| Teodoro Durá-Travé1,2,3*, Fidel Gallinas-Victoriano2, Lloreda Martín L1, Chueca Guindulain MJ2,3 and Berrade-Zubiri S2,3 | |
| 1Department of Pediatrics, School of Medicine, University of Navarra, Pamplona, Spain | |
| 2Department of Pediatrics, Navarra Hospital Complex, Pamplona, Spain | |
| 3Department of Pediatrics, Instituto de Investigación Sanitaria de Navarra (IdisNA), Spain | |
| *Corresponding Author : | Durá-Travé T Department of Pediatrics, Navarra Hospital Complex Avenue Irunlarrea, 431008 Pamplona, Spain Tel: 34-8484-22563 Fax: 34-8484-299-24; E-mail: tduratra@cfnavarra.es |
| Received: February 25, 2016 Accepted: April 18, 2016 Published: April 21, 2016 | |
| Citation: Durá-Travé T, Gallinas-Victoriano F, Martín L L, Guindulain CMJ, Berrade-Zubiri S (2016) Leptin and Metabolic Syndrome in Obese Pediatric Population: A Cross-sectional Study. J Obes Weight Loss Ther 6:305. doi:10.4172/2165-7904.1000305 | |
| Copyright: © 2016 Durá-Travé T, et al. This is an open-access article distributed under the terms of the Creative Commons Attribution License, which permits unrestricted use, distribution, and reproduction in any medium, provided the original author and source are credited. | |
Visit for more related articles at Journal of Obesity & Weight Loss Therapy
Abstract
Background/Objectives: Childhood obesity represents the most relevant nutritional disorder in our environment. This study examines the prevalence of metabolic syndrome in an obese pediatric population and its relation to serum Leptin concentrations. Subjects/Methods: A cross-sectional clinical and metabolic study was accomplished in a group of 106 obese children (47 males and 59 females). Patients were classified in prepubertal group (Tanner stage I) and pubertal group (Tanner stages II–V). Results: Prevalence of insulin resistance (HOMA), hypertriglyceridemia, low high-density lipoprotein (HDL) and arterial hypertension (HTA) was 38.7, 45.3, 28.3 and 33.8% respectively. Metabolic syndrome prevalence (38%) was significantly higher in the pubertal group (38%) in relation to the prepubertal group (23.2%). There was a positive correlation between leptin and BMI (r=0.529), leptin and HOMA indexes (r=562) and Leptin and triglycerides (r=0,314). In addition, there was a positive correlation between HOMA indexes and triglycerides (r=596). Conclusions: Clinical and metabolic disorders associated to obesity and related to the so-called metabolic syndrome are already present in pediatric population. Leptin could play an important role in the etiopathogenesis of the metabolic syndrome.
| Keywords |
| Leptin; Metabolic syndrome; Childhood obesity; Insulin resistance; Puberty; Triglycerides; Blood pressure |
| Introduction |
| Childhood obesity represents the most relevant nutritional disorder in our environment [1,2]. It usually initiates at early stages in life, when child feeding depends –almost exclusively- on feeding habits and preferences in a family setting; it is subsequently exacerbated (by the time of school attendance and/or adolescence), probably in relation to the adoption of unhealthy feeding habits and lifestyle [3,4]. |
| Additional studies –except for uncommon situations such as endocrine, genetic or metabolic pathologies, which justify excess body weight-, are used for the diagnosis and/or early detection of metabolic complications and, particularly, the metabolic syndrome. This syndrome is characterized by a cluster of symptoms associated to obesity, such as insulin resistance, arterial hypertension and dyslipidemia, and its interest lies in the high predictive value for cardiovascular disease and type 2 diabetes in adulthood, especially when it is already present in school children and/or adolescents [5-9]. Even when the International Diabetes Federation (IDF) [10] refers to the inability for diagnosis in school age, epidemiological data allow suspecting that metabolic syndrome or its components are already present at early stages [11-14]. |
| Leptin is an adipocytokine that, in addition to multiple neuroendocrine functions, has a role in the regulation of energy balance, as well as in carbohydrate and lipid metabolism and arterial pressure regulation. In this way, many authors have suggested that leptin might be involved in the etiopathogenesis of metabolic syndrome [15-17]. |
| The aim of this work is to determine the prevalence of metabolic syndrome and its relation to serum leptin concentrations in a group of obese pediatric population. |
| Methods |
| Patients: A clinical assessment and metabolic study was accomplished in all patients diagnosed with obesity who attended follow-up consultation within the year 2014. Clinical evaluation was conducted in one of the three offices of the Pediatric Endocrinology Unit of the Navarra Hospital Complex. Pubertal stage was determined in each patient according to Tanner’s criteria, and patients were classified in two different groups: prepubertal group (Tanner stage I) and pubertal group (Tanner stages II–V). |
| All those patients with personal history of endocrine disease, malformation syndromes or iatrogenic obesity (drug treatments) were excluded. |
| The metabolic syndrome was defined by modified Cook’s criteria [18] as the manifestation of at least three of the following features: low HDL-cholesterol (<40 mg/dl), hypertriglyceridemia (TG>110 mg/dl), obesity, arterial hypertension and insulin resistance. |
| Clinical assessment: The assessment of weight and height was accomplished in underwear and barefoot. Weight was measured using an Año-Sayol scale, with a reading interval 0-120 kg and precision 100 g, and height was measured using a Holtain wall stadiometer ranging 60-210 cm, and precision 0.1 cm. Body mass index (BMI) was calculated according to the corresponding formula: weight (kg)/height2 (m). Values of Z-score for BMI were calculated using a Nutrition application (Aplicación Nutricional) program from the Spanish Society of pediatric Gastroenterology, Hepatology and Nutrition (available at http://www.gastroinf.es/nutritional/). The inclusion criterion was BMI (Z-score) values exceeding +2,0 (97 percentile) by age and sex according to growing charts from Ferrández et al. (Centro Andrea Prader, Zaragoza 2002) [19]. |
| Blood pressure (BP) was measured in the right arm with the patient in the supine position using Visomat comfort 20/40 (Roche Diagnostics Inc.) digital blood pressure monitor, recording the lowest of three measurements. Arterial hypertension (HTA) was considered when systolic and/or diastolic pressure was equal to or higher than 95th percentile by age, sex and height from the American reference charts (National high blood pressure Program in Children and Adolescents) [20]. |
| The institutionalized program for Child Care in the Community of Navarre (Comunidad Foral de Navarra, Spain) includes periodic health examinations at ages 1, 2, 3, 4, 6, 8, 10 and 12 years. The anthropometric measurements (weight and height) are recorded in the corresponding clinical history. This record has allowed the registration of the age of onset for obesity and the time of evolution at the moment of the examination. |
| Metabolic study: Plasma concentrations for glucose, insulin, triglycerides, total cholesterol (TC), high-density lipoprotein cholesterol (HDL), low-density lipoprotein cholesterol (LDL) and leptin were measured under basal fasting conditions using standardized methodologies. |
| In order to determine insulin resistance, the HOMA (homeostasis model assessment) indexes were calculated from fasting glucose and insulin concentrations (glucose levels in mmol × insulin in μUml/L/22.5). Insulin resistance was considered when HOMA value was equal to or higher than 3.8 [21]. |
| Statistical analysis |
| Results are displayed as percentages (%) and means (M) with corresponding standard deviations (SD). Statistical analysis (descriptive statistics, student’s T and Chi square test, Pearson’s correlation) was done using the Statistical Packages for the Social Sciences version 20.0 (Chicago, Illinois, USA). Statistical significance was assumed when p value was lower than 0.05. |
| Results |
| The sample of patients consisted of 106 patients (47 males and 59 females). The prepubertal group included 56 patients (22 males and 34 females) and the pubertal group included 50 patients (25 males and 25 females). |
| Table 1 lists and compares the clinical features in both groups according to pubertal stage and sex. Within the pubertal group, the average values for age of onset, age at examination, years of evolution and systolic blood pressure were significantly higher (p<0.05); within the prepubertal group, BMI values (Z-score) at examination were higher (p<0.05). There were no statistically significant differences among the average values of diastolic blood pressure between the different groups. The average BMI values (Z-score) in pubertal group were significantly higher (p<0.05) in males. Finally, within pubertal group, the average values for age of onset (obesity) were significantly lower (p<0.05) in females. |
| Table 2 displays and compares the average values for the results of blood tests among the different groups according to pubertal stage and sex. Within the pubertal group, average values for insulin were significantly higher (p<0.05) with respect to the prepubertal group. The average values for HDL-C within pubertal group were significantly higher (p<0.05) in females, and the average values for HOMA and leptin within the pubertal group were significantly higher (p<0.05) in males. |
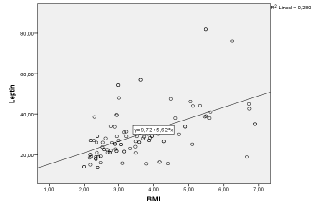
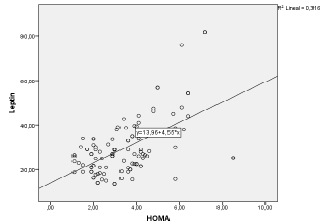
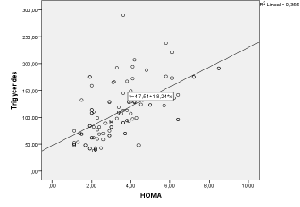
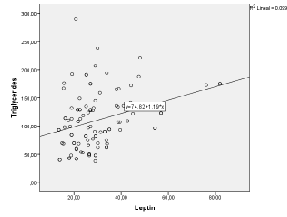
| There was a significant positive correlation (p<0.05) between leptin plasma levels and BMI values (r=0.529) (Figure 1). In addition, there was a significant positive correlation between leptin plasma levels and HOMA indexes (r=0.562) (Figure 2). There was also a significant positive correlation (p<0.05) between HOMA indexes and plasma concentrations of triglycerides (r=0.596) (Figure 3), as well as with age at examination (r=0,207). And there was also a significant positive correlation (p<0.05) between leptin plasma levels and plasma concentrations of triglycerides (r=0.314) (Figure 4). |
| Table 3 presents and compares the percentage values for the different clinical and metabolic parameters used as constituents of the metabolic syndrome in both groups. The percentage of patients who showed systolic blood pressure values higher than 95th percentile for the applied reference were significantly higher in the pubertal group (p<0.05). There were no statistically significant differences among both groups regarding the percentage of patients who present HOMA index values higher than 3.8, plasma triglycerides higher than 110 mg/ dl, HDL-C values lower than 40 mg/dl and diastolic blood pressure values higher than 95th percentile for the applied reference charts. Within the pubertal group the metabolic syndrome prevalence (38%) was significantly higher (p<0.05) with respect to the prepubertal group (23.2%). |
| Discussion |
| The prevalence of metabolic syndrome within the whole sample was 30.2%, being significantly higher in the pubertal group (38%), in contrast to the prepubertal group (23.2%). The comparison of these results with those described by other authors reveals that the prevalence found is similar than references from Cook (28.7%) [18], Cruz (30%) [22], Weiss (38.7%) [23] Viner (30%) [24] and Ferranti (31.2%) [25] In obese UK or American children and adolescents, although slightly higher than references from Olza (16.8%) [13], Lopez-Capapé (18%) [26] and Tapia (18.6%) [27] In Spanish obese pediatric population. Nevertheless, the contrast of the rate of prevalence from different Studies has a relative value, since the criteria applied are different, and even different cut points for each component of MS are used [28]. |
| The IDF considers fat distribution and, concretely, central or visceral obesity-which is defined by abdominal perimeter- as a “sine qua non” criterion for the diagnosis of metabolic syndrome due to its high predictive value for cardiovascular disease in adult life [29,30]. However, there is some controversy regarding the adequacy of its use as a main and/or necessary diagnostic criterion [31]; in fact, recent studies conducted in pediatric population have used both abdominal perimeter [18,22,27,32] and BMI [23,24,26,33] interchangeably. In this case, the inclusion criterion was BMI value (Z- score) higher than +2.0 (97th percentile) by age and sex according to the growing charts from Ferrández et al. (Centro Andrea Prader, Zaragoza) [19]. |
| Insulin resistance, as several authors have highlighted [24,26] has been a very frequently noted metabolic disorder in the population studied. It is worth indicating that, when Reaven [34] described the syndrome X, he considered insulin resistance as the determining pathophysiological factor and, in fact, the WHO included it as main and necessary criterion in order to diagnose the metabolic syndrome [35]. However, the diagnosed criteria subsequently proposed by the National Cholesterol Education Programs Adult Treatment Program III [36] as well as by the IDF [9] opted for a “lipid centric” theory, with special focus on dyslipidemia and/or fat distribution. |
| Even though several criteria have been used to evaluate peripheral insulin sensitivity and/or alterations in glucose metabolism (fasting glucose, glycemia after an oral glucose tolerance test, fasting insulin levels, etc.), the use of a mathematical model called homeostasis model assessment (HOMA) as a criterion for insulin resistance has been widely contrasted as an early disorder in glucose homeostasis (hyperinsulinemia with euglycemia). In this case, despite the application of a quite restrictive cut point [21], insulin resistance was already detected in thirty nine per cent of the patients included in the study. In addition, the existing correlation between the HOMA indexes and the age of the patients at the moment of examination suggests that the onset of this metabolic comorbidity associated to obesity is related to hormonal changes concomitant with puberty rather than to the evolution time of obesity. |
| The situation of insulin resistance usually involves a disturbance in lipid profile by stimulating lipolysis and, therefore, an increase in plasma exchange of fatty acids that, at the same time, stimulates the hepatic triglyceride synthesis. This explains its correlation with the HOMA index of the patients. In addition, the concentration of low density lipoproteins is usually in normal range while the concentration of high density lipoproteins is usually low, being this considered as a side effect of hypertriglyceridemia [37-39]. Dyslipidaemia observed in patients with insulin resistance corresponded with the situation expected in this metabolic condition. Furthermore, hyperinsulinemia causes water and sodium retention and activates the sympathetic nervous system, contributing to the development of hypertension. |
| Leptin participates directly in the regulation of energy homeostasis through an anorectic effect and the increase of thermogenesis. |
| Plasma concentrations reflect the reserve of organic fat and are considered as a predictive factor for insulin resistance [40]. This would explain, on one hand, the existing correlation between plasma concentrations and BMI, and, on the other hand, the correlation with the HOMA index in the patients included in this work. In addition, Leptin stimulates lipolysis in adipocytes and, consequently, contributes to dyslipidaemia (there was a correlation with Leptin plasma levels and triglycerides); it also stimulates angiogenesis and/or endothelial dysfunction and would explain, to a great extent, the development of hypertension, which is frequently associated to obesity [15]. |
| As a conclusion, we remark the finding of clinical and metabolic disorders associated to obesity and related to the so-called metabolic syndrome, which, to a great extent, are already present in pediatric population. In the same way, leptin serum levels could play an important role in the etiopathogenesis of metabolic syndrome and/or comorbidities that are associated to obesity. |
References
- Ogden CL, Flegal KM, Carroll MD, Johnson CL (2002) Prevalence and trends in overweight among US children and adolescents, 1999-2000. JAMA 288: 1728-1732.
- Tzotzas T, Krassas GE (2004) Prevalence and trends of obesity in children and adults of South Europe. PediatrEndocrinol Rev 1: 448-454.
- Durá-Travé T, Olascoaga JH, Torres IG, Navarra GCD (2012) Overweight among children in Navarra (Spain) and its impact on adolescence. Med Clin (Barc) 138: 52-56.
- Travé TD, Gallinas Victoriano F, de Navarra GC (2013) Natural evolution of excess body weight (overweight and obesity) in children. AnPediatr (Barc) 79: 300-306.
- Srinivasan SR, Myers L, Berenson GS (2002) Predictability of childhood adiposity and insulin for developing insulin resistance syndrome (syndrome X) in young adulthood: the Bogalusa Heart Study. Diabetes 51: 204-209.
- Bao W, Srinivasan SR, Wattigney WA, Berenson GS (1994) Persistence of multiple cardiovascular risk clustering related to syndrome X from childhood to young adulthood. The Bogalusa Heart Study. Arch Intern Med 154: 1842-1847.
- Freedman DS, Khan LK, Dietz WH, Srinivasan SR, Berenson GS (2001) Relationship of childhood obesity to coronary heart disease risk factors in adulthood: the Bogalusa Heart Study. Pediatrics 108: 712-718.
- Brambilla P, Lissau I, Flodmark CE, Moreno LA, Widhalm K, et al. (2007) Metabolic risk-factor clustering estimation in children: to draw a line across pediatric metabolic syndrome. Int J Obes (Lond) 31: 591-600.
- Yusuf S, Hawkwn S, Ounpuu S, Dans T, Avezum A, et al. (2004) Effect of potentially modifiable risk factors associated with myocardial infarction in 52 countries (the INTER-HEART study): case-control study. Lancet 364: 937-952
- Zimmet P, Alberti KG, Kaufman F, Tajima N, Silink M, et al. (2007) The metabolic syndrome in children and adolescents - an IDF consensus report. Pediatr Diabetes 8: 299-306.
- Freedman DS, Dietz WH, Srinivasan SR, Berenson GS (1999) The relation of overweight to cardiovascular risk factors among children and adolescents: the Bogalusa Heart Study. Pediatrics 103: 1175-1182.
- López-Capapé M, Alonso M, Colino E, Mustieles C, Corbatón J, et al. (2006) Frequency of the metabolic syndrome in obese Spanish pediatric Population. European Journal of Endocrinology 155:313-319
- Olza J, Gil-Campos M, Leis R, Bueno G, Aguilera CM, et al. (2011) Presence of the metabolic syndrome in obese children at prepubertal age. Ann NutrMetab 58: 343-350.
- Martos-Moreno GA, Gil-Campos M, Bueno G, Bahillo P, Bernal S, et al. (2014) Obesity associated metabolic impairment is evident at early ages: spanish collaborative study. NutrHosp30:787-793.
- Marti A, Martínez JA (1999) Leptin and body weight regulation.AnSistSanitNavar 22: 353-363.
- Moreno LA, Pineda I, Rodríguez G, Fleta J, Giner A, et al. (2002) Leptin and metabolic syndrome in obese and non-obese children. HormMetab Res 34: 394-399.
- Chu NF, Rimm EB, Wang DJ, Liou HS, Shieh SM (1998) Clustering of cardiovascular disease risk factors among obese schoolchildren: the Taipei Children Heart Study. Am J ClinNutr 67: 1141-1146.
- Cook S, Weitzman M,Auinger P, Nguyen M, Dietz WH (2003) Prevalence of a metabolic syndrome phenotype in adolescents: findings from the third National Health and Nutrition Examination Survey, 1988–1994. Arch PediatrAdolesc Med 157:821-827.
- Ferrández A, Baguer L, Labarta JL (2005) longitudinal study of normal Spanish children from birth to adulthood anthoprometric, pubertal, radiological and intellectual data. PediatrEndocr Rev 2:423-559.
- (1987) Report of the Second Task Force on Blood Pressure Control in Children--1987. Task Force on Blood Pressure Control in Children. National Heart, Lung, and Blood Institute, Bethesda, Maryland. Pediatrics 79: 1-25.
- Tresaco B, Bueno G, Pinerda I, Moreno LA, Garagorri JM, et al. (2005) Homeostatic model assessment (HOMA) index cut-off values to identify the metabolic syndrome in children. Biochem61:381-388
- Cruz ML, Weigensberg MJ, Huang TT, Ball G, Shaibi GQ, et al. (2004) The metabolic syndrome in overweight Hispanic youth and the role of insulin sensitivity. J ClinEndocrinolMetab 89: 108-113.
- Viner RM, Segal TY, Lichtarowicz-Krynska E, Hindmarsh P (2005) Prevalence of the insulin resistance syndrome in obesity. Arch Dis Child 90: 10-14.
- de Ferranti SD, Gauvreau K, Ludwig DS, Neufeld EJ, Newburger JW, et al. (2004) Prevalence of the metabolic syndrome in American adolescents: findings from the Third National Health and Nutrition Examination Survey. Circulation 110: 2494-2497.
- Ceballos LT, Siguero JPL, Ortiz AJ (2007) Prevalence of metabolic syndrome and its components in obese children and adolescents. AnPediatr (Barc) 67: 352-361.
- López-Capapé M, Alonso M, Colino E, Mustieles C, Corbatón J, et al. (2006) Frequency of the metabolic syndrome in obese Spanish pediatric population. Eur J Endocrinol 155: 313-319.
- Weiss R, Dziura J, Burgert TS, Tamborlane WV, Taksali SE, et al. (2004) Obesity and the metabolic syndrome in children and adolescents. N Engl J Med 350: 2362-2374.
- Reinehr T, de Sousa G, Toschke AM, Andler W (2007) Comparison of metabolic syndrome prevalence using eight different definitions: a critical approach. Arch Dis Child 92: 1067–1072
- Pouliot MC, Després JP, Lemieux S, Moorjani S, Bouchard C, et al. (1994) Waist circumference and abdominal sagittal diameter: best simple anthropometric indexes of abdominal visceral adipose tissue accumulation and related cardiovascular risk in men and women. Am J Cardiol73:460-468
- Savva SC, Tornaritis M, Savva ME, Kourides Y, Panagi A, et al. (2000) Waist circumference and waist-to-height ratio are better predictors of cardiovascular disease risk factors in children than body mass index. Int J ObesRelatMetabDisord 24: 1453-1458.
- Cook S, Auinger P, Daniels S (2003) What best predicts medical complications of obesity? BMI, waist circumference pr both. Obes Res 11 Suppl:A27-28.
- Velásquez-Rodríguez CM, Velásquez-Villa M, Gómez-Ocampo L, Bermúdez-Cardona J (2014) Abdominal obesity and low physical activity are associated with insulin resistance in overweight adolescents: a cross-sectional study. BMC Pediatrics 14:258.
- Lambert M, Paradis G, O´Loughlin J, Delvin EE, Hanley JA, et al. (2004) Insulin resistance syndrome in a representative sample of children and adolescents from Quebec, Canada. Int JObesRelatMetabDisord28:833-841.
- Reaven GM (1988) Banting lecture 1988. Role of insulin resistance in human disease. Diabetes 37: 1595-1607.
- Alberti KG, Zimmet PZ (1998) Definition, diagnosis and classification of diabetes mellitus and its complications. Part 1: diagnosis and classification of diabetes mellitus provisional report of a WHO consultation. Diabet Med 15: 539-553.
- (2002) Third Report of the National Cholesterol Education Program (NCEP) Expert Panel on Detection, Evaluation, and Treatment of High Blood Cholesterol in Adults (Adult Treatment Panel III): Final Report. Circulation 106: 3143-3421.
- Arner P (2005) Human fat cell lipolysis: biochemistry, regulation and clinical role. Best PractRes ClinEndocrinolMetab1:471-482.
- Cardona F,Gónzalo-Marín M, Tinahones FJ (2006) Association between postprandial hypertriglyceridemia and insulin resistance in patients with the metabolic syndrome. EndocrinolNutr53:237-241.
- Klop B, Elte JW, Cabezas MC (2013) Dyslipidemia in obesity: mechanisms and potential targets. Nutrients 5: 1218-1240.
- Zuo H, Shi Z, Yuan B, Dai Y, Wu G, et al. (2013) Association between serum leptin concentrations and insulin resistance: A population-based study from China. PLoS ONE 8: e54615
Tables and Figures at a glance
| Table 1 | Table 2 | Table 3 |
Figures at a glance
 |
 |
 |
 |
| Figure 1 | Figure 2 | Figure 3 | Figure 4 |
Relevant Topics
- Android Obesity
- Anti Obesity Medication
- Bariatric Surgery
- Best Ways to Lose Weight
- Body Mass Index (BMI)
- Child Obesity Statistics
- Comorbidities of Obesity
- Diabetes and Obesity
- Diabetic Diet
- Diet
- Etiology of Obesity
- Exogenous Obesity
- Fat Burning Foods
- Gastric By-pass Surgery
- Genetics of Obesity
- Global Obesity Statistics
- Gynoid Obesity
- Junk Food and Childhood Obesity
- Obesity
- Obesity and Cancer
- Obesity and Nutrition
- Obesity and Sleep Apnea
- Obesity Complications
- Obesity in Pregnancy
- Obesity in United States
- Visceral Obesity
- Weight Loss
- Weight Loss Clinics
- Weight Loss Supplements
- Weight Management Programs
Recommended Journals
Article Tools
Article Usage
- Total views: 10376
- [From(publication date):
April-2016 - Jul 15, 2025] - Breakdown by view type
- HTML page views : 9463
- PDF downloads : 913
