Landslide Hazard Mapping Along the Beni-Lete Road Section, Myagdi-Mustang Districts, Western Nepal
Received: 02-Feb-2024 / Manuscript No. jescc-24-128428 / Editor assigned: 05-Feb-2024 / PreQC No. jescc-24-128428 / Reviewed: 19-Feb-2024 / QC No. jescc-24-128428 / Revised: 24-Feb-2024 / Manuscript No. jescc-24-128428 / Published Date: 29-Feb-2024
Abstract
Mountainous country like Nepal is highly susceptible to the geo-hazard like landslide. Due the drastic variation into the topography there exists steep-gentle slope with their variation there found several types of hazards related to the topography, soil, rock and various intensity of rainfall. In this study model output in the form of landslide hazard map has been evaluated by correlating training landslide and validating landslide. The study shows that 12% of Beni to Lete road section of the Kaligandaki corridor have very high hazards, 27% of the area of Beni to Lete road section in high hazard, 30% of the area lies in the moderate hazards, 24% of the area lies in low hazard zone and 7% of the area of Beni to Lete road section lies in the very low hazard area. The study concludes that effect of geology is highest among all factors and is followed by elevation and drainage proximity. The phyllite and augen gneiss rich rock unit has found more suffered landslides which indicate reasonable predictive capabilities compared to other work of this nature.
Keywords
Landslide; Himalaya; Geology; Susceptibility; Hazard; Slope
Introduction
The Myagdi and Mustang districts are located in western Nepal of Gandaki Province. The active and historically youngest tectonically active Himalaya has been formed around 50 My ago and is still ongoing due to continental-continental collisions between Indian and Eurasian plates. The methodical process of mapping the potential for landslides and scientific way to determine the likelihood of landslides occurring within a certain time frame. The road segment from Beni to Lete that can be connected across the Chinese border is the Kaligandaki corridor. The shallow (about 0.5 to 2.5 m) seated landslide that caused the smallscale landslides that are brought on by the alteration in the physical characteristics of the soil strata during precipitation [1-5].
The tropical and sub-tropical climatic areas have steep slope, after the precipitation occurs for longer period of time area is unstable as the results, landslide may occurs. The landslide hazard maps are prepared by the use of Intrinsic factors such as geomorphology, slope gradient, slope aspect, elevation, engineering properties of materials exposed on slope and land use pattern. Geographic Information System (GIS) is a tool for managing, analyzing and visualizing spatial data [6-8]. The weight of evidence modelling technique is a statistical method for identifying relationship between variables and predicting outcomes. The extrinsic factors which are used to prepare the landslide hazard maps are rainfall, volcanoes, and earthquake. The various factors that can trigger landslide in the region, including rainfall, earthquake and human activities such as deforestation and construction. The input parameter used for the landslide hazard maps are geology and engineering geology, Digital elevation based morphometric maps, Soil map, land use map, drainage map, landslide inventory map etc. For the preparation of landslide hazard map, qualitative and quantities methods are used. The deterministic and statistical are the quantitative methods. Deterministic methods based on the factor of safety of the individual slopes [9,10].
GIS is the tools used for the preparation of landslide hazard map. It helps to collect the data and information, storing, processing, transforming and displaying the spatial data make GIS an effective tool while aspect, elevation, engineering properties of materials exposed on slope and land use pattern. Geographic Information System (GIS) is a tool for managing, analyzing and visualizing spatial data [11-16]. The weight of evidence modelling technique is a statistical method for identifying relationship between variables and predicting outcomes. The extrinsic factors which are used to prepare the landslide hazard maps are rainfall, volcanoes, and earthquake. The various factors that can trigger landslide in the region, including rainfall, earthquake and human activities such as deforestation and construction. The input parameter used for the landslide hazard maps are geology and engineering geology, Digital elevation based morphometric maps, Soil map, land use map, drainage map, landslide inventory map etc. For the preparation of landslide hazard map, qualitative and quantities methods are used. The deterministic and statistical are the quantitative methods. Deterministic methods based on the factor of safety of the individual slopes [17,18-20].
GIS is the tools used for the preparation of landslide hazard map. It helps to collect the data and information, storing, processing, transforming and displaying the spatial data make GIS an effective tool while running the GIS software need of the Digital Elevation Model (DEM) from to generate the topographic parameter to identify the landslide activity in a study area. To fulfill the objectives, the study area has been started from Beni (Headquarter of Magdi district) to end to Lete along the Kaligandaki corridor [21]. Along the section the Lesser, Higher and Tibetan-Tethys Himalayan rocks are found along the road corridor. The landslides are observed in the rocks of the Lesser and Higher Himalayas [22-26].
Study Area
The study area lies in Myagdi and Mustang districts, Gandaki Province of Nepal as shown in Figure 1. It includes three wards (6, 7 and 8) of Beni Municipality and Annapurna Rural Municipality. The work is carried out along the Beni–Lete road section of the Kaligandaki corridor [27,28-32].

Figure 1: Location of study area.
Geology of study area
Study area includes the Lesser, Higher and Tibetan-Tethys Himalayas. The two major thrusts are the Main Central Thrust (MCT) and South Tibetan Detachment System (STDS) are observed in the Ghatte Khola and Chhaktan Khola, respectively. The Lesser Himalaya includes rock units of the Kuncha Formation, Fagfog Quartzites, Dandagoan Phyllites, Nourpul Formation, Dhading Dolomites, Benighat Slates of the Lower Nawakot Group. The rocks are found in the Lesser Himalayan zone are phyllite, quartzite, amphibolite and mylonitic gneiss. The Higher Himalaya includes the Formation I, Formation II and Formation III, respectively [33]. The rocks are found in the Higher Himalaya are high metamorphic rocks like schist, gneiss, banded gneiss and augen gneiss. The Tibetan-Tethys Himalaya includes the Annapurna Yellow Formation. The sedimentary rock sequences of the Tibetan-Tethys Himalaya is composed of limestone is found (Figure 2). Within the rocks of the Benighat Slates, Lesser Himalaya, a fault is seen in the Duwari Khola near to the Dana village is called as the Duwari Khola Thrust. Towards north from the Duwari Khola Thrust, the regional thrust is called as the Main Central Thrust (MCT) can be seen. The MCT separates the rocks of the Lesser Himalaya in south and the Higher Himalaya in north where the STDS separates the rocks of the Higher Himalaya in south and Tibetan-Tethys Himalaya in north. The geology of the area has been complicated, steep slope, high drainage density as the result landslide hazard occurs in Beni to Lete road section [34-38].

Figure 2: Methodology Flow Chart of Landslide Hazard Analysis by Weight of Evidence Method
Methodology
Different materials and methods are used during fieldwork and laboratory investigation. The details of methodology are discussed below in details.
Preliminary study
The preliminary study includes collecting secondary data and generating the idea for the analysis process. Preliminary study area carried out for the relevant literatures, field study for data collection, verification and geo database preparation to calculate the factors maps for analysis [39-43].
Data base generation
Landslide Inventory map is prepared from the Google imaginaries from the data of April 2006 to December 2022. Sentinel-2 (A) imaginaries of date 2022/4/25 are collected from the Copernicus open access hub with 10 by 10 m resolution. The DEM is used for the preparation of factor maps such as slope, aspect, elevation, topographic index [44,45].
Landslide hazard analysis
The primary data includes the image extracted from the Google imageries. The secondary data include the DEM, contour map, satellite image and geological map. The parameters used for the preparation of hazard map are slope, aspects, distance from road, distance from river, rainfall data, topographic wetness index, normalized difference vegetation index, land use, elevation, stream power index (Figure 3). First the landslide inventory maps are prepared by certain polygon on the Google imageries. After the preparation of the factor maps are overlaid with the landslide inventory [46,47-52]. The susceptibility map will develop than the weightage of each factors maps is calculated and reclassified the weightage of each factor in five categories than prepare the hazard map.

Figure 3: Geological Map modified from Upreti and Yoshida (2005).
Landslide inventory mapping
While preparing the landslide hazard map by using the weight of evidence method, the landslide inventory is the basic parameter from where we can know the landslide distribution and its patterns. From the landslide inventory map are known the causative factors of the past, present landslide and predict the future landslide. The landslide inventory map is prepared from the Google imageries of the last 16 years [53].
Landslide hazard modelling
The landslide hazard modelling is started from the factor’s maps are preparation. The factors maps are prepared by the GIS software of 10.8 versions. The weight of each landslide causative factors is based on the presence or absence of the landslide with in the area [54].
In landslide susceptibility prediction, the weight contrast Wf = W+ -W- ………(i)
is used to measure and reflect the spatial association between the landslide conditioning factors and landslide occurrence. The positive and negative weightage of the hazard can be calculated as follows:
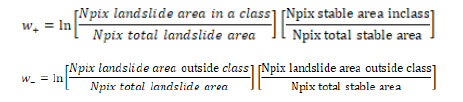
The contrast values give a first overview to accept or reject a predictor in estimating the spatial correlation between this and the landslides. The formula used for the predating the future probability of landslide by calculating the prior landslide probability. The total landslide hazard index for the single pixel all the predictive values are combined numerically as:
Wij= Wslope +Waspect +Welevation+Wlanduse+Wlithology+WNDVI +WTWI +Wdis from road +Wdist from River + Wdist from fault + WSPI +Wrainfall data
Where;
Wij= Landslide hazard index
Wslope= Weight of slope
Waspect= Weight of aspect
Welevation= Weight of elevation
Wlanduse= Weight of landuse
Wlithology= Weight of lithology
WNDVI= Weight of normalized difference vegetation index
WTWI= Weight of topographic wetness index
Wdistancefom road= Weight of distance from road
Wdistance from river= Weight of distance from river
Wdistance from fault= Weight of distance from fault
WSPI= Weight of stream power index
Wrainfall= Weight of annual rainfall
Results
Beni to Lete area by using Google image of different time between 2006 April to 2022 December total 156 landslides are identified. The landslide is converted into the raster format with pixel size of 5 m to 5 m. The area of the landslide ranges from the 400 to 439100 m2 Out of the total area 523.48 km2 the landslide accounted in Beni-Lete area section is about 2.82 km2 (Figure 4). Training landslide are 117 and testing landslide are 39 [55-59].

Figure 4: Landslide inventory map of study area.
Factors affecting landslides
The different factor such as slope, aspect, land use, normalized difference vegetation index, distance from fault, distance from river, distance from road, topographic wetness index, geology, elevation, stream power index, and rainfall are considered for the development of the hazard map. The different map (Figure 5 (a)-(l) is prepared to analyzed the landslide hazard [60-62].

Figure 5: a. slope map, b. Aspect map, c. landuse map, d. normalized difference vegetation index, e. distance from fault, f. distance from river, g. geology, h. distance from road, i. Topographic wetness index map, j. elevation map, k. stream power index, l. average rainfall map.
Landslide hazard mapping
For the preparation of the landslide hazard map, thirteen parameters have been used. The hazard map index of the area is calculated after adding all the weightage of the factors. The Landslide Hazard Index is expressed as;
Wij= Wslope + Waspect + Welevation + Wlandsue+ Wgeology + WNDVI + WTWI + Wdisfrom road + Wdisfrom river + Wdis from fault + Wcurvature + WSPI + Wannual rainfall
Hazard area divided into five different classes namely very high, high, medium, low and very low and illustrated in Figures 6 and 7. About 12% of the study area belonged to very high hazard zone as shown in light blue color. The high hazard zone covered 27% of the total study area. The moderate hazard zone occupied 30% of total study area. The low hazard zone occupied 24% of the total study area, the very low hazard zone occupied 7% of the total study area [63].

Figure 6: Landslide Hazard Map Calculated by Weight of Evidence Method.

Figure 7: The pie-chart shows the Very High hazard, High Hazard, Moderate Hazard, Low Hazard and Very Low Hazard.
Validation of hazard map
Among collected 156 total numbers of landslides from the Google earth. The total number of landslides separated into training and testing landslides. About 80% of the total 117 landslides are used to calculate the landslide hazard zone and remaining 39 landslides for the validation of the results (Figure 8). Then the 39% of landslides lies within the very high and high hazard zone and 30% of the landslide lies in the moderate hazard zone. The 19% of the landslide lies on the low hazard zone. Therefore, we can conclude that landslide hazard map is validated (Figure 9). The AUC graph shows the landslide hazard map validated upto 81.9% [64].

Figure 8: Landslide Distribution in Different Hazard Zone Using the Training Data Sets and Validating Data Sets.

Figure 9: AUC graph shows the Landslide Hazard Map Validation up to 81.9%.
Discusssion
Discussion is elaborated in terms of landslide hazard map, geological and engineering geological condition and role of geotechnical parameters. A catastrophic loss on lives, property and environment has been increasing due to human activities. Among them weight of evidence model is widely used and more concise for the preparation of the landslide hazard map. For this reason, the weight of evidence method is applied for the landslide hazard mapping of Beni to Lete road section of the Kaligandaki corridor [65]. The training and testing landslide are present in the landslide inventory map. There are two classes of the landslide inventory, event based and historical landslide inventory (Rosi et al. 2018). The landslide susceptibility mapping of West Central Nepal Lesser Himalaya Baglung Municipality by using the different causative factor such as elevation, slope, curvature, land use, geology, rainfall, soil type, soil thickness topographic wetness index, stream density, were used to prepare the landslide susceptibility map. All the thematic layers of these parameters were made using ArcGIS 10.4.1. [66]. In this study testing landslide has been used for the landslide hazard analysis. There are some classification techniques for the landslide hazard maps in GIS software such as manual, define interval, natural break, equal interval, standard deviation, geometrical interval and landslide percentage. But, manually classification could be done with analysis of field condition of field condition which is very difficult to interpret and justify. In this study, the classification of values has been done by the help of field condition of landslides. Slope, the primary factors, takes higher value of weightage as gravity pull affects the slope condition and continuously pull the slope materials down. In this study the slope angle ranges from 30 to 45° included maximum percentage of landslide 35.06%. Aspects are another parameter for the preparation of landslide hazard map. As aspects can categories high moisture area where sunlight hits less and dry area where sunlight hits the most. So, that the weightage of aspect is lower than other factors. Among other classes south, northeast, east and north parts contain maximum landslide. Land use is another parameter for the preparation of landslide hazard map [67]. The land use gives information about human activities and water managements practices that can be easily related with the landslide occurrences. Maximum landslide is seen in the cultivated land. This is because cultivated land cover 52% of the total area and other remain classification exerts only small parts of the area. From the calculation the weightage of cultivate land is found as 0.49 and shrub land having weightage 0.21. As the result, the main reason for landslide concentrated on the cultivated land due to steep slope and high drainage density. To conform of this conclusion, we used the normalized difference vegetation index with classification about four main section and we find the maximum landslide 44.56% at low index class 1 to 0.1, respectively. The cultivated land is not the triggering factors of landslide.
Conclusion
In this study, landslide is extracted from high resolution image and weight of evidence method is used to prepare the landslide hazard map. Beni to Lete road section of the Kaligandaki corridor of Mygadi to Mustang districts has complex geology, steep slope and high drainage density. Thirteen parameters are used for the preparation of landslide hazard map they are slope, aspect, curvature, elevation, rainfall, distance from road, distance from river, distance from fault, stream power index, topographic wetness index, normalized vegetation index, geology and land use. The thematic layers are classified into different classes using natural breaks for continuous data and later reclassified using weight of evidence method. The major threshold values are aspect, rainfall and topography. Following are the conclusion of this study.
The generally three types of soil are observed along Beni-Lete road section of the Kaligandaki corridor they are alluvial soil, colluvial soil and residual soil. In which well graded gravelly sand (GS) and sandy gravel (SG) are dominated.
Rock mass rating and kinematic analysis are performed in the study area to calculate the stability of rock. The poor to very poor rock found in the Lesser Himalaya zone while fair, good and very good rock like augen gneiss, and banded gneiss are observed in the Higher Himalayan zone. The plane failure and wedge failure are observed Lesser and Higher Himalayan rocks.
The cohesion is low and the friction angle is high in the sandy soil where porosity and permeability are high as the result the failure possibility is found in the soil.
Moisture contains in the soil range from 6.37% to 37.66% as the result it increases the weight of the soil which helps to downwards movement of the rocks and soil with the influence of gravity.
The clay minerals like chlorite, muscovite, biotite, serpentine observed in the field they are the platy minerals with the low hardness and easily weathered in presence of water as the result they show the expansion and contraction nature of the soil which caused the failure of the rock and soil.
Several delineated units in engineering geological map with other causative parameters are used for analysis and characterizing the hill slope.
Total 156 landslides have been traced in this area by the help of Google earth. The results show the slope between 30 to 45°, topographic wetness index less than 3, geology (Kucha Formation) of the Lesser Himalaya and rainfall are the four primary factors that influence more create landslide than other factors.
The 12% of the total area belonged to very high hazard zone, 27% of the total study area lies to be high hazard zone, 24% of the study area lies on the low hazard zone and 7% of the total study area lies on the very low hazard zone.
The landslide hazard map is valid by making the area under cover (AUC) by the helps of testing landslide and its validation percentage is 81.9%. The landslide hazard can be used as base map for preparing risk and vulnerability map of Beni to Lete road section.
References
- Akgun A (2012) A comparison of landslide susceptibility maps produced by logistic regression, multi-criteria decision, and likelihood ratio methods: a case study at İzmir, Turkey. Landslides 9: 06–931.
- Alejano LR (2021) Considerations on failure mechanisms of rock slopes involving toppling. In IOP Conference Series: Earth and Environmental Science 833: 012004.
- Anagnostopoulou S, Depountis N, Sabatakakis N Pelekis P (2022) Large Shear Strength Parameters for Landslide Analyses on Highly Weathered Flysch. Land 11: 1353.
- Anbalagan R, Singh B (2001) Landslide hazard and risk mapping in the Himalaya. Landslide Hazard Mitigation in the Hindu Kush-Himalayas (Eds., Tianchi, L., Chalise, S. and Upreti, B.), International Centre for Integrated Mountain Develoment, Kathmandu 163–188.
- Aramaki S, Kitazono Y, Suzuki A, Kajiwara M (1992) Application of direct shear test to analysis of tertiary landslides along a bedding plane. Soils and foundations 32: 1–12.
- Baeza C, Lantada N, Amorim S (2016) Statistical and spatial analysis of landslide susceptibility maps with different classification systems. Environ Earth Sci 75: 1318.
- Basnet K, Wagle D, Bhattarai S, Sadadev BB (2020) Analysis of Slope Stability for Kaande Landslide of Phewa Watershed, Pokhara, Nepal. Technol J 2: 11–21.
- Bieniawski ZT (1989) Engineering rock mass classifications: a complete manual for engineers and geologists in mining, civil, and petroleum engineering. WLY.
- Borden RH, Putrich SF (1986) Drained-strength parameters from direct shear tests for slope stability analyses in overconsolidated fissured residual soils. 1089.
- Cao Y, Wei X, Fan W, Nan Y, Xiong W, et al. (2021) Landslide susceptibility assessment using the Weight of Evidence method: A case study in Xunyang area, China. PLoS One 16: 0245668.
- Carosi R, Gemignanni L, Godin L, Iaccarino S, Larson K, et al. (2014) A geological journey through the deepest gorge on Earth: The Kali Gandaki valley section, central Nepal.
- Chiara Montomoli, Rodolfo Carosi, Rick Law, Sandeep Singh, Santa Man Rai (2014) Geological field trips in the Himalaya, Karakoram and Tibet. Journal of the Virtual Explorer 1441–8142.
- Chacon J, Irigaray C, Fernández T, El Hamdouni R (2006) Engineering geology maps: landslides and geographical information systems. Bull Eng Geol Environ 65: 341–411.
- Chang H, Kim NK (2004) The evaluation and the sensitivity analysis of GIS-based landslide susceptibility models. Geosci J 8: 415.
- Chen H, Zhu Q, Peng C, Wu N, Wang Y, et al. (2013) The impacts of climate change and human activities on biogeochemical cycles on the Q Qinghai‐T Tibetan P plateau. Glob Change Biol 19: 2940–2955.
- Chen W, Zhao X, Shahabi H, Shirzadi A, Khosravi K, Chai H, et al. (2019) Spatial prediction of landslide susceptibility by combining evidential belief function, logistic regression and logistic model tree. Geocarto International 34: 11771–11201.
- Copley A, Avouac JP, Royer JY (2010) India‐Asia collision and the Cenozoic slowdown of the Indian plate: Implications for the forces driving plate motions. J Geophys Res Solid Earth 115.
- Dahal BK, Dahal RK (2017) Landslide hazard map: tool for optimization of low-cost mitigation. Geoenvironmental Disasters 4: 1–9.
- Dahal RK (2017) Landslide hazard mapping in GIS. JNGS 53: 63–91.
- Dahal RK, Hasegawa S (2008) Representative rainfall thresholds for landslides in the Nepal Himalaya. Geomorphology 100: 429–443.
- Dahal RK, Hasegawa S, Masuda T, Yamanaka M (2006) Roadside slope failures in Nepal during torrential rainfall and their mitigation. Disaster mitigation of debris flows 503–514.
- Dahal RK, Hasegawa S, Nonomura A, Yamanaka M, Dhakal S, et al. (2008) Predictive modelling of rainfall-induced landslide hazard in the Lesser Himalaya of Nepal based on weights-of-evidence. Geomorphology 102: 496–510.
- Dahal RK, Hasegawa S, Nonomura A, Yamanaka M, Masuda T, et al. (2008) GIS-based weights-of-evidence modelling of rainfall-induced landslides in small catchments for landslide susceptibility mapping. Environ Geol 54: 311–324.
- Dhital MR (2015) Geology of the Nepal Himalaya: regional perspective of the classic collided orogen. Springer.
- Dikshit A, Sarkar R, Pradhan B, Segoni S, Alamri AM (2020) Rainfall induced landslide studies in Indian Himalayan region: a critical review. Appl Sci 10: 2466.
- Ding Q, Chen W, Hong H (2017) Application of frequency ratio, weights of evidence and evidential belief function models in landslide susceptibility mapping. Geocarto international 32: 619–639.
- Dolinar B, Misic M, Trauner L (2007) Correlation between surface area and Atterberg limits of fine-grained soils. Clays and Clay Minerals 55: 519–523.
- Dwivedi SK, Dwivedi S, Joshi GR (2006) Slope stability of the Pawati Landslide, Dolkha District, Central Nepal. Education 2009.
- Eugster HP, Albee AL, Bence AE, Thompson JB, Waldbaum DR (1972) The two-phase region and excess mixing properties of paragonite-muscovite crystalline solutions. J Petrol 13:147–179.
- Feizizadeh B, Blaschke T, Nazmfar H, Rezaei Moghaddam MH (2013) Landslide susceptibility mapping for the Urmia Lake basin, Iran: a multi-criteria evaluation approach using GIS. Int J Environ Res 7: 319–336.
- Fell R, Corominas J, Bonnard C, Cascini L, Leroi E, et al. (2008) Guidelines for landslide susceptibility, hazard and risk zoning for land use planning. Eng Geol 102: 85–98.
- Ferrari F, Apuani T, Giani GP (2014) Rock Mass Rating spatial estimation by geostatistical analysis. Int J Rock Mech Min Sci 70: 162–176.
- Frempong E (1994) Geotechnical properties of some residual micaceous soils in the Kumasi Metropolitan area (Ghana). Bull Eng Geol Environ 49.
- Gokceoglu CANDAN, Sonmez H, Ercanoglu MURAT (2000) Discontinuity controlled probabilistic slope failure risk maps of the Altindag (settlement) region in Turkey. Eng Geol 55: 277–296.
- Hamza T, Raghuvanshi TK (2017) GIS based landslide hazard evaluation and zonation–A case from Jeldu District, Central Ethiopia. J King Saud Univ Sci 29: 151–165.
- Hou TS, Xu GL, Shen YJ, Wu ZZ, Zhang NN, et al. (2013) Formation mechanism and stability analysis of the Houba expansive soil landslide. Eng Geol 161: 34–43.
- Hungr O, Leroueil S, Picarelli L (2014) The Varnes classification of landslide types, an update. Landslides 167–194.
- Kayastha P, Bijukchhen SM, Dhital MR, De Smedt F (2013) GIS based landslide susceptibility mapping using a fuzzy logic approach: A case study from Ghurmi-DhadKhola area, Eastern Nepal. J Geol Soc India 82: 249–261.
- Kellett DA, Cottle JM, Larson KP (2019) The South Tibetan Detachment System: history, advances, definition and future directions. Geol Soc Spec Publ 483: 377–400.
- Koirala M, Hayashi D (2007) Engineering Geological Studies along the TinpipleBanchare Dada Road, Central Nepal. Bull Coll Sci Univ Ryukyus 33–44.
- Liu YC, Chen CS (2007) A new approach for application of rock mass classification on rock slope stability assessment. Eng Geol 89: 129–143.
- Moore ID, Grayson RB, Ladson AR (1991) Digital terrain modelling: a review of hydrological, geomorphological, and biological applications. Hydrol Process 5: 3–30.
- Pardeshi SD, Autade SE, Pardeshi SS (2013) Landslide hazard assessment: recent trends and techniques. Springer Plus 2: 1–11.
- Park H, West TR (2001) Development of a probabilistic approach for rock wedge failure. Eng Geol 59: 233–251.
- Parsons AJ, Law RD, Searle MP, Phillips RJ, Lloyd GE (2016) Geology of the Dhaulagiri-Annapurna-Manaslu Himalaya, Western Region, Nepal. 1: 200,000. J Maps 12: 100–110.
- Pathak D (2016) Remote sensing and GIS application in landslide risk assessment and management. j geoinf 52–57.
- Pathak L, Devkota KC (2022) Landslide susceptibility assessment in the RangunKhola watershed of far western Nepal. JNGS 33–44.
- Pham BT, Tien Bui D, Pourghasemi HR, Indra P (2017) Landslide susceptibility assesssment in the Uttarakhand area (India) using GIS: a comparison study of prediction capability of naïve bayes, multilayer perceptron neural networks, and functional trees methods. Theor Appl Climatol 128: 255–273.
- Raghuvanshi TK (2019) Plane failure in rock slopes–A review on stability analysis techniques. J King Saud Univ Sci 31: 101–109.
- Rai SM, Upreti BN, Yoshida M, Bhattarai TN, Ulak PD (2005) Geology of the Lesser and Higher Himalayan zones along the Kaligandaki Valley, central-west Nepal Himalaya. Kathmandu 43–56.
- Regmi AD, Yoshida K, Pourghasemi HR, Dhita MR, Pradhan B (2014) Landslide susceptibility mapping along Bhalubang-Shiwapur area of mid-Western Nepal using freq
Indexed at, Google Scholar, Crossref
Indexed at, Google Scholar, Crossref
Indexed at, Google Scholar, Crossref
Citation: Sandesh D, Prakash DU, Chabbilal P, Mahendra A (2024) LandslideHazard Mapping Along the Beni-Lete Road Section, Myagdi-Mustang Districts,Western Nepal. J Earth Sci Clim Change, 15: 772.
Copyright: © 2024 Sandesh D, et al. This is an open-access article distributedunder the terms of the Creative Commons Attribution License, which permitsunrestricted use, distribution, and reproduction in any medium, provided theoriginal author and source are credited.
Select your language of interest to view the total content in your interested language
Share This Article
Recommended Journals
Open Access Journals
Article Usage
- Total views: 2667
- [From(publication date): 0-2024 - Nov 04, 2025]
- Breakdown by view type
- HTML page views: 2274
- PDF downloads: 393