Landslide hazard assessment using UAV imagery and GIS for road planning and development in Chure area: Sindhuli-Hetauda Section
Received: 07-Feb-2022 / Manuscript No. jescc-22-54223 / Editor assigned: 09-Feb-2022 / PreQC No. jescc-22-54223(PQ) / Reviewed: 23-Feb-2022 / QC No. jescc-22-54223 / Revised: 28-Feb-2022 / Manuscript No. jescc-22-54223(R) / Accepted Date: 28-Feb-2022 / Published Date: 04-Mar-2022 DOI: 10.4172/2157-7617.1000607
Abstract
Chure hills are formed with the highly fragile, weak young sedimentary rocks and are environmentally sensitive. Road construction in this region is a big challenge to conserve the Chure from landslide. Occurrence of landslide hazard along the highway is the threat to the objective of timely, efficient and qualitative construction of highway. Landslide hazard map can greatly help in fixing and shifting of the alignment to reduce the loss of life and property.
This study “Landslide hazard assessment using UAV imagery and GIS for road planning and development in Chure area: Sindhuli-Hetauda section” aims at creating the hazard map, landslide inventory map and designation of hazard levels in one of the sensitive areas: Chure section. With the use of the Unmanned Aerial Vehicles (UAVs) as the primary means of carrying out the topographical surveying, the study used the Digital Surface Model (DSM) and the orthomosaic map produced from the UAV survey in acquiring the relevant results for fulfilling the study objectives. The survey area being ~100Km in length along the road alignment, four of the most crucial sites on the basis of existing landslide area and impact of those landslide in road, cultivation and settlement in the study area were selected for surveying. The study concluded that use of UAV for hazard mapping has good, accuracies and high resolution data. The Root Mean Square Error (RMSE) of the survey for the individual sites was found to be 0.001m, 0.045 m, 0.044 m and 0.804 m, respectively. A detailed topographical map of the area was created, along with the hazard map, including the factors such as slope, aspect, curvature, elevation, lithology, distance to road, distance to river and soil type. Furthermore, the hazard levels for the surveyed area were also obtained: the largest area being medium 60.68%, 57.45%, 71.21% and 71.16%, respectively, followed by high 32.59%, 18.91%, 17.03% and 11.54% respectively and low 6.73%, 23.64%, 11.76% and 17.30%, respectively in Chattiwan, Bhawanchuli, Gurji and Hakpara. It was also concluded that the forest area is at high risk followed by the bush and the settlement area in the Chattiwan, Bhawanchuli and Hakpara site and the cultivable land followed by the bush and the settlement area were found to be in high risks in the fourth site (Gurji).
Keywords
UAV; DEM; Chure, Landslide hazard, Risk assessment
Introduction
Background
Landslides are gravity- dominated mass movement that transports soils, rock, and dumped waste material and artificial fills from elevated position to the down slope. Landslide generally occurs when extreme events like heavy rainfall, seismic activity, movement of mass of ground which is marginally stable take place. Landslides are common natural hazards in mountain region which are accelerated by the development processes.
Landslide hazard mapping is a basic tool which can be used to represent the hazard area with the magnitude of hazard (High, Moderate, and Low). It is important to assess and ensure the year round functioning of the mountainous road for a country like Nepal where most of the terrain is occupied by hills and mountain [1]. Landslide hazard map indicate the areas susceptible to landslide which requires careful evaluation of hazard condition and its possible impact before road alignment is finalized. During construction of highway, alignment fixation plays important role. Occurrence of landslide hazard along the highway is the threat to the objective of timely, efficient and qualitative construction of highway [2]. Landslide also increases the maintenance and operation cost of highway. The ultimate aim of any road construction is to avoid landslide prone area for which landslide hazard map of that area is absolutely necessary.
Chure region is environmentally sensitive due to its loose structural nature of stone, gravel, coarse sands, mudstone and sandstones [3]. Recently, Nepal Government announced to develop the alternative highway to connect east and west which passes through the Chure region, named Madan Bhandari Highway. This project will drastically change the area to urbanization which might lead to increase in pressure on the available resources in the Chure region. Land use pattern will be changed that may cause negative impact on the land. The improper land management along the Chure might aggravate the chances of landslide in already fragile landscape. The president of Chure- Terai Madhesh Conservation Development Board, which was formed in 2016, takes the highway construction as a challenge to conserve Chure from the aforementioned disasters (PCTMCD/GoN, 2018).
Statement of the Problem
Chure hills are formed with the highly fragile, weak and young sedimentary rocks which are highly weathered and deformed, and inter-bedding of soft mudstone and hard sandstone beds provide differential weathering providing plenty of options for slope instabilities and occurrence of different types of landslides [4]. Landslides in Chure are caused by both natural and human interferences. Change of land use system and land cover due to deforestation, haphazard road construction and over exploitation of raw materials have triggered landslide in Chure area. Madan Bhandari Highway, a new road project from east to west is proposed for construction in Chure area, having length of 1200km, connecting Jhapa of eastern Nepal to Dadeldhura of western Nepal [5]. The new highway proposed on geologically fragile Chure area will create adverse impact on the environment [6]. Sindhuli- Hetauda section is one section of Madan Bhandari Highway which is under construction without hazard mapping and risk assessment. Road contributes to the largest surface erosion and landslide losses (per unit area disturbed) compared to other land use [7]. Land use has direct impact on the soil erosion and slope stability in Tropical Mountain including timber harvesting, road trails, various agro-forestry practices, and conversion of forest to agricultural land and to grazing land.
There is lack of detail study of landslides and related phenomena in Chure area that creates dilemma about the landslide hazard, its distribution, and possibility of future occurrences, landslide risks and mitigation measures. Occurrence of landslide hazard along the highway is the threat to the objective of timely, efficient and qualitative construction of highway. Landslide also increases the maintenance and operation cost of highway. The ultimate aim of any road construction is to avoid landslide prone area for which landslide hazard map of that area is absolutely necessary.
Significance of the study
Unmanned Aerial Vehicle (UAV) was used to collect high resolution aerial images, which portray the features that can be obtained from the satellite imagery but with higher detail of data, to produce highly accurate Digital Elevation Model (DEM) and Orthophoto maps. The Ortho-photo map can be used for inventory mapping of landslide and the Digital Elevation Model (DEM) for landslide hazard map. Use of UAV for collection of aerial imagery to produce DEM is cost-effective as well as time efficient. Landslide hazard is a map that includes topographic and geographic information that can be used to compare against the inventory. This can greatly help in fixing and shifting of the alignment to reduce the loss of life and property. Landslide risk analysis has been used to quantify landslide risk along the road surrounding areas. As a final output, direct risk can be quantified for properties (alignments, vehicles, buildings, and plantations) and people (commuters and residents) [8-24].
Scope of the Study
Landslide hazard map along Sindhuli- Hetauda road section of the Chure Area (Sindhuli-Hetauda Section) has been prepared using GIS. Weight of Evidence Model has been used during preparation of landslide hazard map with different parameters such as: Lithology, Land Use, Topography, Drainage, and Road Construction. UAV and SfM technology have been used to get the efficient DEM of the study area along with the ortho-photo map which is useful to identify the actual condition of road construction of the area. Landslide hazard map, together with information on existing or expected vulnerability, have been used to estimate the risk associated with the road networks.
Results and Discussion
Landslide Inventory in the study area
Landslide inventory map along the Hetauda - Sindhuli Road section contains the information about landslides occurred in that study area, such as landslide phenomena locations, type, volume and damages. Landslides are presented as area coverage by landslide. 100km of the Hetauda- Sidhuli road section was visited during site visit. Road alignment passes through plain as well as hill side. Mainly road contains the cut area at one side, left side as well as right side as shown in Figure 2.1. Length of road containing cut at right side was 15.1km and at left side was 40.78km. Road has box cutting in some point. In cut slope along the road alignment, there are landslides visible in slope which exhibit both shallow as well as deep slide.
During the field visit, SW Map was used to track the alignment which was also helpful to mark the cut slope in different location. Cut slope was separated by marking start and end of the cut slope for the remarks to know the point of change in cut and fill. During the field visit, major landslides were marked by GPS in which some were active. The main reason of those slides was construction of new road alignment in fragile geology.
The major landslides available in the study area are shown in Table 2.1. In preparing this Table, a deliberate effort has been made to set it up according to features that are observed at the time of site visit. Mainly location, soil type, type of landslide, state of activity etc. was tabulated to provide the information of landslides which were caused by the road construction (Sidhuli-Hetauda Road Section).
| ID | Rural Municipality/ Municipality | Ward No. | Tole Name | Soil Type | Type of Landslide | State of Activity | Distance from Road (m) | Distance from Drainage (m) | Land Use | Remarks |
|---|---|---|---|---|---|---|---|---|---|---|
| LS-1 | Bakaiya Rural Municipality | 3 | Syaulebazar | GC | Debris Slide | Active | 10 | Forest/Road | Road Construction is cause | |
| LS-2 | Bakaiya Rural Municipality | 3 | Chhatiwan | GC | Debris Fall | Active | 40 | Forest/Road | Road Construction is cause | |
| LS-3 | Bakaiya Rural Municipality | 4 | Pandure | GC | Rotetional | Dorment | 30 | 5 | Forest/Road | Road Construction is cause |
| LS-4 | Bakaiya Rural Municipality | 4 | Aajingare | GC | Debris Slide | Active | 20 | Forest/Road | Road Construction is cause | |
| LS-5 | Bakaiya Rural Municipality | 5 | Bhawanchuli | GC | Fall | Active | 20 | 50 | Forest/Road | Road Construction is cause |
| LS-6 | Bagmati Rural Municipality | 7 | Lamitar | GC | Fall | Active | 10 | 20 | Forest/Road | Road Construction is cause |
| LS-7 | Bagmati Rural Municipality | 7 | Lamitar (Near Bagamti) | GC | Slide | Active | 40 | 50 | Cultivation/Road | Road Construction is cause |
| LS-8 | Hariharpurgadi Rural Municipality | 2 | Dande | GC | Fall | Active | 20 | Cultivation/Building/Road | Road Construction is cause | |
| LS-9 | Hariharpurgadi Rural Municipality | 3 | Banauli | OH | Fall | Active | 20 | Cultivation/Road | Road Construction is cause | |
| LS-10 | Hariharpurgadi Rural Municipality | 3 | Sakun | OH | Fall | Active | 10 | Seepage at point | Cultivation/Road | Road Construction is cause |
| LS-11 | Hariharpurgadi Rural Municipality | 3 | Sakun | GP | Fall | Active | 10 | Seepage at point |
Forest/Road | Road Construction is cause |
| LS-12 | Hariharpurgadi Rural Municipality | 4 | Hakpara | GC | Fall | Active | 10 | Seepage at point |
Forest/Road | Road Construction is cause |
| LS-13 | Hariharpurgadi Rural Municipality | 2 | Gurji/Pipalmadi | GC | Slide/ Fall | Active | 20 | 50 | Cultivation/Building/Road | Road Construction is cause |
Table 2.1: Landslide Information.
| Major Divisions | Group Symbols | Typical Names | ||
|---|---|---|---|---|
| Coarse grained soils, more than 50% retained on 0.075 mm seive and passing 75 mm sieve | Gravels 50% or more of coarse fraction retained on 4.75 sieve | Clean Gravel | GW | Well-graded gravel, fine to coarse gravel |
| GP | Poorly graded gravel | |||
| Gravels with fines | GM | Silty gravel | ||
| GC | Clayey Gravel | |||
| Sands more than 50% of coarse traction passes 4.75 mm sieve | Clean sands | SW | Well-graded sand, fine to coarse sand | |
| SP | Poorly graded sand | |||
| Sands with fines | SM | Silty sand | ||
| SC | Clayey sand | |||
| Fine grained soils 50% or more passes 0.075 mm | Silts and clays liquid limit 50% or less | ML | Silt | |
| CL | Clay of low plasticity, lean clay | |||
| OL | Organic silt, organic clay | |||
| Silts and clays liquid limit Greater than50% | MH | Silt of high plasticity, elastic silt | ||
| CH | Clay of high plasticity, fat clay | |||
| OH | Organic clay, organic silt | |||
| Highly organic soils | PT | Peat | ||
Table 2.2: The Unified Soil Classification System. Source (Dahal, 2006)
Types of landslides observed at study area were classified on the basis of type of landslide proposed by Varnes (1978). The type of landslides was determined by a short period of observation or by the shape of the slide and arrangement of debris. Landslide types are shown in Figure 2.1.

Figure 2-1: Cut slope zone along the Study area.
The states of activity of landslides in the study area were classified on the basis of moving nature observed. An active landslide is the one which currently moving whereas dormant landslides are inactive landslide which can be reactivated by its original causes or other causes. In study area, major landslides observed were active in state due to the higher cut slope of road in hill side and lack of protective measures in those areas.
The locations of the landslides in the study area were surveyed with GPS which is presented in Table 2.3. In Table 2.3, landslide status has been categorized into small and big on the basis of area covered by landslide on that location. Big landslide has two or more than two landslides near about the point Land use available near those existing landslides in road alignment has been presented as the vulnerable land use.
| ID | GPS Point | Landslide Status | Vulnerable | Remarks | ||||
|---|---|---|---|---|---|---|---|---|
| Easting | Northing | Height | Building | Road | Cultivation | |||
| LS-1 | 319795 | 3026905 | 490 | Small | ||||
| LS-2 | 319951 | 3026690 | 444 | Big | ||||
| LS-3 | 324241 | 302588 | 280 | Small | ||||
| LS-4 | 325222 | 3026472 | 288 | Small | ||||
| LS-5 | 330456 | 3026852 | 356 | Small | ||||
| LS-6 | 340977 | 3024517 | 257 | Small | ||||
| LS-7 | 345351 | 3020108 | 211 | Small | ||||
| LS-8 | 348273 | 3018875 | 199 | Small | ||||
| LS-9 | 350898 | 3016058 | 199 | Small | ||||
| LS-10 | 352559 | 3013661 | 208 | Small | ||||
| LS-11 | 352552 | 3015993 | 212 | Big | ||||
| LS-12 | 359813 | 3016981 | 234 | Small | ||||
| LS-13 | 343599 | 3020573 | 217 | Small | ||||
Table 2.3: Vulnerable Information.
The thirteen landslides areas are shown along the proposed highway in Figure 2.2.

Figure 2-2: Landslide inventory map.
Considering the size, type and impact of the landslide in the study area, four sites were selected as the critical section for the study in which UAV was used to survey the area. The orthomosaic, output of the UAV survey, was used to identify the existing landslide in the selected specific study area of the road section. Major land use of area was also digitized to identify the impact of landslide in those areas. (Table 2.4) shows the detail information about the selected site of study area for hazard map. All data of Table 2.4 are collected through field visit.
| Site-1 (CHATTIWAN) | Site-2 (BHAWANCHULI) |
|---|---|
Land Use:
Partially Collapse Length of study Section: 2 Km Major point having landslide are as below:
N: 3027124 m Z: 532 m Right Side from road Soil Depth: 50 cm Below soil: PattreChattan Soil Type: GC Landslide Type: Debris Slide
N: 3026998 m Z: 549 m Left Side from road Soil Depth: 40 cm Below soil: Rock Soil Type: GC Landslide Type: Soil and Rock Fall
N: 3026939 m Z: 522 m Left Side from road Soil Depth: 50 cm Below soil: Rock Soil Type: GC Landslide Type: Soil and Rock Fall
N: 3026622 m Z: 445 m Left Side from road Soil Depth: 50 cm Below soil: Rock Soil Type: GC Landslide Type: Debris Fall |
Land Use:
Partially Collapse Length of study Section: 2 Km Major point having landslide are as below:
N: 3026845.34 m Z: 399 m Right Side from road Soil Depth: 60 cm Below soil: PattreChattan Soil Type: GC Landslide Type: Debris Slide
N: 3026887.73 m Z: 433 m Left Side from road Soil Depth: 40 cm Below soil: Rock Soil Type: GC Landslide Type: Soil and Rock Fall
N: 3026818.64 m Z: 458 m Right as well as Left Side from road Soil Depth: 20 cm Below soil: Soil Type: Boulder Mix Soil Landslide Type: Soil and Boulder Fall |
| Site-3 (GURJI) | Site-4 (HAKPARA) |
Land Use:
Gabion wall at site 3(b) but not sufficient height to protect the landslide Kind of Damage: Partially Collapse Length of study Section: 1.5 Km Major point having landslide are as below:
N: 3020179.94 m Z: 243 m left Side from road Soil Depth: 45 cm Below soil: Soil Type: GC Landslide Type: Soil and Rock fall
N: 3020477.30 m Z: 238 m Left Side from road Soil Depth: 40 cm Below soil: Rock Soil Type: GC Landslide Type: soil slide |
Land Use:
Partially Collapse Length of study Section: 2 Km Major point having landslide are as below:
N: 30169663 m Z: 224 m Left Side from road Soil Depth: 30 cm Below soil: PattreChattan Soil Type: GC Landslide Type: Soil and Rock Slide
N: 3016879 m Z: 206 m Left Side from road Soil Depth: 35 cm Below soil: Rock Soil Type: GC Landslide Type: Soil and Rock Fall
N: 3016830 m Z: 206 m Left Side from road Soil Depth: 20 cm Below soil: PatreeChattan Soil Type: GC Landslide Type: Soil and Rock Fall
N: 3016748 m Z: 206 m Left Side from road Soil Depth: 50 cm Below soil: Patree Chattan Soil Type: GC Landslide Type: Debris Fall
N: 3016621 m Z: 211 m Left Side from road Soil Depth: 30 cm Below soil: Boulder Mix Soil Soil Type: GC
N: 3015943.73 m Z: 230 m Left Side from road Soil Depth: 25 cm Below soil: Patree Chattan Soil Type: GC |
Table 2.4: Details of each site in the study area.
Chattiwan site
Chattiwan site was selected on the basis of existing landslide area along the road alignment and junction of the two major roads (Proposed Madan Bhandari Highway and Fast Track). The study mainly focused on the Madan Bhandari highway section but newly cut area of fast track also has seen impact on the section. Orthomosaic in (Figure 2.3) provides the picture of the site at the time of survey. Land use of that area was obtained by digitizing the orthomosaic presented in (Figure 2.4). The major land use has been found to be forest which covers the 0.725 sq. km. Other land use on Chattiwan site were cultivation, settlement, stream, wall, landslide, fill, road etc. The land use, landslide indicates the existing landslide in the study area which covers the 0.883 sq.km. (Table 2.5) provided information of land use with area cover by individual land use in the study area.

Figure 2-3: Orthophoto of Chattiwan.

Figure 2-4: Landuse map of Chattiwan.
| SN | Land Use | Area (sq. m) |
|---|---|---|
| 1 | Cultivation | 45078.14 |
| 2 | Fill | 100792.46 |
| 3 | Forest | 725266.03 |
| 4 | Landslide | 88282.85 |
| 5 | Road | 28300.07 |
| 6 | Settlement | 3481.67 |
| 7 | Stream | 18207.69 |
| 8 | Wall | 64.59 |
Table 2.5: Area of land use in Chattiwan.
Bhawanchuli site
Bhuwnchuli site was selected on the basis of existing landslide area along the road alignment and impact of landslide on settlement and cultivable land. Orthomosaic in Figure 2.5 provides the picture of the site at the time of survey. By using orthomosaic, land use of the study area was digitized which is presented in Figure 2.6. The major land use was found out to be forest which covers the 0.298 sq. km. Other land use on Bhawanchuli site were cultivation, settlement, stream, bagar, Barren land, river, landslide, fill, road etc. The parameter landslide indicates the existing landslide in the study area which covers the 0.229 sq.km. (Table 2.6) provides the area covered by the land use pattern in surveyed area.

Figure 2-5: Orthophoto of Bhawanchuli.

Figure 2-6: Land use map of Bawanchuli.
| SN | Land use | Area (Sq.m) |
|---|---|---|
| 1 | Bagar | 1119.99 |
| 2 | Barren land | 17016.96 |
| 3 | Bush | 79750.55 |
| 4 | Cultivation | 533023.08 |
| 5 | Fill | 9457.93 |
| 6 | Forest | 298053.21 |
| 7 | Landslide | 22943.37 |
| 8 | River | 39350.43 |
| 9 | Road | 64304.66 |
| 10 | Settlement | 19168.77 |
| 11 | Stream | 14883.21 |
Table 2.6: Area of land use in Bhawanchuli.
| SN | Land use | Area (sq.m) |
|---|---|---|
| 1 | Bagar | 95465.08 |
| 2 | Barren land | 84159.07 |
| 3 | Bush | 334112.92 |
| 4 | Cultivation | 519529.53 |
| 5 | Fill | 32460.09 |
| 6 | Landslide | 6605.13 |
| 7 | River | 36547.21 |
| 8 | Road | 25726.34 |
| 9 | Settlement | 29055.56 |
| 10 | Stream | 27133.43 |
Table 2.7: Area of different land use in Gurji.
Gurji site
Gurji site was selected on the basis of existing landslide area along the road alignment and impact of landslide on settlement and cultivable land. Orthomosaic in Figure 2.7 provides the picture of the site at the time of survey. By using orthomosaic, land use of the study area was digitized which is presented in Figure 2.8. The major land use was cultivation which covers the 0.520 sq. km. Other land use on Gurji site were cultivation, settlement, stream, bagar, Barren land, river, landslide, fill, road etc.

Figure 2-7: Orthophoto of Gurji.

Figure 2-8: Land use map of Gurji.
The parameter landslide indicates the existing landslide in the study area which covers the 0.066 sq.km. The Table 2.8 provides the area covered by the land use pattern in surveyed area.
Hakpara site
Hakpara site was selected on the basis of existing landslide area along the road alignment and impact of landslide on road. Orthomosaic in (Figure 2.9) provides the picture of the site at the time of survey.

Figure 2-9: Orthophoto of Hakpara.
By using orthomosaic, land use of the study area was digitized which is presented in (Figure 2.10). The major land use was forest which covers the 0.452 sq. km. Other land use on Gurji site were cultivation, settlement, stream, bagar, Barren land, river, landslide, fill, road, pond etc. The parameter landslide indicates the existing landslide in the study area which covers the 0.451 sq.km. (Table 2.8) provides the area covered by the different land use pattern in surveyed section i.e. site IV.

Figure 2-10: Land use of Hakpara.
| SN | Land Use | Area (sq.m) |
|---|---|---|
| 1 | Barren land | 413774.04 |
| 2 | Cultivation | 213809.20 |
| 3 | Fill | 30891.62 |
| 4 | Forest | 513887.96 |
| 5 | Landslide | 45172.42 |
| 6 | Pond | 1776.37 |
| 7 | River | 51673.84 |
| 8 | Road | 22391.05 |
| 9 | Settlement | 16497.36 |
| 10 | Stream | 4639.13 |
Table 2.8: Area of different land use in Hakpara.
Topographical map preparation for hazard mapping
For topographic map preparation, GIS based technique was used to process the DEM generated by the PixdD mapper. PixdD Mapper uses Structure from Motion algorithm (SFM) to reconstruct the actual surface from a large number of overlapping photos. The software locates matching features on each image and uses iterative bundle block adjustment to estimate image orientation, exterior orientation parameters and building model geometry. The GCPs are entered to aero triangulation which enables precise calculation of the exterior orientation parameters and improves spatial geo-referencing accuracy. The final step generates the digital surface model (DSM) by building the model texture and exporting a 3D model (mesh) or orthomosaic.
Photogrammetry produces only a surface envelope and cannot capture terrain under vegetation cover. So, UAV point cloud data were manually classified in different classes for filtering vegetation cover and buildings. The elevation model generated from all point cloud data was labelled the digital surface model (DSM) and the model from ground point cloud data was termed the digital terrain model (DTM).
From the finding, it can be observed that the accuracy of the topographical survey is formidable, with the Root Mean Square Error (RMSE) of the survey for the individual sites as 0.001m, 0.045 m, 0.044 m and 0.408 m respectively. Meanwhile, the errors in the X, Y and Z of the sites are good enough, and the survey conducted can hence be said to be of the survey-grade accuracy. For the absolute accuracy of the survey, the Differential GPS (DGPS) played the vital role. (Table 2.9) shows the co-ordinate of ground control point used during process of UAV imagery. After completion of processing of image PixdD mapper provided the mean root mean square error (RMS) of the geo-referencing as presented in Figure 2.11 and error calculation also presented in Figure 2.12.

Figure 2-11: Mean RMS error.

Figure 2-12: Calculation of RMS error.
| Pont | Easting | Northing | Z | Remarks | Sitei |
|---|---|---|---|---|---|
| 2015 | 320267.2631 | 3026996.484 | 402.5869 | GCP-1 | Chattiwan |
| 2016 | 319406.3871 | 3026951.777 | 467.9689 | GCP-2 | Chattiwan |
| 2017 | 319869.7026 | 3026401.22 | 415.0704 | GCP-3 | Chattiwan |
| 2020 | 330379.9078 | 3026877.302 | 312.1119 | GCP-4 | Bhawanchuli |
| 2021 | 330623.4246 | 3027002.017 | 353.7346 | GCP-5 | Bhawanchuli |
| 2022 | 330721.9609 | 3026695.83 | 385.9781 | GCP-6 | Bhawanchuli |
| 2025 | 345648.568 | 3020631.688 | 165.5747 | GCP-7 | Gurji |
| 2026 | 345588.3088 | 3020318.824 | 169.1284 | GCP-8 | Gurji |
| 2027 | 345587.9736 | 3020318.376 | 167.0681 | GCP-9 | Gurji |
| 2030 | 355626.2952 | 3016145.932 | 154.7943 | GCP-11 | Hakpara |
| 2031 | 355514.7932 | 3015838.767 | 150.4054 | GCP-12 | Hakpara |
| 2032 | 355763.8028 | 3016396.631 | 161.8068 | GCP-13 | Hakpara |
| 2033 | 356252.32 | 3016952.48 | 155.8397 | GCP-14 | Hakpara |
Table 2.9: Co-ordinate of ground control point.
Elevation
Topographic relief of the study area divided into different classes is often used to describe and reflect the macroscopic features of the terrain surface, which is of great significance for landslide sensitivity analysis. Elevation model is one of the major outputs of this study. Whole study area can be generalized with reference of the elevation model. The study area lies in the range of 95-533 m from the mean sea level.
Four different sites have different elevation range. The elevation difference of first selected site (Chattiwan) is 268.15 m starting from 264.52 m to 532.87 m. Similarly, second, third and fourth site have the elevation difference of 213.07 m, 137.872 m, 296.56 m. Fourth surveyed area lies in the lowest elevation range where first site lies on the highest elevation range. Four different sites have different elevation difference values which directly impact the accuracy and final output of the result as well as the details that are visible in the final Orthomosaic. The resolution of output is based on the ground sampling distance (GSD). In this study resolution of the orthomosaic is one times of GSD and DTM/DEM is three times of GSD. Because of the unequal elevation difference in four different sites, they have different GSD as well as resolution of output. GSD of first, second, third and fourth site is 6.08 cm/pixel, 5.6 cm/pixel, 4.42 cm/pixel, 7.25 cm/pixel respectively (Figure 2.13(a-d)) (Table 2.10-2.13).

Figure 2-13: Elevation class of (a) Chattiwan (b) Bhawanchuli (c) Gurji (d) Hakpara.
| OID | Class | Count | Area | Lanslide Count | Landslide Area | % of Landslide |
|---|---|---|---|---|---|---|
| 1 | 264.52-300 | 3006237 | 100104.54 | 0 | 0.00 | 0.00 |
| 2 | 300-350 | 8835361 | 294208.25 | 141 | 2468.60 | 4.87 |
| 3 | 350-400 | 9450595 | 314694.89 | 662 | 11590.18 | 22.84 |
| 4 | 400-450 | 8318476 | 276996.52 | 1574 | 27557.32 | 54.31 |
| 5 | 450-500 | 5496379 | 183023.65 | 521 | 9121.58 | 17.98 |
| 6 | 500-532.87 | 3477220 | 115787.78 | 0 | 0.00 | 0.00 |
| Total | 1284815.63 | 50737.67 | 100.00 | |||
Table 2.10: Occurrence of landslide with elevation in Chattiwan site.
| OID | Class | Count | Area | Landslide Count | Landslide Area | % of Landslide |
|---|---|---|---|---|---|---|
| 1 | 205.726-250 | 10648623 | 300940.44 | 0 | 0.00 | 0.00 |
| 2 | 250-300 | 14169477 | 400443.19 | 136 | 3068.25 | 10.56 |
| 3 | 300-350 | 6272317 | 177261.78 | 402 | 9069.40 | 31.21 |
| 4 | 450-500 | 5746558 | 162403.32 | 750 | 16920.52 | 58.23 |
| 5 | 500-418.803 | 660594 | 18669.03 | 0 | 0.00 | 0.00 |
| Total | 1059717.75 | 29058.17 | 100.00 | |||
Table 2.11: Occurrence of landslide with elevation in Bhawanchuli site.
| OID | Class | Count | Area | Landslide Count | Landslide Area | % of Landslide |
|---|---|---|---|---|---|---|
| 1 | 146.29-150 | 21437 | 376.13 | 0 | 0.00 | 0.00 |
| 2 | 150-200 | 47255212 | 829123.49 | 823 | 21526.44 | 82.38 |
| 3 | 200-250 | 22447863 | 393862.38 | 83 | 2170.95 | 8.31 |
| 4 | 250-284.14 | 3180753 | 55808.38 | 93 | 2432.51 | 9.31 |
| Total | 1279170.38 | 26129.91 | 100.00 |
Table 2.12: Occurrence of landslide with elevation in Gurji site.
| OID | Class | Count | Aera | Landslide Count | Landslide Area | % of landslide | ||
|---|---|---|---|---|---|---|---|---|
| 1 | 97.89-150 | 11737564 | 555311.20 | 0 | 0.00 | 0.00 | ||
| 2 | 150-200 | 5764728 | 272732.74 | 800 | 27846.08 | 61.44 | ||
| 3 | 200-250 | 6758379 | 319742.97 | 282 | 9815.74 | 21.66 | ||
| 4 | 250-300 | 3409414 | 161301.42 | 171 | 5952.10 | 13.13 | ||
| 5 | 300-394.437 | 3510992 | 166107.14 | 49 | 1705.57 | 3.76 | ||
| Total | 1475195.46 | 45319.50 | 100.00 | |||||
Table 2.13: Occurrence of landslide with elevation in Hapkara site.
Slope
In our study area, slope was classified in six categories as very gentle, gentle, moderate, moderately steep, steep, and very steep are shown in Figure 2.14(a)-2.14(d) respectively, for site Chattiwan, Bhawanchuli, Gurji and Hakpara respectively. Due to the steep road side slope, there were many landslides active in the study area. In Chattiwan site around 2 km of road section has the steep roadside slope and Bhawanchuli, Gurji and Hakpara also have steep slope. The slope angle map was extracted from the DEM.

Figure 2-14: Elevation class of (a) Chattiwdan (b) Bhawanchuli (c) Gurji (d) Hakpara.
The slope map was re-classified into six classes: (1)0◦–5◦ (Very gentle), (2)5◦–10◦ (Gentle), (3)10◦–15◦, (Moderate) (4) 15◦–25◦ (Moderate Steep), (5) 25◦–35◦ (Steep), and (6) > 35◦ (Very steep). The maximum slope gradient is 86.56 in Hakpara. The result shows that maximum percentage of landslides occurred when the slope is between greater than 35◦ (Very Steep). In Chattiwan 45.96 % of existing landslide lied in steep slope and in Bhawanchuli, Gurji and Hakpara, 37.73 %, 37.14%, 68.51% of landslide lies in steep slope as shown in Table 2.14- 2.17 respectively. Moreover, in Tables aforementioned (Table 2.14- 2.17), area of individual class of slope were calculated on the basis of number of cell (Count) and existing landslide area in respective class which were calculated on the basis of number of cells (Landslide count) of landslide present in the individual class.
| OID | Class | Count | Area | Landslide Count | Landslide Area | % of Landslide |
|---|---|---|---|---|---|---|
| 1 | Very gentle | 1851187 | 61642.58 | 165 | 2888.79 | 5.69 |
| 2 | Gentle | 2192795 | 73017.77 | 285 | 4989.73 | 9.83 |
| 3 | Moderate | 2151681 | 71648.72 | 184 | 3221.44 | 6.35 |
| 4 | Moderate Steep | 6414175 | 213585.30 | 379 | 6635.47 | 13.08 |
| 5 | Steep | 9281175 | 309053.39 | 553 | 9681.83 | 19.08 |
| 6 | Very Steep | 8424394 | 280523.48 | 1332 | 23320.42 | 45.96 |
| Total | 1009471.23 | 50737.67 | 100.00 | |||
Table 2.14: Occurrence of landslide with slope class.
| OID | Class | Count | Area | Landslide Count | Landslide Area | % of Landslide | ||||
|---|---|---|---|---|---|---|---|---|---|---|
| 1 | Very gentle | 10877641 | 307412.71 | 51 | 1150.60 | 3.96 | ||||
| 2 | Gentle | 6097483 | 172320.80 | 91 | 2053.02 | 7.07 | ||||
| 3 | Moderate | 3744409 | 105820.64 | 109 | 2459.12 | 8.46 | ||||
| 4 | Moderate Steep | 6069614 | 171533.19 | 249 | 5617.61 | 19.33 | ||||
| 5 | Steep | 5782191 | 163410.34 | 302 | 6813.33 | 23.45 | ||||
| 6 | Very Steep | 4926231 | 139220.08 | 486 | 10964.50 | 37.73 | ||||
| Total | 1059717.75 | 29058.17 | 100.00 | |||||||
Table 2.15: Occurrence of landslide with slope class.
| OID | Class | Count | Area | Landslide Count | Landslide Area | % of Landslide | ||||
|---|---|---|---|---|---|---|---|---|---|---|
| 1 | Very gentle | 27300304 | 479001.62 | 58 | 1517.05 | 5.81 | ||||
| 2 | Gentle | 9368153 | 164370.35 | 57 | 1490.90 | 5.71 | ||||
| 3 | Moderate | 6253277 | 109717.82 | 69 | 1804.77 | 6.91 | ||||
| 4 | Moderate Steep | 11629539 | 204047.84 | 171 | 4472.69 | 17.12 | ||||
| 5 | Steep | 10757931 | 188754.91 | 273 | 7140.61 | 27.33 | ||||
| 6 | Very Steep | 7596061 | 133277.84 | 371 | 9703.90 | 37.14 | ||||
| Total | 1279170.38 | 26129.91 | 100 | |||||||
Table 2.16: Occurrence of landslide with slope class.
| OID | Class | Count | Area | Landslide Count | Landslide Area | % of Landslide |
|---|---|---|---|---|---|---|
| 1 | Very gentle | 2967808 | 140408.78 | 3 | 104.42 | 0.23 |
| 2 | Gentle | 8963870 | 424086.07 | 21 | 730.96 | 1.61 |
| 3 | Moderate | 4599666 | 217612.96 | 55 | 1914.42 | 4.22 |
| 4 | Moderate Steep | 5210155 | 246495.56 | 121 | 4211.72 | 9.29 |
| 5 | Steep | 4624231 | 218775.14 | 210 | 7309.60 | 16.13 |
| 6 | Very Steep | 4815343 | 227816.77 | 892 | 31048.38 | 68.51 |
| Total | 1475195.28 | 45319.50 | 100.00 | |||
Table 2.17: Occurrence of landslide with slope class.
Aspect
The aspect includes nine faces, which are flat, north, northeast, east, southeast, south, southwest, west, and northwest. The aspect map is derived by using the spatial tool of GIS software which classified the aspect on the basis of slope with respect to the north. Aspect (slope orientation) affects the exposure to sunlight, wind and precipitation thereby indirectly affecting other factors that contribute to landslides such as soil moisture, vegetation cover and soil thickness [25-40].
In Chattiwan, maximum 31.92 % of landslide lies in the south and 26.64% on the southeast. In Bhawanchuli, maximum 18.63% of landslide lies on the west and 14.60% on the north. In Gurji, maximum percentage of landslide (28.53%) was observed in south where in Hakpara, maximum % of landslide (45.39%) was observed in southeast. Table 2.18-2.21 shows the percentage of existing landslide in each class of aspect in Chtriwan, Bhawanchuli, Gurji and Hakpara site respectively. Moreover, in Tables aforementioned (Table 2.18- 2.21), area of individual classes of aspect were calculated on the basis of number of cell (Count) and existing landslide area in respective class which were calculated on the basis of number of cells (Landslide count) of landslide present in the individual class.
| OID | Class | Count | Area | Landslide Count | Landslide Area | %of area |
|---|---|---|---|---|---|---|
| 1 | Flat | 3082 | 102.63 | 0 | 0.00 | 0.00 |
| 2 | North | 1340362 | 44632.65 | 37 | 647.79 | 1.28 |
| 3 | Northeast | 4653157 | 154945.24 | 134 | 2346.05 | 4.62 |
| 4 | East | 4792464 | 159584.02 | 315 | 5514.96 | 10.87 |
| 5 | Southeast | 4687386 | 156085.03 | 772 | 13516.04 | 26.64 |
| 6 | South | 6404393 | 213259.56 | 925 | 16194.74 | 31.92 |
| 7 | Southwest | 4122951 | 137289.94 | 471 | 8246.19 | 16.25 |
| 8 | West | 2090301 | 69604.83 | 182 | 3186.42 | 6.28 |
| 9 | Northeast | 1460731 | 48640.81 | 48 | 840.38 | 1.66 |
| 10 | North | 760582 | 25326.58 | 14 | 245.11 | 0.48 |
| Total | 1009471.30 | 50737.67 | 100 | |||
Table 2.18: Occurrence of landslide with aspect class.
| OID | Class | Count | Area | Landslide Count | Landslide Area | % of Landslide |
|---|---|---|---|---|---|---|
| 1 | Flat | 1499 | 42.36 | 0 | 0.00 | 0.00 |
| 2 | North | 3523352 | 99573.35 | 188 | 4241.41 | 14.60 |
| 3 | Northeast | 3739953 | 105694.71 | 184 | 4151.17 | 14.29 |
| 4 | East | 2204684 | 62306.51 | 138 | 3113.38 | 10.71 |
| 5 | Southeast | 1632629 | 46139.68 | 28 | 631.70 | 2.17 |
| 6 | South | 1647701 | 46565.63 | 43 | 970.11 | 3.34 |
| 7 | Southwest | 3745322 | 105846.44 | 139 | 3135.94 | 10.79 |
| 8 | West | 5803959 | 164025.52 | 240 | 5414.57 | 18.63 |
| 9 | Northeast | 10308545 | 291329.50 | 210 | 4737.74 | 16.30 |
| 10 | North | 4889927 | 138194.09 | 118 | 2662.16 | 9.16 |
| Total | 1059717.81 | 29058.17 | 100.00 | |||
Table 2.19: Occurrence of landslide with aspect class.
| OID | Class | Count | Area | Landslide Count | Landslide Area | % of Landslide |
|---|---|---|---|---|---|---|
| 1 | Flat | 12566 | 220.48 | 0 | 0.00 | 0.00 |
| 2 | North | 3209145 | 56306.54 | 8 | 209.25 | 0.80 |
| 3 | Northeast | 8633171 | 151474.61 | 63 | 1647.83 | 6.31 |
| 4 | East | 10745813 | 188542.29 | 150 | 3923.41 | 15.02 |
| 5 | Southeast | 11122644 | 195154.04 | 220 | 5754.33 | 22.02 |
| 6 | South | 11104278 | 194831.79 | 285 | 7454.48 | 28.53 |
| 7 | Southwest | 10115802 | 177488.34 | 106 | 2772.54 | 10.61 |
| 8 | West | 8406274 | 147493.55 | 124 | 3243.35 | 12.41 |
| 9 | Northeast | 6522922 | 114448.92 | 37 | 967.77 | 3.70 |
| 10 | North | 3032650 | 53209.82 | 6 | 156.94 | 0.60 |
| Total | 1279170.38 | 26129.91 | 100 | |||
Table 2.20: Occurrence of landslide with aspect class.
| OID | Class | Count | Area | Landslide Count | Landslide Area | % of landslide |
|---|---|---|---|---|---|---|
| 1 | Flat | 84665 | 4005.55 | 0 | 0.00 | 0.00 |
| 2 | North | 474731 | 22459.81 | 0 | 0.00 | 0.00 |
| 3 | Northeast | 2110806 | 99863.50 | 68 | 2366.92 | 5.22 |
| 4 | East | 8041478 | 380447.15 | 362 | 12600.35 | 27.80 |
| 5 | Southeast | 14567361 | 689190.59 | 591 | 20571.29 | 45.39 |
| 6 | South | 3229026 | 152767.16 | 239 | 8319.02 | 18.36 |
| 7 | Southwest | 1224187 | 57917.02 | 41 | 1427.11 | 3.15 |
| 8 | West | 663194 | 31376.11 | 1 | 34.81 | 0.08 |
| 9 | Northeast | 504244 | 23856.09 | 0 | 0.00 | 0.00 |
| 10 | North | 281385 | 13312.49 | 0 | 0.00 | 0.00 |
| Total | 1475195.46 | 45319.50 | 100.00 | |||
Table 2.21: Occurrence of landslide with aspect class.
With the reference of all results in study area more landslides were seen in the south and southeast direction than in other direction. Aspect map of Chattiwan site, Bhawanchuli site, Gurji site and Hakpara site are shown in Figure 2.15 (a-d).

Figure 2-15: Aspect class of (a) Chattiwan (b) Bhawanchuli (c) Gurji (d) Hakpara.
Curvature
The plan curvature is defined as the rate of change of the slope angle, which directly affects surface runoff and the development of landslides [41-42]. Plan curvature is classified in three categories such as concave, flat and convex. In this study Arc GIS with its spatial analysis tool was applied to derive plan curvature in which negative curvatures value represents concave, around zero (-0.1 – 0.1) curvatures value represent flat and positive curvatures value represent convex surface. Concave and convex surfaces of the earth are more influential in boosting landslide to occur.
DEM produced by PixdD mapper was used to derive plan curvature of the study area. (Figure 2.16 (a), (b), (c), and (d)) respectively show the curvature map of Chattiwan, Bhawanchuli, Gurji and Hakpara respectively. In Chattiwan, curvature map has a range between (-6832.5205-2052.60) and other site Bhawanchuli, Gurji and Hakpara has a range between -9648.43 to 2388.418, -21820.94 to4162.69 and -9313.7666 to 8246.3730 respectively. Among four study site, maximum area of existing landslide in concave area was higher in Chattiwan, Gurj and Hakpara while convex was higher in Bhawanchuli site.

Figure 2-16: Curvature class of (a) Chattiwan (b) Bhawanchuli (c) Gurji (d) Hakpara.
The percentage of existing landslide in three class of Curvature are presented in (Table 2.22- 2.25) for four site, Chattiwan, Bhawanchuli, Gurji and Hakpara. Moreover, in Tables aforementioned, area of individual classes of curvature were calculated on the basis of number of cells (Count) and existing landslide area in respective class which were calculated on the basis of number of cells (Landslide count) of landslide present in the individual class.
| OID | Class | Count | Area | Landslide Count | Landslide Area | % of Landslide |
|---|---|---|---|---|---|---|
| 1 | Concave | 13824794 | 460351.13 | 1638 | 28677.82 | 56.52 |
| 2 | Flat | 95602 | 3183.45 | 2 | 35.02 | 0.07 |
| 3 | Convex | 16395012 | 545936.69 | 1258 | 22024.84 | 43.41 |
| Total | 1009471.27 | 50737.67 | ||||
Table 2.22: Occurrence of landslide with curvature class in Chattiwan site.
| OID | Class | Count | Area | Landslide Count | Landslide Area | % of Landslide |
|---|---|---|---|---|---|---|
| 1 | Concave | 19401493 | 548305.05 | 642 | 14483.96 | 49.84 |
| 2 | Flat | 14303 | 404.22 | 0 | 0.00 | 0.00 |
| 3 | Convex | 18081774 | 511008.51 | 646 | 14574.21 | 50.16 |
| Total | 1059717.78 | 29058.17 | 100.00 | |||
Table 2.23: Occurrence of landslide with curvature class in Bhawanchuli site.
| OID | Class | Count | Area | Landslide Count | Landslide Area | % of Landslide |
|---|---|---|---|---|---|---|
| 1 | Concave | 39167655 | 687222.03 | 500 | 13078.03 | 50.05 |
| 2 | Flat | 81766 | 1434.64 | 0 | 0.00 | 0.00 |
| 3 | Convex | 33655842 | 590513.68 | 499 | 13051.88 | 49.95 |
| Total | 1279170.34 | 26129.91 | 100 | |||
Table 2.24: Occurrence of landslide with curvature class in Gurji site.
| OID | Class | Count | Area | Landslide Count | Landslide Area | % of Landslide |
|---|---|---|---|---|---|---|
| 1 | Concave | 15336007 | 725555.69 | 659 | 22938.21 | 50.61 |
| 2 | Flat | 139884 | 6618.00 | 1 | 34.81 | 0.08 |
| 3 | Convex | 15705186 | 743021.77 | 642 | 22346.48 | 49.31 |
| Total | 1475195.46 | 45319.50 | 100.00 | |||
Table 2.25: Occurrence of landslide with curvature class in Hapkara site.
Distance from road
The study area encompasses Madan Bhandari Highway which passes through the Chure area. Chure is the most fragile area. Changing of land use system and land cover due road construction have triggered landslide in Chure area. Due to rugged terrain, roads in the chure are characterized by high gradient, steep slopes, sharp curves including unstable geological features, mass movements, debris flow, etc. There are frequent provision/occurrence of heavy cut and fills in the hill roads which are not mechanically compacted. These loose materials cause numerous landslides in the hills. Equally, the excessive cut areas are exposed to heat and rain effects which causes slope instability, ultimately landslides are inevitable.
The layer of the road from the land use map was used to generate the distance from the road. The distance from road was classified into the separate classes to identify the impact of the road in the landslide. (Figure 2.17 (a-d)) respectively shows the distance from road map for Chattiwan, Bhawanchuli, Gurji and Hakpara respectively. Road network layer was developed by digitizing the road from orthomosaic. The vector layer of road was used to create Euclidean distance raster. In this study Arc GIS with its spatial analysis tool was applied to derive the Euclidean distance. The distance from road was reclassified into six

Figure 2 17: Distance from road map of (a) Chattiwan (b) Bhawanchuli (c) Gurji (d) Hakpara.
classes which represent the range of distance from road. In the study area, it was observed that the landslides generally occur near the road. In Chattiwan, Bhawanchuli, Gurji and Hakpara, higher percentage of landslides were seen near the road (0-50m). The percentage of existing landslide in different interval of distance from road are presented in Table 2.26-2.29 for four site, Chattiwan, Bhawanchuli, Gurji and Hakpara. Moreover, in Tables aforementioned, area of individual classes of distance from road were calculated on the basis of number of cell (Count) and existing landslide area in respective class which were calculated on the basis of number of cells (Landslide count) of landslide present in the individual class.
| OID | Class | Count | Area | Landslide Count | Landslide Area | %of landslide |
|---|---|---|---|---|---|---|
| 1 | 0-50 | 25304 | 478404.11 | 2728 | 47761.34 | 94.13 |
| 2 | 50-100 | 21781 | 411797.34 | 170 | 2976.33 | 5.87 |
| 3 | 100-200 | 28417 | 537259.31 | 0 | 0.00 | 0.00 |
| 4 | 200-300 | 9691 | 183220.61 | 0 | 0.00 | 0.00 |
| 5 | 2790 | 52748.48 | 0 | 0.00 | 0.00 | |
| 6 | 1016 | 19208.76 | 0 | 0.00 | 0.00 | |
| Total | 1682638.60 | 50737.67 | 100.00 | |||
Table 2.26: Occurrence of landslide with distance from the road in Chattiwan.
| OID | Class | Count | Area | Landslide Count | Landslide Area | % of Landslide |
|---|---|---|---|---|---|---|
| 1 | 0-50 | 20314 | 555207.33 | 683 | 17864.59 | 70.12 |
| 2 | 50-100 | 14376 | 392914.28 | 193 | 5048.12 | 19.82 |
| 3 | 100-200 | 18456 | 504425.84 | 33 | 863.15 | 3.39 |
| 4 | 200-300 | 8012 | 218978.10 | 65 | 1700.14 | 6.67 |
| 5 | 300-400 | 2832 | 77402.14 | 0 | 0.00 | 0.00 |
| Total | 1748927.69 | 25476.01 | 100.00 | |||
Table 2.27: Occurrence of landslide with distance from the road in Bhawanchuli.
| OID | Class | Count | Area | Landslide Count | Landslide Area | % of landslide | |
|---|---|---|---|---|---|---|---|
| 1 | 0-50 | 14193 | 539150.18 | 617 | 21476.29 | 51.55 | |
| 2 | 50-100 | 10914 | 414590.65 | 243 | 8458.25 | 20.30 | |
| 3 | 100-200 | 15670 | 595257.05 | 163 | 5673.64 | 13.62 | |
| 4 | 200-300 | 10897 | 413944.87 | 174 | 6056.52 | 14.54 | |
| 5 | >300 | 9181 | 348759.09 | 0 | 0.00 | 0.00 | |
| Total | 2311701.83 | 41664.70 | 100.00 | ||||
Table 2.28: Occurrence of landslide with distance from the road in Gurji.
| OID | Class | Count | Area | Landslide Count | Landslide Area | %of landslide |
|---|---|---|---|---|---|---|
| 1 | 0-50 | 24075 | 455168.31 | 3953 | 69208.43 | 83.80 |
| 2 | 50-100 | 19982 | 377784.97 | 427 | 7475.84 | 9.05 |
| 3 | 100-200 | 29001 | 548300.56 | 337 | 5900.14 | 7.14 |
| 4 | 200-300 | 10254 | 193864.83 | 0 | 0.00 | 0.00 |
| 5 | 3354 | 63411.61 | 0 | 0.00 | 0.00 | |
| 6 | 1834 | 34674.09 | 0 | 0.00 | 0.00 | |
| Total | 1673204.37 | 82584.41 | 100.00 | |||
Table 2.29: Occurrence of landslide with distance from the road in Hakpara.
Distance from stream
The Madan Bhandari Highway crosses the lot of stream in sindhuli- Hetauda section. In this study, stream layer was developed by digitizing the stream and river from orthomosaic. The vector layer of stream and river was used to create Euclidean stream distance raster. In this study Arc GIS with its spatial analysis tool was applied to derive the Euclidean distance. The distance from stream was reclassified into six classes which represent the range of distance from stream. (Figure 2.18(ad)) respectively shows the distance from stream map for Chattwan, Bhawanchuli, Gurji and Hakpara respectively.

Figure 2 18: Distance from stream map of (a) Chattiwan (b) Bhawanchuli (c) Gurji (d) Hakpara.
The role played by rivers in creating a conductive environment for landslide occurrence has great significance. The maximum number of landslides in the close proximity of rivers, as can be seen in Table 2.30-2.33 for different site, shows how rivers are contributing to land sliding. Moreover, in Tables aforementioned, area of individual classes of distance from stream were calculated on the basis of number of cell (Count) and existing landslide area in respective class which were calculated on the basis of number of cells (Landslide count) of landslide present in the individual class.
| OID | Class | Count | Area | Landslide Count | Landslide Area | % of Landslide |
|---|---|---|---|---|---|---|
| 1 | 0-100 | 20742 | 392153.73 | 59 | 1032.96 | 2.04 |
| 2 | 100-200 | 22298 | 421571.88 | 2012 | 35225.74 | 69.43 |
| 3 | 200-300 | 17702 | 334678.69 | 564 | 9874.41 | 19.46 |
| 4 | 300-400 | 12561 | 237481.58 | 156 | 2731.22 | 5.38 |
| 5 | 400-500 | 8260 | 156165.74 | 34 | 595.27 | 1.17 |
| 6 | 500-600 | 7436 | 140586.98 | 73 | 1278.07 | 2.52 |
| Total | 1682638.60 | 50737.67 | 100.00 | |||
Table 2.30: Occurrence of landslide with distance from the stream in Chattiwan site.
| OID | Class | Count | Area | Landslide Count | Landslide Area | % of Landslide |
|---|---|---|---|---|---|---|
| 1 | 0-100 | 39121 | 915753.58 | 506 | 11415.71 | 40.03 |
| 2 | 100-200 | 23491 | 549882.86 | 621 | 14010.19 | 49.13 |
| 3 | 200-300 | 11460 | 268258.38 | 46 | 1037.79 | 3.64 |
| 4 | 300-400 | 4274 | 100046.80 | 69 | 1556.69 | 5.46 |
| 5 | 400-500 | 1814 | 42462.54 | 22 | 496.34 | 1.74 |
| 6 | 500-600 | 339 | 7935.39 | 0 | 0.00 | 0.00 |
| Total | 1884339.54 | 28516.71 | 100.00 | |||
Table 2.31: Occurrence of landslide with distance from the stream in Bhawanchuli site.
| OID | Class | Count | Area | Landslide Count | Landslide Area | % of Landslide |
|---|---|---|---|---|---|---|
| 1 | 0-100 | 22133 | 604922.90 | 159 | 4158.81 | 16.32 |
| 2 | 100-200 | 10563 | 288700.16 | 29 | 758.53 | 2.98 |
| 3 | 200-300 | 10725 | 293127.82 | 151 | 3949.57 | 15.50 |
| 4 | 300-400 | 10961 | 299578.00 | 509 | 13313.44 | 52.26 |
| 5 | 400-500 | 8271 | 226056.90 | 126 | 3295.66 | 12.94 |
| 6 | 500-600 | 2844 | 77730.12 | 0 | 0.00 | 0.00 |
| Total | 1790115.91 | 25476.01 | 100.00 | |||
Table 2.32: Occurrence of landslide with distance from the stream in Gurji site.
| OID | Class | Count | Area | Landslide Count | Landslide area | % of landslide |
|---|---|---|---|---|---|---|
| 1 | 0-100 | 22211 | 843730.33 | 736 | 25618.40 | 61.49 |
| 2 | 100-200 | 13579 | 515826.13 | 456 | 15872.27 | 38.10 |
| 3 | 200-300 | 11271 | 428152.02 | 5 | 174.04 | 0.42 |
| 4 | 300-400 | 10009 | 380212.37 | 0 | 0.00 | 0.00 |
| 5 | 400-500 | 8917 | 338730.51 | 0 | 0.00 | 0.00 |
| Total | 2506651.36 | 41664.70 | 100.00 |
Table 2.33: Occurrence of landslide with distance from the stream in Hapkara site.
Geology Map
The lithology of the study area comprises three lithological units. These are
• Quaternary (Q): Alluvial boulders, gravels, sands and clay
• Middle Siwaliks (MS1): Fine to medium grained friable, arkosic sandstones and hard, compact massive sandstone intercalated with green to greenish grey clays, thin bands of pseudo-conglomerates and mudstones, plants and animal’s fossils are present in clay.
• Lower Siwaliks (LS): Fine grained hard, grey, sandstones interbedded with purple and chocolate coloured shades, nodular, maroon clays and psedo conglomerates.
From Figure 2.19, it can be seen that Chattiwan site has two lithological units: Middle Siwalik and Quaternary, in which 97.38% of existing landslides were found in Middle Siwalik. In Bhawanchuli site, 92.8 % of existing Landslides were found in Middle Siwalik while others were in Quaternary. All area of Gurji site was found in Quaternary. In Hakpara Site, 82.12% of existing landslides were found in Lower Siwalik. Occurrence of landslide with lithology is presented in (Table 2.34). Moreover, in Table 2.34, area of individual classes of geology were calculated on the basis of number of cell (Count) and existing landslide area in respective class which were calculated on the basis of number of cells (Landslide count) of landslide present in the individual class.

Figure 2-19: Geological map of the study area.
| OID | Class | Count | Area | Landslide Count | Area | % of Landslide |
|---|---|---|---|---|---|---|
| 1 | Q | 47179646 | 1571032.7 | 2822 | 49407.08 | 97.38 |
| 2 | MS1 | 3002122 | 99967.51 | 76 | 1330.59 | 2.62 |
| Total | 1671000 | 50737.67 | 100 | |||
| Site Bhawanchuli | ||||||
| OID | Class | Count | Area | Landslide Count | Landslide Area | % of Landslide |
| 1 | Q | 19474 | 455851.98 | 91 | 2053.02 | 7.2 |
| 2 | MS1 | 61026 | 1428511 | 1173 | 26463.69 | 92.8 |
| Total | 28516.71 | 100 | ||||
| Site Hakpara | ||||||
| OID | Class | Count | Area | Landslide Count | Landslide Area | % of landslide |
| 1 | Q | 30343 | 1152641 | 214 | 7448.83 | 17.88 |
| 2 | LS | 50657 | 1924309.9 | 983 | 34215.87 | 82.12 |
| Total | 3076951 | 41664.7 | 100 | |||
Table 2.34: Occurrence of landslide with geology for sites Chattiwan, Bhawanchuli & Hakpara.
| Site Gurji | ||||||
|---|---|---|---|---|---|---|
| OID | Class | Count | Area | Landslide Count | Landslide Area | % of Landslide |
| 1 | RGd | 17836 | 490786.69 | 150 | 3923.41 | 68.81 |
| 2 | Cmg | 48914 | 1345769 | 68 | 1778.61 | 31.19 |
| Total | 1836556 | 5702.02 | 100 | |||
| Site Hakpara | ||||||
| OID | OID | Count | Area | Landslide Count | Landslide Area | % of Landslide |
| 1 | RGd | 51280 | 2245891.3 | 207 | 1098.88 | 100 |
| 2 | CMg | 14752 | 261347.98 | 0 | 0 | 0 |
| 3 | PHh | 5968 | 646178.01 | 0 | 0 | 0 |
| Total | 3153417 | 1098.88 | 100 | |||
Table 2.35: Occurrence of landslide with soil type in Gurji and Hakpara.
Soil Map
In this study area, in Chattiwan and Bhawanchuli have Dystric Regosols (RGd) soils whereas Gurji and Hakpara have DystricRegosols (RGd) in both, but also GleyicCambisols (CMg) in Gurji and HaplicPhaeozems (PHh) in Hakpara as shown Figure 2.20. In three selected site of study area Chattiwan, Bhawanchuli and Hakpara, all landslides were in DystricRegosols (RGd) but in Gurji 31.19% of landslides were in GleyicCambisols (CMg). Percentages of existing landslide with each soil type in study area are presented in Table 2.36. Moreover, in Table 2.36, area of individual classes of geology were calculated on the basis of number of cell (Count) and existing landslide area in respective class which were calculated on the basis of number of cells (Landslide count) of landslide present in the individual class.

Figure 2-20: Soil map of the study area.
| Latitude | Longitude | Rainfall (mm ) | Remarks |
|---|---|---|---|
| 27.183 | 86.167 | 153.607 | BahunTilpung |
| 27.420 | 85.849 | 69.682 | Nepalthok |
| 27.294 | 85.456 | 206.419 | HariharpurGadhi Valley |
| 27.560 | 85.139 | 161.602 | ChisapaniGadhi |
| 27.619 | 85.150 | 112.411 | MarkhuGaun |
| 27.416 | 85.156 | 206.645 | MakwanpurGadhi |
| 27.535 | 84.809 | 160.4722 | Beluwa(Manahari) |
| 27.467 | 84.882 | 172.577 | Rajaiya |
Table 2.36 Rainfall data.
Rainfall Map
The rainfall data required for the analysis was obtained from Department of Hydrology and Meteorology. The monthly average precipitation of the collected data around area varies between 69.862 mm (Nepalthok) and 206.645 mm (MakawanpurGadi).
The rainfall data of eight stations available in Sindhuli and Hetauda district were collected from Department of Hydrology and Meteorology. The average monthly data of those stations were used in preparation of isohyets map known as rainfall map. The rainfall map was classified into nine classes as in Figure 2.21. The mean monthly rainfall data used in preparation of rainfall map were shown in Table 2.36.
From Figure 2.21, Chattiwan, Bhawanchuli, Gurji and Hakpara sites were situated on range of 171.40 mm-268.85 mm rainfall. In Hakpra, the average rainfall varies from 171.40 mm to 236.36 mm and in other three sites varies from 236.37 mm - 268.85 mm. So, the average rainfall of the study area is insignificant for proper analysis. As a result, rainfall is not regarded as the most important factor in sensitivity mapping.

Figure 2-21: Rainfall map of the study area.
Landslide Hazard Map
For hazard map preparation, WoE method was used in this study; positive weight (W+), negative weight (W-) and contrast value were calculated. All values were joined in each class of influencing factor and the weight maps of each influencing factor were developed by using the spatial analysis tool in GIS. During preparation of weight of each influencing factor of contrast value of each class were used. Prepared weight maps were combined with raster calculator in GIS to develop landslide hazard map. The magnitude of the contrast C was determined from the difference, W+ and W-, and provided a measure of the spatial association between a set of points and the patterns. C is positive for a positive spatial association, and negative for a negative spatial association.
In Table 2.37, Table 2.39, Table 2.41 and Table 2.43, positive weight (W+), negative weight (W-), Contrast (C) and other pixel information of landslide and non- landslide for different classes of individual influencing factor was shown.

Table 2.37: weightage table for various influencing factors for Chattiwan site.
| OID | Hazard Level | Count | Area (Sq.m) | Pecentage |
|---|---|---|---|---|
| 1 | Low | 14495 | 274046.30 | 25.14 |
| 2 | Medium | 26741 | 505572.41 | 46.39 |
| 3 | High | 16412 | 310289.61 | 28.47 |
| Total | 1089908.31 | 100.00 | ||
Table 2.38: Hazard level classification in the Chattiwan site.
Where,
W + = Positive weight
W - = Negative weight
Lpixi = Number of landslide pixel in i class
TLpix = Total number of landslide pixel (according to each factor)
NLpixi = Number of non-landslide pixel in i class
TNLpix = Total number of non-landslide pixel (according to each factor)
Lpixothers = Number of landslide pixel in the other classes
NLpixothers = Number of non-landslide pixel in the other classes
According to the (Table 2.39), 25.19 % (0.28 sq.km) of the area lies in the low hazard whereas the area under moderate and high hazard are 46.39% (0.505 sq.km) and 28.47% (0.31 sq.km) respectively. The maximum area of Chattiwan site is formed with alluvial boulders, gravel, sands and clay. From (Figure 2.22), maximum area of high level hazard is near about the road. Due to the presence of slope cut more than 35 degrees with south and southeast facing aspect has more influence to cause landslide near the newly constructed road alignment.

Figure 2-22: Hazard map of Chattiwan.

Table 2.39: Weightage table for influencing factors in Bhawanchuli site.
Figure 2.23 shows the landslide hazard map of Bhawanchuli site. According to the (Table 2.40), 23.64 % of the area lies in the low hazard whereas the areas under moderate and high hazard are 57.45% and 18.91% respectively. (Table 2.41) depicts the areal relationship of the hazard level along with the percentage of landslide occurrence in the zones.

Figure 2-23: Hazard map of Bhawanchuli site.
| OID | Hazard Level | Count | Area (Sq. m) | Percentage |
|---|---|---|---|---|
| 1 | Low | 10705 | 250585.16 | 23.64 |
| 2 | Medium | 26011 | 608871.61 | 57.45 |
| 3 | High | 8563 | 200444.72 | 18.91 |
| Total | 1059901.49 | 100.00 | ||
Table 2.40: Hazard level classification in the Bhuwanchli site.

Table 2.41: Weightage table for various influencing factors for Gurji site.
| OID | Hazard Level | Count | Area (Sq.m) | Percentage |
|---|---|---|---|---|
| 1 | Low | 5450 | 150201.34 | 11.76 |
| 2 | Medium | 33005 | 909613.82 | 71.21 |
| 3 | High | 7892 | 217502.57 | 17.03 |
| Total | 1277317.72 | 100.00 | ||
Table 2.42: Hazard level classification for Gurji site.
The maximum area of Bhawanchuli site is formed with fine grained hard, grey, sandstones interbedded with purple and chocolate coloured shades, nodular, maroon clays and psedo conglomerates. From Figure, maximum area of high level hazard is near about the road. Due to the presence very steep slope has more influence to cause landslide near the newly constructed road alignment.
According to the Figure 2.24, 11.76% of the area lies in the low hazard whereas the areas under moderate and high hazard are 71.21% and 17.03% respectively. (Table 2.43) depicts the areal relationship of the hazard along with the percentage of landslide occurrence in the zones.

Figure 2-24: Hazard map of Gurji site.

Figure 2-25: Hazard map of Hapkara site.

Table 2.43: Weightage table for influencing factors for Hapkara site.
| OID | Hazard Level | Count | Area( Sq.m) | Percentage |
|---|---|---|---|---|
| 1 | Low | 5450 | 150201.34 | 11.76 |
| 2 | Medium | 33005 | 909613.82 | 71.21 |
| 3 | High | 7892 | 217502.57 | 17.03 |
| Total | 1277317.72 | 100.00 | ||
Table 2.44: Hazard level classification for Hapkara site.
The maximum area of Gurji site is formed with fine to medium grained friable, arkosic sandstones and hard, compact massive sandstone intercalated with green to greenish grey clays, thin bands of pseudo-conglomerates and mudstones, plants and animal’s fossils are present in clay. From Figure, maximum area of high level hazard is near about the road. Due to the presence very steep slope and south facing aspect has more influence to cause landslide near the newly constructed road alignment.
Presence of Bagmai River near this
According to the (Table 2.45), 17.30 % of the area lies in the low hazard whereas the areas under moderate and high hazard are 71.16% and 11.54% respectively. (Table 2.45) depicts the areal relationship of the hazard along with the percentage of landslide occurrence in the zones.
| OID | Landcover | Count | Area (Sq.m) | OID | Value | Count | Area (Sq.m) |
|---|---|---|---|---|---|---|---|
| 1 | Forest | 7608 | 143838.86 | 1 | Forest | 21619 | 408734.52 |
| 2 | Road | 1113 | 21042.672 | 2 | Road | 472 | 8923.7566 |
| 3 | Settlement | 131 | 2476.7206 | 3 | Settlement | 43 | 812.96935 |
| 4 | Cultivation | 1229 | 23235.799 | 4 | Cultivation | 934 | 17658.451 |
| 5 | Fill | 1822 | 34447.213 | 5 | Fill | 2417 | 45696.44 |
| 6 | Deposit | 539 | 10190.476 | 6 | Deposit | 313 | 5917.6607 |
| 7 | Road slope cut | 3955 | 74774.274 | 7 | Road Slope Cut | 594 | 11230.321 |
| Total | 310006 | 8 | Stream | 296 | 5596.2542 | ||
| Total | 504570.4 | ||||||
| High Risk | Medium Risk | ||||||
Table 2.45: Risk classification for Chattiwan site.
The maximum area of Hakpara site is formed with fine grained hard, grey, sandstones inter-bedded with purple and chocolate colored shades, nodular, maroon clays and psedo conglomerates but also significant part have alluvial boulders, gravel, sands and clay. In both geological formations, there are landslides. From Figure, maximum area of high level hazard is near about the road. Due to the presence very steep slope and south facing aspect has more influence to cause landslide near the newly constructed road alignment.
Presence of Marin Khola near by the study area also possesses significant impact on the landslide hazard.
Risk Assessment
For risk assessment, hazard map was combined with land use raster map by using combine tool of GIS software which is very useful for calculating the presence of hazard level in existing land use. Land use map obtained from digitizing the orthomosaic was used to produce raster map with feature to raster tools in GIS is combined. The areas under the high and medium hazard were calculated to find the risk level on existing land use.
Chattiwan
The high risk and medium risk area of Chattiwan site on the basis of presence of hazard level on land use as shown in Table 2.45. The forest area of 0.143 sq. km was found to be in high risk while 0.408 sq. km of the forest areas was found to be in medium risk of landslide hazard in the Chhattiwan site. The 0.0210 sq. km of road was observed to be high risk while 0.0089 sq. km of road was observed to be in medium risk. The settlement area of .00247 sq. km was found to be in high risk and 0.000812 sq. km was found to be in medium risk. The cultivable area of 0.0232 sq. km was prone to high risk of landslide hazard and 0.0176 sq. km of cultivable areas prone to the medium risk. The big portion of the forest area in the study section is prone to the high risk of landslide hazard. The greater portion of the total settlement area is prone to the high risk of landslide hazard as compared to area bearing medium risk. The larger portion of the total cultivation area is prone to the medium risk of landslide hazard in the study area.
Bhawanchuli
The high risk and medium risk area of Bhawanchuli site on the basis of presence of hazard level on land use is shown in Table 2.46. The forest area of 0.082982 sq. km was observed to be in medium risk of landslide hazard while the forest area of 0.183614 sq. km was in medium risk. The cultivation area of 0.065519 sq. km was in high risk and 0.317649 sq. km was in medium risk. The road area of 0.011587 sq. km was in high risk and 0.01374 sq. km in medium risk. The river area of 0.000397 sq. km was in high risk while 0.018258 sq. km in medium risk. The settlement area of 0.00599251 sq. km was found to be in high risk whereas the area of 0.011025 sq. km was in medium risk. The greater portion of total cultivation, settlement, road and river area are in medium risk while the greater portion of forest area in this section is in high risk.
| OID | Land cover | Count | Area (Sq.m) | OID | Land cover | Count | Area |
|---|---|---|---|---|---|---|---|
| 1 | Cultivation | 2799 | 65519.65 | 1 | Cultivation | 13570 | 317649.75 |
| 2 | Settlement | 256 | 5992.51 | 2 | Road | 587 | 13740.63 |
| 3 | Road | 495 | 11587.08 | 3 | Settlement | 471 | 11025.28 |
| 4 | Bush | 300 | 7022.47 | 4 | Forest | 7844 | 183614.2 |
| 5 | Forest | 3545 | 82982.19 | 5 | Stream | 376 | 8801.5 |
| 6 | River | 17 | 397.94 | 6 | River | 780 | 18258.42 |
| 7 | Barren Land | 69 | 1615.17 | 7 | Road Cut Slope | 315 | 7373.59 |
| 8 | Fill | 357 | 8356.74 | 8 | Fill | 54 | 1264.04 |
| 9 | Road Cut Slope | 660 | 15449.44 | 9 | Bush | 1514 | 35440.07 |
| 10 | Stream | 24 | 561.8 | 10 | Bagar | 40 | 936.33 |
| 11 | Bagar | 9 | 210.67 | 11 | Barren Land | 331 | 7748.13 |
| Total | 199695.7 | Total | 605852 | ||||
| High Risk | Medium Risk | ||||||
Table 2.46: Risk classification for Bhawanchuli site.
Gurji
The high risk and medium risk area of Gurji site on the basis of presence of hazard level on land use is shown in Table 2.47. In the Gurji study section, 0.004078 sq. km. of the road area was found to be in high risk and 0.021193 sq. km was found to be in medium risk. 0.081081 sq. km of total cultivation area in the Gurji study section was found to be in high risk while 0.359573 sq. km of it was in medium risk. The river area of 0.000992 sq. km was in high risk and 0.031197 sq. km was in medium risk.
| OID | Land cover | Count | Area (Sq.m) | OID | Land cover | Count | Area (Sq.m) |
|---|---|---|---|---|---|---|---|
| 1 | Bagar | 13 | 358.28 | 1 | Bagar | 2810 | 77443.26 |
| 2 | Road | 148 | 4078.86 | 2 | Road | 769 | 21193.55 |
| 3 | Cultivation | 2942 | 81081.16 | 3 | Cultivation | 13047 | 359573.74 |
| 4 | Stream | 87 | 2397.71 | 4 | Stream | 881 | 24280.25 |
| 5 | Bush | 3621 | 99794.32 | 5 | Bush | 7748 | 213533.94 |
| 6 | Barren Land | 129 | 3555.22 | 6 | Barren Land | 2421 | 66722.47 |
| 7 | Fill | 319 | 8791.6 | 7 | Fill | 841 | 23177.86 |
| 8 | River | 36 | 992.16 | 8 | River | 1132 | 31197.78 |
| 9 | Road Cut Slope | 175 | 4822.98 | 9 | Landslide | 53 | 1460.67 |
| 10 | Settlement | 362 | 9976.68 | 10 | Settlement | 684 | 18850.96 |
| Total | 215849 | Total | 837434.5 | ||||
| High Risk | Medium Risk | ||||||
Table 2.47: Risk classification for Gurji site.
The settlement area of 0.009976 sq. km was in high risk of the landslide hazard in the Gurji section while the remaining 0.01885 sq. km was in medium risk of the landslide hazard. The larger portion of total area remained in medium risk of landslide hazard in Gurji section of the study area.
Hakpara
The high risk and medium risk area of Hakpara site on the basis of presence of hazard level on land use is shown in Table 2.48. In Hapkara section of the study area, the road area of 0.001503 sq. km was found to be in high risk of landslide hazard and 0.019407 sq. km was in medium risk.
| OID | Land cover | Count | Area (Sq.m) | OID | Land cover | Count | Area (Sq.m) |
|---|---|---|---|---|---|---|---|
| 1 | Road | 34 | 1503.08 | 1 | Road | 439 | 19407.48 |
| 2 | Barren Land | 63 | 2785.13 | 2 | Barren Land | 7042 | 311315.42 |
| 3 | Forest | 2426 | 107249.53 | 3 | Forest | 7967 | 352208.17 |
| 4 | Stream | 22 | 972.58 | 4 | Stream | 71 | 3138.8 |
| 5 | Cultivation | 200 | 8841.68 | 5 | Cultivation | 3959 | 175020.98 |
| 6 | River | 4 | 176.83 | 6 | River | 812 | 35897.2 |
| 7 | Pond | 9 | 397.88 | 7 | Pond | 36 | 1591.5 |
| 8 | Road Cut Slope | 682 | 30150.12 | 8 | Landslide | 362 | 16003.43 |
| 9 | Fill | 281 | 12422.55 | 9 | Fill | 400 | 17683.35 |
| 10 | Settlement | 22 | 972.58 | 10 | Settlement | 310 | 13704.6 |
| Total | 165472 | Total | 945970.9 | ||||
| High Risk | Medium Risk | ||||||
Table 2.48: Risk classification for Hakpara site.
The forest area of 0.107249 sq. km was prone to high risk of landslide hazard and 0.352208 sq. km was prone to medium risk. The cultivation area of 0.008841 sq. km was in high risk and remaining 0.175020 sq. km was in medium risk. The river area of 0.000176 sq. km was in high risk and 0.035897 was in medium risk. The pond area of 0.000397 was prone to the landslide with high risk in the study area while 0.001597 sq. km was in medium risk. The settlement area of 0.000972 sq. km was in high risk whereas 0.013704 sq. km area of the settlement zone was in medium risk of landslide hazard in the Hapkara section of the study area.
Discussion on results
Although this study has not explored and discussed the different topographic data collection method for landslide hazard mapping method, it shows that perhaps, photogrammetric techniques and aerial photographs promise to be more efficient for discerning boundaries of recently active landslides and prepare a topographic factor map (slope, aspect, curvature and elevation. Classical surveying techniques can only provide data measurements with a very low sampling, and may not provide detailed information for deformation description in the landslide area along the road. UAV have alternative advantages in capturing high-density 3D point cloud data that opens substantial potential for the applications of natural hazards assessment like landslides (Pirasteh & Li, 2017). Pirasteh & Li, 2017 also shows that 3D with high-resolution data with centimeter in pixel size and detailed information can perform a better quality of generating DEM derivatives and further landslide susceptibility maps and motivates to prepare hazard assessment via ‘3D point clouds’ that enables us to generate detail information about topography and geomorphology.
Landslide hazard map was developed by weight of evidence method which calculated the positive weight (W+), negative weight (W-) and contrast value (C) to show the existence or non-existence of influencing factor in the landslide and correlated power of the factor. As higher value for W+, as stronger is the positive correlation. High positive correlations to landslides are obtained for slope more the 35-degree slope and nearer from road alignment. This category has also a greater predictive power (C>1). Hazard map was classified in three class high medium and low with equal interval classification basis.
Land use map of the study are shows that the road alignment mainly passes through forest, cultivable land and some settlement area. In Chattiwan and Hakpara site the there was a forest in hill side which was under the high risk where in Bhawanchuli and Gurji site forest was lied in higher risk followed by cultivation and settlement area. In this study, risk assessment carried out with overlaying the landslide hazard map and current land use map. The major factor of landslide in the study area was road construction in highly fragile area with making high slope cut that leads to the high risk in surrounding road alignment. One of the most important ways that can minimize landslide risk is to minimize road mileage and to the fullest extent possible, locate necessary roads on the more sTable portions of the landscape. Structural support such as masonry retaining wall, gabion wall can be used to along the hill slope for the toe protection. In Hakpara site, there is vertical cliff in several locations that can be avoided by shifting the alignment.
Conclusion
This study “Landslide hazard assessment using UAV imagery and GIS in the Sindhuli-Hetauda section of Chure Area” mainly aimed at finding the risk area in the Hetauda- Sindhuli road section of proposed Madan Bhandari Highway acts as one of the baselines in disaster management. Acting as a preventive medium to minimize landslide risks in the affected area, these processes could facilitate other steps in disaster management such as landslide risk mapping (which involves the assessment of loss of lives and property) and its integration with road planning and development. This study used Weight of Evidence (WOE) method to prepare landslide hazard map, and led to the following conclusions:
• Relating to the accuracy of the topographical survey, the Root Mean Square Error (RMSE) of the survey for the individual sites was found to be 0.001m, 0.045 m, 0.044 m and 0.804 m respectively. Meanwhile, the errors in the X, Y and Z of the sites were found to be 0.001172 m, 0.000677 m and 0.002081 m in the first site, 0.052234 m, 0.037494 m and 0.052226 m in the second site, 0.031062 m, 0.094952 m and 0.012200 m in the third site, and 0.239665 m, 0.939586 m and 1.321983 m in the fourth site. The Ground Sampling Distance (GSD) for the respective sites is 6.08 cm/pixel, 5.6 cm/pixel, 4.42 cm/pixel, 7.25 cm/pixel. Since the RMSE is very less and resolution of the data is very high, the use of UAV was found to be fruitful in preparing the topographic map.
• Majority of landslide along the road in the study area were found to be active, with only one being dormant. The active landslides were mainly of the type fall owing to the steep road cut slope while small number of the landslide was slide and rotational.
• The study area (consisting of four individual sites within the area) was categorized into three landslide hazard levels as low, medium and high. In all the four sites, the obtained hazard levels are unique, owing to the uniqueness in the influencing factors. As per the results obtained from hazard map, the largest area being medium 46.39%, 57.45%, 71.21% and 71.16% respectively, followed by high 28.47%, 18.91%, 17.03% and 11.54% respectively and low 25.14%, 23.64%, 11.76% and 17.30% respectively in Chattiwan, Bhawanchuli, Gurji and Hakpara.
• The land use map is combined with landslide hazard map to prepare inventory of the elements at risk. In all three sites Chattiwan, Bhawanchuli and Hakpara, forest is at high risk followed by cultivation and settlement, while in Gurji, mainly cultivable land is in risk followed by bush and settlement.
In order to maintain the balance between the development and the its impact in environment in Chure area of Nepal, in which land degradation is primarily contributed by different types of landslides and mass wasting phenomena which are collectively controlled by the lithospheric plate dynamics, geology, topography, intense precipitation and human interference, hazard assessment and proper planning before road construction is absolutely necessary.
Methodology
Research Design
This study utilized the quantitative methodology. High resolution imagery were used to get topographic data, landslide data and land use data by using UAV and SfM software and some other data such as geological, rainfall, land use data were obtained from the Department of Mines and Geology(DMG), Department of Hydrology and Meteorology(DHM), SOTER. For landslide hazard assessment weight of evidence method (Statistical method) was used. In this method, each factor maps (slope, geology, land use etc.) was combined with the landslide distribution map, and weight values, based on landslide densities, was calculated for each parameter class (slope class, lithological unit, land use type, etc.). For risk assessment quantitative method was used. Risk area of the land use was quantified by combining hazard map with land use map. Risk over the settlement, forest, cultivation, road and other natural resources near the road have been identified with spatial analysis tool in GIS. Overall research design to obtain the research objective is shown in Figure 4.1.

Figure 4-1: Research Design.
Hazard map preparation
In this study WoE method is used to prepare the landslide hazard map. The method was originally developed for mineral potential mapping but recently the method has been used in landslide susceptibility analysis by several researchers in which evidence maps are generally converted to binary predictor maps in order to apply the model (Mezughi, et al., 2011). Weights were calculated for the initial categorization of the parameters derived from DEM (Slope, Aspect, Curvature, Elevation) and for other parameter such as distance from road, distance from stream, geology, soil. As per following equation, positive weight (W+) as well as negative weights (W-) were calculated (Barbieri & Cambuli, 2009).
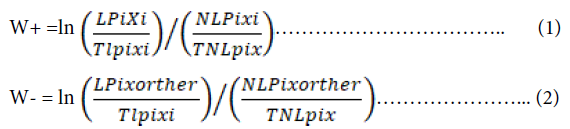
Where,
Wi + = Positive weight
Wi - = Negative weight
Lpixi = Number of landslide pixel in i class
TLpix = Total number of landslide pixel (according to each factor)
NLpixi = Number of non-landslide pixel in i class
TNLpix = Total number of non-landslide pixel (according to each factor)
Lpixothers = Number of landslide pixel in the other classes
NLpixothers = Number of non-landslide pixel in the other classes
The contrast (C) is calculated as the difference between the two weights (C = W+ - W-) where C is positive for a positive spatial association indicating the factor is favorable for the landslides, but C is negative if the spatial association is negative indicating that the factor is unfavorable. The magnitude of the contrast indicates an overall of spatial association between the causative factor and landslides whereas C equal to zero when a class has no spatial relationship with landslides occurrence. The weights and contrast value of all influencing factor is shown in Table below. In GIS, the calculated weights and contrast have been assigned with join and relate in the existing thematic layer to produce multi-class weighted maps for all evidences. Then, raster map of all influencing factor named as contrast class raster were generated with the lookup tools in spatial analysis tool. For the final hazard map raster calculator was used to combine all contrast class raster map. (Figure 4.2) shows the flowchart of hazard.

Figure 4-2: Hazard Map Preparation Flowchart.
Risk assessment
(Figure 4.3) shows the risk assessment process used in this study. The landslide hazard map and land use map were combined to get the area of different hazard level on the individual land use. In all four sites Chattiwan, Bhawanchuli, Gurji and Hakpara, area of land use on high risk, medium risk and low risk is calculate

Figure 4-3: Risk Assessment Flowchart.
Abbreviations and Acronyms
DEM : Digital Elevation Model
DGPS : Differential Global Positioning System
DHM : Department of Hydrology and Meteorology
DMG : Department of Mine and Geology
DSM : Digital Surface Model
DTM : Digital Terrain Model
GC : Clayey Gravel
GCP : Ground Control Point
GIS : Geographic Information System
GoN : Government of Nepal
GP : Poorly Graded Gravel
GPS : Global Positioning System
IDF : Intensity Duration Curve
NDVI : Normalized Difference Vegetation Index
OH : Organic Clay, Organic Silt
PCTMCD : President Chure Terai Madesh Conservation Development Board
SfM : Structure from Motion
Sq.km : Square kilometer
Sq.m : Square meter
SRTM : Shutter Radar Topography Mission
SW : SoftWel
UTM : Universal Transverse Mercator
WGS : World Geodetic System
Availability of data and material
The datasets generated and/or analyzed during the current study are not publicly available because the data are collected by author solely for this research but are available from the corresponding author on reasonable request.
Competing interest
Financial competing interest:
• This research was carried out by author to complete the master level in which no one funded to complete the task.
Non- Financial Competing interest:
• Authors assured that there are no any non-financial competing interests include such as political, personal, religious, ideological, academic, and intellectual competing interests
Declaration
The authors declare that they have no competing interests”
Funding
This research was carried by authors to complete the master degree (Thesis) without any fund for any source to study and collection, analysis, and interpretation of data.
Acknowledgment
This study entitled “Landslide Hazard Assessment Using UAV Imagery and GIS for Road Planning and Development in Chure Area: Sindhuli-Hetauda Section” has come to this form with support of many people and organizations, to whom I am forever indebted.
I would like to express my sincerest gratitude to Associate Professor Dr. Kumud Raj Kafle, supervisor of this thesis, for his valuable guidance, motivation, innovative suggestions and support in completing this thesis. I would also like to pay my profound gratitude to Assoc. Prof. Robert Dongol, Program Coordinator - iWRM at nec-CPS, and Asst. Prof. Dr. Anish Ghimire, nec-CPS Research Management Cell, for their valuable guidance, suggestions, knowledge and supervision as well as hearty cooperation. I would also like to express hearty thanks to Prof. Dr. Khem Raj Sharma, Director of nec-CPS, for his valuable suggestions and comments for improvising this thesis.
I would also like to offer my gratitude to DroNepal, Nepal’s first dedicated private research and Development Company specializing in drones and GIS, for their immense support throughout this study. I also would like to thank my peer Lokendra Bahadur Khadka for his support in the field, respected Bishnu Attreya Sir for his support with the DGPS equipment, and peers Bibhusan Khadka, Sadikshya Chauhan and Darpan Pudasaini for their support throughout this thesis through suggestions as well as motivation.
My immense gratitude goes to my parents to whom I owe my everything, and Ms. Shristi Pathak for her constant motivation throughout this thesis and beyond. Lastly, I would like to express my gratitude and cordial thanks to all those people who directly or indirectly contributed their parts in completing this thesis.
References
- Acharya P. R (2018) Experts question the logic behind one more highway in Chure area, Kathmandu The Himalayan Times.
- Aleotti P, Chowdhury B (1999) Landslide Hazard assessment: Summary review and perspectives. Bull Eng Geol Environ 21-44.
- Al-Rawabdeh A (2017) Time Series UAV image-Based Point Clounds for Landslide Progression Evaluation Application. Sensors 22.
- Barbieri G, Cambuli P (2009) The weight of evidence statistical method in landslide susceptibility mapping of the Rio Pardu Valley (Sardinia, Italy). MODSIM Cong 2658-2664.
- Bonnard C (2014) Landslide hazard and risk zoning for urban planning and development. Earth Sciences 199-235.
- Car M, Kacunic D.J, Kavacevic M.S (2016) Application of Unmanned Aerial Vehicle for Landslide Mapping. Appl. Sci pp. 549-560.
- Chau K (2004) Landslide Hazard analysis for Hong Kong Using Landslide inventory and GIS. Comput Geosci 429-443.
- Chung C.J.F, Febbri A.G (2003) Validation of Spatial Prediction Models for Landslide Hazard Mapping. Natural Hazards 451-472.
- Dahal R. K (2008) Regional scale landslide hazard mapping in the Lesser Himalayan terrain of Nepal. Sendai, Japan Landslide Society.
- Dahal R. K (2006) Geology for Technical Students: A Text Book for Bachelor Level Students : Environmental Science, Civil Engineering, Forestry and Earth Hazard. Bhrikuti Academic Publications.
- Dangol V (2006) Status of Landslide Hazard Mapping in Nepal. Universal Academy Pres 815-819.
- Dhakal, S (2016) Landslide inventory, characterization and engineering design for mitigation works of chure area in ten districts. Kathmandu: President Chure-Tarai Madhesh Conservation Development Board.
- Dijkshoorn K, Huting J (2009) Soil and Terrain database for Nepal. Geology 1-21.
- Driessen P, Dudal R (1989) Lecture Notes on the Geography, Formation, Properties and Use of the Major Soils of the World. Agricultural University Wageningen 1-296.
- Galli M, Ardizzone F, Guzzetlti F, Reichenball P (2008) Comparing landslide inventory maps. Geomorphology 268-289.
- Greenwood W, Lynch J.P, Zekkos D, Clark M. K (2016) UAV-Based-3-D Characterization of Rock Masses and Rock Slides in Nepal. Geomechanics Texas 1-10.
- Guzzelti F (2012) Landslide inventory maps: New tools for an old problem. Earth-Science reviews 42-66.
- Guzzetti F, Carrara A, Cardinali M, Reichenbach P (1999) Landslide hazard evaluation: a review of current techniques and their application in amulti-scale study,Central Italy. Geomorphol 31(1997), pp. 181-216.
- Jaiswal P (2011) Landslide Risk Quantification along Transportation Corridors Based on Historical Information, Economics.
- Jaiswal P, Westen C.J.V (2012) Use of quantitative landslide hazard and risk information for local disaster risk reduction along a transportation corridor: a case study from Nilgiri district, India. Nat Hazards 1-27.
- Jebur M (2015) An interated user-friendly ArcMAP tools for bivariate statistical modelling in geoscience applications. Geosci Model Dev 881-891.
- Khampilang N (2015) Landslide Assessment in a Remote Mountain Region: a Case Study from the Toktogul Region of Kyrgyzstan, Central Asia. Environ Sci 1-290.
- Mandal C. K (2018) Green activists slam Chure road plan, Kathmandu: The Kathmandu Post.
- Marsh S.H (2000). Landslide hazard mapping: Summary Report, Nottingham: British Geological Survey.
- Meten M, Bhandary P. N (2015) Effect of Landslide Factor Combinations on the Prediction Accuracy of Landslide Susceptibility Maps in the Blue Nile Gorge of Central Ethiopia. Geoenviron Dis 015-016.
- Mezughi T.H, Rafek A.G, Akhir J.M, Abdullah I (2011) A Multi-class Weight of Evidence Approach for Landslide Susceptibility Mapping Applied to an Area Along the E-W Highway (Gerik – Jeli), Malaysia. EJJE 1259-1273.
- Pandey, A.R, Shahbodaghlou F (2014) Landslide Hazard Mapping of Nagdhunga-Naubise Section of the Tribhuvan Highway in Nepal with GIS Application. J Geogr Inf Syst 723-732.
- Pardeshi S.D, Autade S.E, Pardeshi S.S (2013) Landslide Hazard assessment: Resent trends and techniques. SpringPlus pp. 1-11.
- Pathak D (2015) Use and Limitation of Landslide Hazard Map in Road Alignment Planning: Case Study of Wamitaksar- Rudarbeni Road Secion, Gulmi District, West Nepal. Disaster Review pp. 20-24.
- Santosh R (2018). An Assessment of the President Chure-Tarai Madhesh Conservation Development Program. J For Res 101-110
- Pellicani R, Argentiero I, Spilotro G (2017) GIS- based predictive models for regional-scale landslide susceptibility assessment and risk mapping along road corridors. Geomatics Nat Hazards Risk pp. 1012-1033.
- Pirasteh S, Li J (2017) Landslides investigations from geoinformatics perspective: quality, challenges, and recommendations. Geomatics Nat Hazards Risk pp. 448-465.
- Poudel U (2018) Highway named after late communist leader, Kathmandu: The Himalayan Times.
- Rusnák M, Sládek J, Buša J, Greif V (2016) Suitability of Digital Elevation Models Generatednerated by UAV Photogrammetry for Slope Stability Assessment (Case Study of Landslide in Svätý Anton, Slovakia). Acta Sci. Pol pp. 439-450.
- Schicker R.D (2010) Quantitative Landslide Susceptibility Assessment of the Waikato Region using GIS. The University of Waikato New Zealand.
- Sidle R.C (2006) Erosion Process in steep terrain-Truths, Myths, and uncertainties related to forest management in southeast Asia. For Ecol Manag pp. 199-225.
- Sikdar P, Chakrabarti S, Adhya E, Paul P. K (2004) Land Use/Land Cover Changes and Groundwater Potential Zoning in and around Raniganj coal mining area, Bardhaman District, West Bengal – A GIS and Remote Sensing Approach. J Spat Hydrol p. 24.
- Singh B. K (2017) Land Tenure and Conservation in Chure. For Trees Livelihoods pp. 1-15.
- Sterlacchini S, Frigerio S, Giacomelli P, Brambilla M (2007) Landslide risk analysis: a multi-disciplinary methodological approach. Nat Hazards Earth Syst p. 657–675.
- Varnes D (2004) Landslide Types and Processes. Colorado.
- Wang F, Xu P, Wang C, Wang NN (2017) Application of a GIS-Based Slope Unit Method for Landslide Susceptibility Mapping along the Longzi River, Southeastern Tibetan Plateau, China. Geo-Information p. 20.
- Westen C.V (2002) Use of weights of evidence modeling for landslide suceptibility mapping, ILWIS.
Indexed at, Google Scholar, Crossref
Indexed at, Google Scholar, Crossref
Indexed at, Google Scholar, Crossref
Indexed at, Google Scholar, Crossref
Indexed at, Google Scholar, Crossref
Indexed at, Google Scholar, Crossref
Indexed at, Google Scholar,
Indexed at, Science Direct, Crossref
Indexed at, Google Scholar, Crossref
Indexed at, Google Scholar, Crossref
Indexed at, Google Scholar, Crossref
Indexed at, Google Scholar, Crossref
Indexed at, Google Scholar, Crossref
Indexed at, Google Scholar, Crossref
Indexed at, Google Scholar, Crossref
Indexed at, Google Scholar, Crossref
Indexed at, Google Scholar, Crossref
Indexed at, Google Scholar, Crossref
Indexed at, Google Scholar, Crossref
Indexed at, Google Scholar, Crossref
Indexed at, Google Scholar, Crossref
Indexed at, Google Scholar, Crossref
Indexed at, Google Scholar, Crossref
Indexed at, Google Scholar, Crossref
Indexed at, Google Scholar, Crossref
Citation: Pandey BP, Kafle KR (2022) Landslide hazard assessment using UAV imagery and GIS for road planning and development in Chure area: Sindhuli- Hetauda Section. J Earth Sci Clim Change, 13: 607. DOI: 10.4172/2157-7617.1000607
Copyright: © 2022 Pandey BP, et al. This is an open-access article distributed under the terms of the Creative Commons Attribution License, which permits unrestricted use, distribution, and reproduction in any medium, provided the original author and source are credited.
Share This Article
Recommended Journals
Open Access Journals
Article Tools
Article Usage
- Total views: 2976
- [From(publication date): 0-2022 - Apr 25, 2025]
- Breakdown by view type
- HTML page views: 2392
- PDF downloads: 584