Kinetics, Optimization and Proximate Analysis of Drying Moringa Oleifera Seeds in A Tray Dryer
Received: 28-Jun-2017 / Accepted Date: 06-Jul-2017 / Published Date: 09-Jul-2017 DOI: 10.4172/2469-9764.1000123
Abstract
This study examined the drying behaviour, optimum drying conditions and proximate analysis of Moringa oleifera seeds in a tray dryer. Thirteen (13) experimental data sets were generated using Box-Behnken design of design expert at varying temperature, contact time and fan speed on response surface methodology. Data generated from the experiment were fitted into existing models to determine the best fit using Excel Solver. Experimental data was used to simulate mathematical model developed using Box-Behnken design with the objective of minimizing the moisture content of the moringa seed within the lower and upper bound of 25-50°C (drying temperature), 30-100 mins (contact time) and 0.5-2.5 m/secs (fan speed). It was shown that the moisture ratio decreases with increasing drying time in all the plots with equilibrium moisture content being achieved within the range of 60-90 minutes at different operating conditions. However, the experiments with temperature (50°C) and fan speed (2.5 m/s) exhibited lowest moisture ratio with varying time. Also, the drying rate decreased continuously throughout the drying period in all the graphs with no constant rate period at any of the operating conditions. Wang and Singh model best described the drying behaviour of the moringa oleifera seeds in a tray dryer with R2 and χ2 values of 0.9991 and 0.00017 respectively at drying temperature of 50°C, fan speed of 0.5 m/s and contact time of 65 min. The moringa seeds that were dried at temperature 37.5°C, contact time 65 mins and fan speed of 1.5 m/s have moisture content of 17.71% with highest crude carbohydrate of 75.49%. A minimum moisture content of 16.7390% was obtained at drying temperature of 25°C, contact time of 75 mins and fan speed of 2.5 m/s using the developed optimization model that gives an excellent prediction with R2 value of 0.9918.
Keywords: Optimization; Kinetics; Drying; Proximate analysis; Tray dryer; Moringa oleifera
Introduction
Drying is a mass transfer process consisting of the removal of water or another solvent by evaporation from a solid, semi-solid or liquid and the oldest known common unit operation in chemical engineering [1,2]. Its process can either be natural (made by the sun or wind) or artificial (which needs power supply) and is usually conducted by vaporizing water in the product and supplying latent heat of vaporization. Factors that affect drying rate are vapour pressure, temperature, relative humidity, air circulation, nature of wet feed and the way it is introduced into the dryer and a host of other environmental factors [3,4]. Common domestic and industrial dryers classified according to design and operating features are tray dryers, tunnel dryers, drum dryers, fluidized bed dryers, spray dryers, flash dryers, rotary dryers, belt dryers, vacuum dryers and freeze dryers [5]. The most common type for drying of leaves and seeds is the tray dryer which can be classified based on mode of operation as batch or continuous; and position and movement of trays as stationary or moving [6].
Moringa oleifera, commonly called a miracle tree due to its unique features and multipurpose ability, belongs to a monogenetic family called the Moringaceae [7-9]. It is a short, slender, deciduous and perennial tree with cosmopolitan tropical drought tolerance characteristics [10]. It has numerous benefits ranging from medicinal, nutritional domestic to industrial [8,11,12]. Thus, efforts need to be made to make the seeds be well preserved while still retaining the nutrients contained in them for future purpose. Recently, Ali et al. [13] investigated drying kinetics and colour analysis of Moringa oleifera leaves and was shown that oven drying at 40°C reveled optimum colour values. Aremu et al. [14] examined the effects of some drying methods on nutritional characteristics of moringa (Moringa oleifera) seeds and was shown that more nutrients were retained in cabinettray drying method (in terms of protein and fat) compared to other drying methods. It has also been shown that commercial processing of M. oleifera leaves could be improved by using microwave drying method with higher total phenolic content, radical scavenging activity and quercetin as the drying time was reducing [15]. Also, Verma model had been shown to be the best for describing the drying kinetics of Moringa oleifera leaves [16]. Tray drying method had been proven to be the best method of dehydrating moringa leaves due to its ability to retain moringa leaves nutritional content as compared to sun, shadow and cabinet drying methods [17].
In this study, the optimum conditions for drying parameters of Moringa oleifera seed in a tray dryer were determined using Box- Behnken design for drying factors (temperature, contact time and fan speed) on response surface methodology. Thirteen (13) experimental data sets were generated for samples of moringa seed using design expert. Proximate analysis was done for the samples after drying to determine their crude fat, crude protein, carbohydrate, crude fibre and ash content. Data generated from the experiment were fitted into existing models to determine the best fit using Excel Solver. An empirical model, developed using Box-Behnken design, was simulated using the experimental data and was then optimized by minimizing the moisture content of the moringa seed. The drying parameters were optimized within the lower and upper bound of 25-50°C (drying temperature), 30-100 mins (contact time) and 0.5-2.5 m/secs (fan speed).
Materials And Methods
Sample collection and preparation
Fresh and matured moringa pods were harvested from Moringa oleifera farm of Afe Babalola University, Ado-Ekiti, Ekiti State, Nigeria located on longitudes 5°18’05.78’’E and latitudes 7°36’09.59’’N. The seeds, removed from the pods and the outer shell, were then cut into smaller particle sizes of diameter ≤ 5 mm.
Experimental design and optimization
Design expert was used to reduce the number of experiments to be conducted. Box Behnken design was chosen with three factors of temperature (T, °C), contact time (tc, mins) and speed of fan (vf, m/s). Moisture content (%) is the output from the response surface methodology used. The optimization tool of the design expert together with the developed model of the system was utilized to obtain the optimum parameters required for appropriate drying of the moringa seed samples. The objective function of the optimization was to minimize the moisture content contained in the dried moringa seeds within the set range of the lower and upper bounds of manipulated variables.
Drying of seeds
The Moringa oleifera seeds (≤ 5 mm) were dried using a computer controlled Armfield tray dryer (Armfield UOP8 MKII). The tray dryer, having dimension of 1.4 m × 2.95 m × 0.75 m, is made up of three (3) trays with an area 254 mm × 304.8 mm for each. For each of the experiment, 150 g was weighed and separated into three portions on an average of 50 g in each tray to increase surface area for drying process to occur. After each experiment, total weight of sample against time was taken.
Proximate analysis
After using the experimental design approach, thirteen (13) samples were examined for proximate analysis to determine percentages of crude fat, crude protein, crude carbohydrate, crude fibre, ash and residual moisture content.
Moisture content: This was carried out using a moisture analyser. Two grams of the sample was placed in the equipment at 105°C and readings were taken after 10 minutes. The moisture ratio is calculated thus:
 (1)
(1)
where Mt =Moisture content at time t, g
Me=Equilibrium moisture content, g
Mo=Initial moisture content, g
Ash content: An analytical balance was used to weigh a dried crucible dish and 2 g of the sample was placed. The dish plus the sample was placed in a muffle furnace at 600°C for 3 hours. After 3 hours, the sample plus crucible dish was removed from the muffle furnace and placed immediately in a desiccator. It was then weighed. The ash content was calculated using:

where Wcs=Weight of dried crucible plus sample, g
Wc=Weight of dried empty crucible, g
Ws=Weight of sample, g
Crude protein: The amount of crude protein in the sample was determined using Kjeldahl method which involves conversion of nitrogenous compounds to ammonium sulphate by digesting the sample with concentrated H2SO4 in the presence of selenium. Two grams of the sample was put into the digestion flask and half of selenium based catalyst tablet and 25 ml of concentrated H2SO4 were added. The flask was thoroughly shaken to ensure uniformity and then placed on a heating mantle until the resulting solution was clear after which it was cooled to room temperature of 25°C. The digested solution plus distilled water was filled up in a 100-ml volumetric flask. Two drops of mixed indicator were added into 25 ml of 2% boric acid, pipetted into a 250-ml conical flask and the contents were placed under a condenser such that the tip of the condenser was completely immersed in the solution. 10 ml of the digested sample was measured and poured into the decomposition flask with the addition of an excess 40% (about 15-20 ml). To drive the liberated ammonia into the collection flask (a conical flask containing 25 ml of 2% boric acid), steam was forced through the decomposition chamber by shutting the stop cock on the steam trap outlet. The boric acid changed to bluish green as soon as it came into contact with ammonia and distillation was continued for 5 minutes. The receiving flask was lowered so that the condenser tip was just above the liquid which was washed with little distilled water and distillation continued for another 30 seconds. Twenty (20 ml) of the distilled sample was pipetted into a 250-ml conical flask and titrated with 0.0501N HCl solution. The acid was added until the solution was pink. The endpoint of the titration was identified as the first colour change.
Assuming a correction factor of 6.25, the crude protein is calculated using [18,19]:
% Crude Protein=6.25 × %Nitrogen (2)
 (3)
(3)
where Vs=Titration reading of sample, ml
Vb=Blank titration reading, ml
CA=Concentration of acid=0.0501 mol/dm3
Dsd=Sample dilution after digestion, ml
WS=Weight of sample, g
Vd=Volume taken for distillation, ml
0.014=Milli equivalent weight of Nitrogen
Crude fibre: Two grams of sample was weighed into a round bottom flask with 50 ml of fibre solution measured and boiled for 1 hour. Filter paper was used to decant using vacuum pump to suck the liquid and wash with distil water till it was clear. The residue was scraped into crucible and oven dried for 24 hrs and weighed, thereafter it was ash in a furnace at 600°C for 2 hours and allow to cool down. It was then weighed. Crude fibre was calculated using:
 (4)
(4)
where Wc=Weight of empty crucible, g
Wcs=Weight of empty crucible and sample, g
Wcas=Weight of empty crucible and ashed sample, g
Crude fat: Two grams of sample was transferred onto a thimble and small ball of cotton wool was placed into it to prevent sample loss. A measured volume of 150 ml petroleum spirit was added into a dried 250 ml flask. A quickfit condenser was connected to the soxhlet extractor and refluxed for 4 hours on heating mantle. The flask was then removed and evaporated on a steam bath. The flask and fat sample was heated for 30 minutes in an oven at a temperature of 103°C. The flask and content was cooled to room temperature of 25°C in a desiccator. They were then weighed accurately to determine weight of fat collected. Weight of fat collected was determined by using:
 (5)
(5)
where Wts=Weight of thimble and sample, g
Wdst=Weight of defatted sample and thimble after drying, g
Wt=Weight of thimble, g
Crude carbohydrate: The percent of crude carbohydrate in sample is determined using:
% Crude Carbohydrate=100%−[%Moisture Content+%Ash Content+%Crude Protein+%Crude Fibre+%Crude Fat] (6)
Mathematical modelling for data fitness
The experimental data obtained were fitted into different models presented in Table 1 to determine the one that best describes the experimental process. The data fitness was performed using excel solver for the determination of constants and coefficient in the models together with the regression analysis.
| Model name | Model | References |
|---|---|---|
| Lewis | MR=exp(−kt) | [20] |
| Page | MR=exp(−ktn) | [21] |
| Wang and Singh | MR=1+at+bt2 | [22] |
| Logarithmic | MR=exp(−kt)+c | [23] |
| Two-Term exponential | MR=a exp(−kt)+(1−a) exp(−kat) | [24] |
| Verma et al. | MR=a exp(−kt)+(1−a) exp(−gt) | [25] |
| Modified page | MR=exp(−kt)y | [26] |
| Henderson and Pabis | MR=a exp(−kt) | [27] |
| Magee | MR=a+ kt1/2 | [28] |
Table 1: Mathematical Models for Data Fitting.
The reduced chi-square is determined thus:
 (7)
(7)
where MRexp,i=experimental moisture ratio for experiment I, g
MRpred,i=predicted moisture ratio for experiment I, g
N=total number of observations
n=total number of constants in the examined model
The room mean square error (RMSE) is determined using:
 (8)
(8)
The drying rate is calculated using:
 (9)
(9)
where Mt+dt=moisture content at time t+dt, g
Mt=moisture content at time t, g
t=drying time, mins.
Results And Discussion
Design of experiment
The result obtained for the experimental design of drying of Moringa oleifera seeds in a tray dryer using Box Behnken procedure is presented in Table 2. The parameters used to determine the optimum drying conditions were all within the set ranges (contact time: 30-120 mins, temperature: 25-50°C and fan speed: 0.5-1.5 m/sec). All the experimental runs vary at different operating conditions. However, it was observed that same drying conditions were generated for the third, fifth and thirteenth experimental runs. This results from random sampling of the procedure used. The values for the raw sample were set at zero because it was not subjected to drying for comparative proximate analysis purpose with dried samples.
| Run | Temperature (°C) | Contact Time (mins) | Fan Speed (m/secs) |
|---|---|---|---|
| 1 | 50 | 65 | 0.5 |
| 2 | 37.5 | 100 | 0.5 |
| 3 | 37.5 | 65 | 1.5 |
| 4 | 25 | 65 | 0.5 |
| 5 | 37.5 | 65 | 1.5 |
| 6 | 25 | 30 | 1.5 |
| 7 | 37.5 | 30 | 0.5 |
| 8 | 50 | 30 | 1.5 |
| 9 | 50 | 100 | 1.5 |
| 10 | 25 | 100 | 1.5 |
| 11 | 37.5 | 100 | 2.5 |
| 12 | 50 | 65 | 2.5 |
| 13 | 37.5 | 65 | 1.5 |
| Raw | 0 | 0 | 0 |
Table 2: Design of Experiment.
Drying behaviour of Moringa oleifera seed in tray dryer
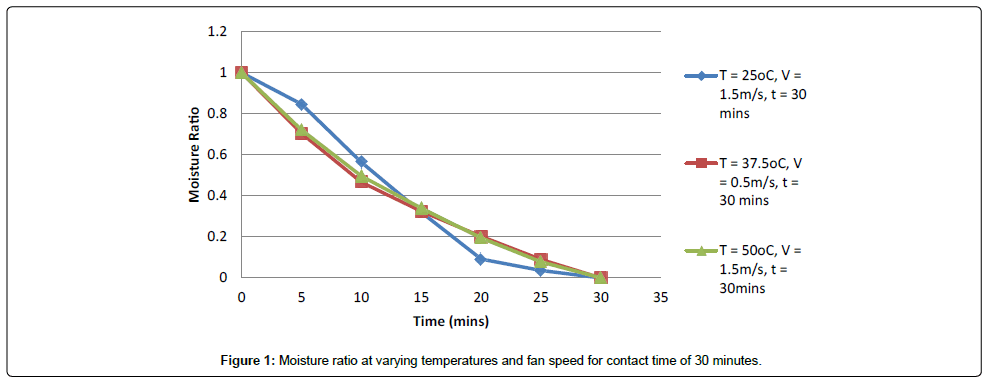
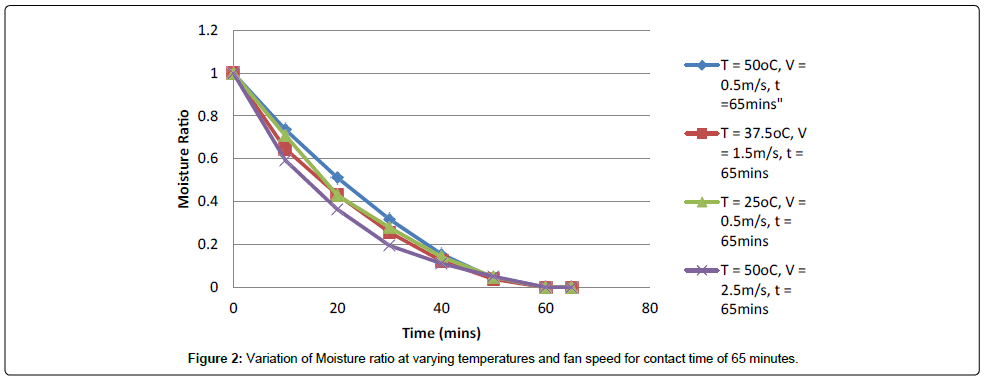
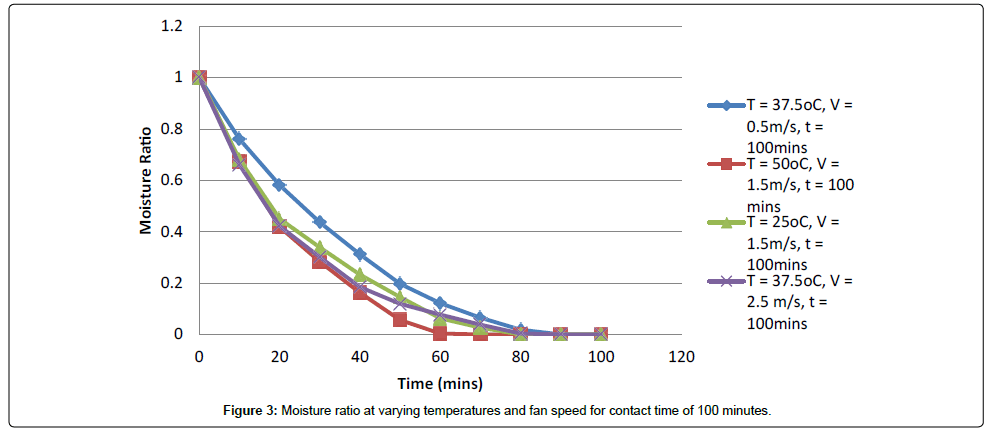
The moisture ratio and drying rate were calculated using equations 1 and 9 respectively. Based on the result obtained from the design of experiment, the contact time are in three categories of 30, 65 and 100 minutes, thus the results obtained for the moisture ratio and drying rates were plotted on this basis. Figures 1-3 show graphs of variation of moisture ratio with varying drying temperatures and fan speed at contact time of 30, 65 and 100 minutes respectively. The moisture ratio decreases with increasing drying time in all the plots. This indicates that the drying operating variables are effective parameters to reduce the moisture content of the Moringa oleifera seeds. The continuous decrease in the moisture ratio resulted from the removal of free moisture from the surface [2] and also moisture from the interior of the seeds as a result of the internal mass transfer governed by diffusion [16]. In Figures 1 and 2, the equilibrium moisture content was achieved at 30 and 60 minutes respectively for the plots at different operating conditions. However, in Figure 3, the equilibrium moisture content was achieved within the range of 60-90 minutes for the plots at different operating conditions of drying temperature and fan speed of the dryer. The equilibrium moisture content (18-39%) was significantly lower than the initial moisture content (45-47%) as a result of varying relative humidity during the drying process in Figures 1-3 [29]. Also, the experiments with temperature (50°C) and fan speed (2.5 m/s) exhibit lowest moisture ratio with varying time which indicates the impact of temperature and fan speed of the dryer as key process variables to the drying of the Moringa oleifera seed.
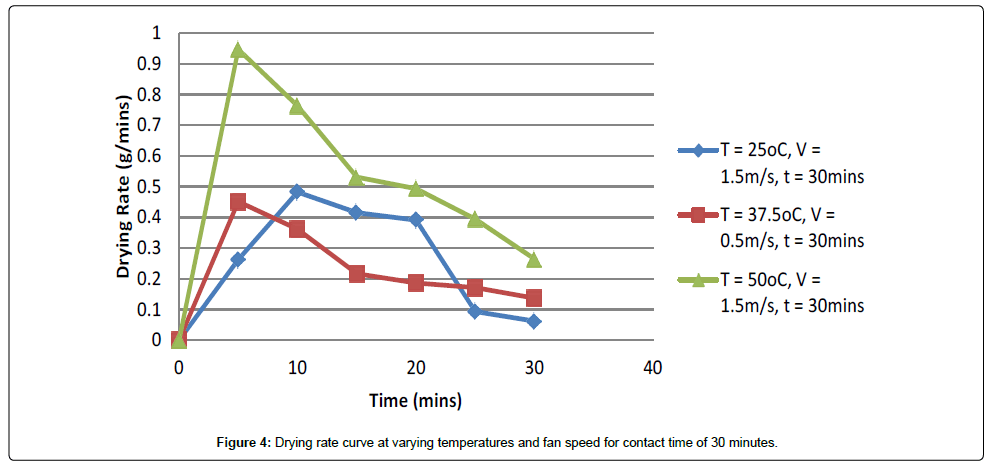
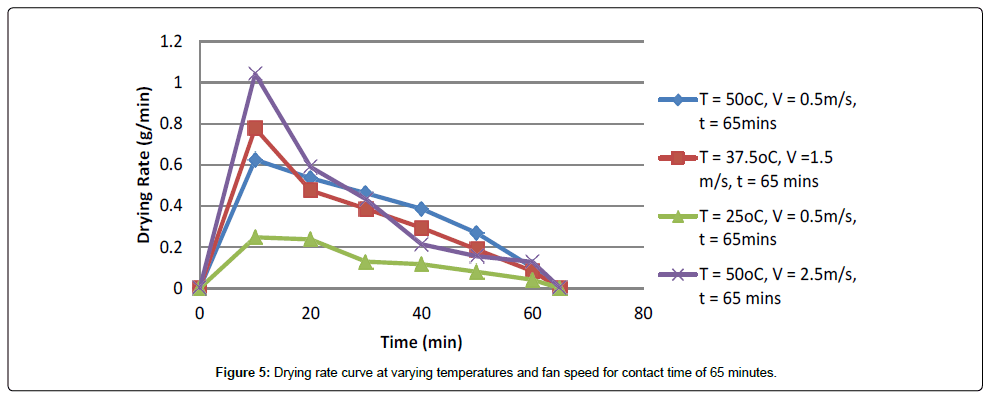
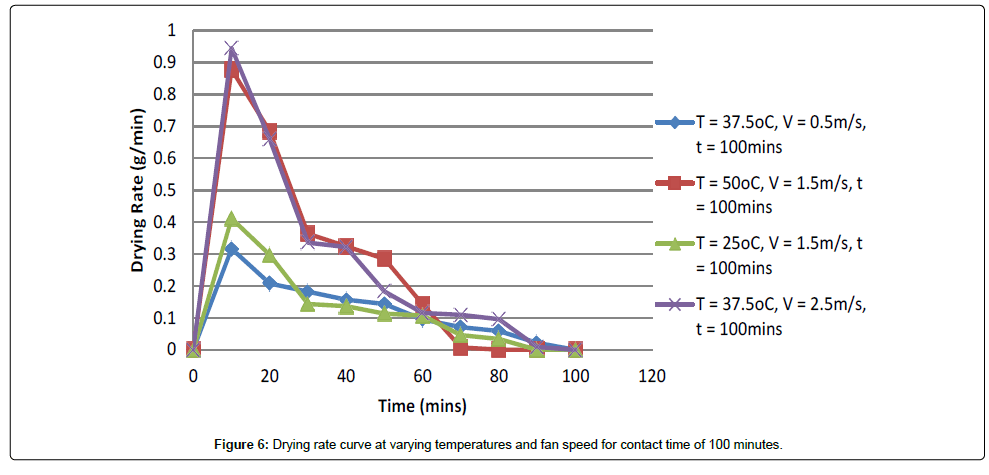
The drying rate as a function of time was also calculated in all the experiments at various operating conditions using equation 9. Figures 4-6 are the drying rate curves at varying temperature and fan speed for contact time of 30, 65 and 100 minutes respectively. In all the graphs, there was initial increase in the drying rate with time which indicates removal of more free moisture at the surface of the seeds and internal diffusion mass transfer occurring in the Moringa oleifera seed resulting high heat supply. The drying rate decreased continuously throughout the drying period in all the graphs with no constant rate period at any of the operating conditions. The drying behaviour conforms with examined previous studies on drying behaviour of Moringa oleifera leaves [13,16]. Many previous studies on drying of food materials have also reported to have same drying characteristics [30]. The nature of the plots depicted in Figures 4-6 also indicate that the drying parameters (contact time, drying temperature and fan speed) are effective enough to enhance drying in the seed.
Mathematical modelling for kinetic analysis
The results obtained for the moisture ratio in each experiment were fitted into various models presented in Table 1. Equations 7 and 8 were used to calculate the chi-square (χ2) and root mean square error (RMSE). The values for the predicted moisture ratio in the models with their respective constants and coefficients were calculated using excel solver. The coefficient of determination (R2) between the experiment and predicted values of moisture ratio was done by regression analysis on the data analysis of excel solver. It was expected that the model with highest R2 and lowest chi-square best describes the drying of Moringa oleifera seeds at such drying condition. Appendix I is the detailed results obtained for the constants and coefficients in the models; R2, χ2 and root mean square error (RMSE) at different operating conditions. Table 3 (extracted from Appendix I) is a summary of the maximum and minimum values of R2 and χ2 at operating conditions at which they were obtained for the models.
| Models | Operating Conditions | R2 | χ2 | ||
|---|---|---|---|---|---|
| max | min | max | min | ||
| Lewis | T=37.5°C, tc=100min, Vfan=2.5m/s | 0.9985 | - | - | 0.00023 |
| T=25°C,tc=30min, Vfan=1.5m/s | - | 0.9512 | 0.01241 | - | |
| Page | T=37.5°C, tc=100min, Vfan=2.5m/s | 0.9984 | - | - | 0.00021 |
| T=37.5°C, tc=30min, Vfan=0.5m/s | - | 0.9930 | 0.00096 | - | |
| Wang and Singh | T=50°C, tc=65min, Vfan=0.5m/s | 0.9991 | - | - | 0.00017 |
| T=37.5°C, tc=100min, Vfan=2.5m/s | - | 0.9764 | 0.00423 | - | |
| Logarithmic | T=50°C, tc=30min, Vfan=1.5m/s | 0.9608 | - | - | 0.00613 |
| T=50°C, tc=100min, Vfan=1.5m/s | - | 0.7544 | 0.03454 | - | |
| Two-Term exponential | T=50°C, tc=30min, Vfan=1.5m/s | 0.9607 | - | - | 0.01096 |
| T=37.5°C, tc=100min,Vfan=0.5m/s | - | 0.7537 | 0.07660 | - | |
| Verma et al. | T=37.5°C, tc=100min, Vfan=2.5m/s | 0.9985 | - | - | 0.00019 |
| T=50°C, tc=30min, Vfan=1.5m/s | - | 0.9929 | 0.00188 | - | |
| Modifiedpage | T=37.5°C, tc=100min, Vfan=2.5m/s | 0.9985 | - | - | 0.00025 |
| T=25°C ,tc=30min, Vfan=1.5m/s | - | 0.9512 | 0.01489 | - | |
| Henderson and Pabis | T=37.5°C, tc=100min, Vfan=2.5m/s | 0.9984 | - | - | 0.00025 |
| T=25°C ,tc=30min, Vfan=1.5m/s | - | 0.9431 | 0.01269 | - | |
| Magee | T=37.5°C, tc=30min, Vfan=0.5m/s | 0.9881 | - | ||
| T=25°C ,tc=30min, Vfan=1.5m/s | - | 0.9256 | 0.01458 | 0.00179 | |
Table 3: Coefficient of determination (R2) and χ2 at different Operating Conditions
From the results obtained, the R2 values for the fitted mathematical models were greater than 0.92 except with logarithmic and two-term exponential models that have minimum R2 values of 0.7544 and 0.7537 respectively. The highest value of 0.9991 was obtained for R2 with minimum χ2 value of 0.00017 at drying temperature of 50°C, fan speed of 0.5 m/s and contact time of 65 min using Wang and Singh model. This is an indication that the Wang and Singh model best describes the drying behaviour of moringa oleifera seeds at the obtained operating conditions. However, lewis page, modified page, Henderson and Pabis, and Magee models have maximum R2 values of ˃0.9881 at drying temperature of 37.5°C, fan speed of 2.5 m/s and contact time of 100 min. This indicates that the operating conditions at which these models have maximum R2 values are also favourable for optimum drying of Moringa oleifera seeds in a tray dryer. Previous literatures had recommended Page’s model to be the most suitable mathematical drying method among all mathematical models [31,32]. In other studies, Verma model was considered to represent the drying behaviour of Moringa oleifera leaves in a convective type dryer [16] with similar results reported for air drying of bay leaves [33].
Proximate analysis
The proximate analysis of each sample of Moringa oleifera seed (Table 4) was executed to check their nutritional contents after drying in the tray dryer. All the examined seeds contained measurable amount of crude fat, crude ash, crude protein, crude fibre, crude carbohydrate and moisture content as also reported in previous literatures [19,34-36]. The moringa seeds dried at temperature 25°C, contact time 65 mins and fan speed of 0.5 m/s has the highest moisture content of 38.49% with lowest crude carbohydrate of 53.43%. while the moringa seeds that were dried at temperature 37.5°C, contact time 65 mins and fan speed of 1.5 m/s has moisture content of 17.71% with highest crude carbohydrate of 75.49%. The variance in the values of parameters evaluated resulted from the operating conditions at which the moringa seeds were dried. The drying operating conditions of temperature 37.5°C, contact time 65 mins and fan speed of 1.5 m/s enhanced reduced moisture content and high crude carbohydrate. In all the experiments, crude carbohydrate has the largest percentage of the moringa seeds which is in contrary to many studies where crude protein takes the largest percentage of the moringa seeds [37].
| Run | Moisture Content (%) | Crude Fat (%) | Crude Ash (%) | Crude Protein (%) | Crude Fibre (%) | Crude Carbohydrate (%) |
|---|---|---|---|---|---|---|
| 1 | 25.74 | 1.5 | 1 | 4.2 | 2 | 65.56 |
| 2 | 26.89 | 1.4 | 1 | 4.2 | 1 | 65.51 |
| 3 | 27.15 | 1.14 | 1 | 2.1 | 1 | 67.61 |
| 4 | 38.49 | 1.68 | 1.5 | 1.9 | 3 | 53.43 |
| 5 | 23.62 | 1.5 | 3 | 2.9 | 6 | 62.98 |
| 6 | 31.55 | 1.6 | 2 | 1.6 | 3 | 60.25 |
| 7 | 24.53 | 1.5 | 1.5 | 3.2 | 2 | 67.27 |
| 8 | 36.08 | 1.2 | 2.5 | 3.1 | 3 | 54.12 |
| 9 | 11.65 | 1.12 | 4.5 | 4.2 | 7 | 71.53 |
| 10 | 19.44 | 1.13 | 2.5 | 1.7 | 3 | 72.23 |
| 11 | 19.11 | 1.4 | 3.5 | 2.2 | 3 | 70.79 |
| 12 | 17.04 | 1.8 | 5 | 2.6 | 5 | 68.56 |
| 13 | 17.71 | 1.1 | 1.5 | 2.2 | 2 | 75.49 |
Table 4: Proximate Analysis of Dried Moringa oleifera Seeds.
Optimization of drying parameters
The empirical model developed using Box-Behnken design to minimize the moisture content of the moringa seed within the lower and upper bounds of 25-50°C (drying temperature), 30-100 mins (contact time) and 0.5-2.5 m/secs (fan speed) is given as equation 10. A minimum moisture content of 16.7390% was obtained at drying temperature of 25°C, contact time of 75 mins and fan speed of 2.5 m/s using MATLAB optimization toolbox for the generated model. Table 5 shows the values of experimental and simulated moisture contents at different experimental runs using the developed model. The regression analysis performed shows an excellent prediction with R2 value of 0.9918.
| Run | Moisture Content (%) (Experimental) | Moisture Content (%) (Experimental)) |
|---|---|---|
| 1 | 21.102 | 21.130 |
| 2 | 32.631 | 32.662 |
| 3 | 23.109 | 23.133 |
| 4 | 37.587 | 38.564 |
| 5 | 23.109 | 23.133 |
| 6 | 36.751 | 36.763 |
| 7 | 38.622 | 37.681 |
| 8 | 28.867 | 29.843 |
| 9 | 19.443 | 19.479 |
| 10 | 32.487 | 31.561 |
| 11 | 18.587 | 19.576 |
| 12 | 19.667 | 18.741 |
| 13 | 23.109 | 23.133 |
Table 5: Simulated Moisture Content using the Developed Model.
 (10)
(10)
Conclusion
The drying behaviour, optimum drying conditions and proximate analysis of Moringa oleifera seeds in a tray dryer have been examined. The moisture ratio decreases as the drying time progresses in all the plots while the equilibrium moisture content was achieved within the range of 60-90 minutes at different operating conditions. The drying rate decreased continuously throughout the drying period in all the graphs with no constant rate period while Wang and Singh model best described the drying behaviour of the Moringa oleifera seeds in a tray dryer with R2 and χ2 values of 0.9991 and 0.00017 respectively at drying temperature of 50°C, fan speed of 0.5 m/s and contact time of 65 min. The moringa seeds that were dried at temperature 37.5°C, contact time 65 mins and fan speed of 1.5 m/s have moisture content of 17.71% with highest crude carbohydrate of 75.49%. A minimum moisture content of 16.7390% was obtained at drying temperature of 25°C, contact time of 75 mins and fan speed of 2.5 m/s using the developed model. shows using the developed model. The regression analysis performed between the values of experimental and simulated moisture contents at different experimental runs shows an excellent prediction with R2 value of 0.9918.
References
- Alexandre C, Costin S, Anton A (2014) Integrated Design and Simulation of Chemical Processes. Second Edition, p :485.
- Richardson JF, Harker JH, Backhurst JR (2002) Chemical Engineering Particle Technology and Separation Processes.Vol. 2, Fifth Edition, Butter Worth–Heinemann, Oxford, p: 927.
- Jayashree E, Visvanthan R (2013) Studies on Thin Layer Drying Characteristics of Ginger (ZingiberOfficinale) in a Mechanical Tray Drier. Journal of Plantation Crops 41: 86-90.
- Mahayothee B, Udomkun P, Nagle M, Haewsungcharoen M, Janjai S, et al. (2009) Effects of Pretreatments on Colour Alterations of Litchi during Drying and Storage. European Food Research Technology 229: 329-337
- Misha S, Mat S, Ruslan MH, Sopian K, Salleh E (2013) Review on the Application of a Tray Dryer System for Agricultural Products. World Applied Sciences Journal 22: 424-433
- Brennan JG, Day BPF (2006) Packaging In: Food Processing Handbook. In: Brennan JG (Ed) WILEY-VCH Verlag GmbH and Co. KGaA, Weinheim 291-350
- Aja PM, Ibiam UA, Uraku AJ, Orji OU, Offor CE, et al. (2013) Comparative Proximate and Mineral Composition of Moringa oleifera Leaf and Seed. Global Advanced Research Journal of Agricultural Science 2: 137-141.
- Foline OF, Emenike AF, Eunice BI (2011) Comparative Analysis of the Nutritional Composition of Three Different Drying Methods of MoringaoleiferaLeaves. International Journal of Applied Agricultural Research 6: 131.
- Ramachandran C, Peter KV, Gopalakrishnan PK (1980) Drumstick (Moringa oleifera) a Multipurpose Indian Vegetable. Economic Botany 34: 276-283.
- Hajimehdipoor H, Adib N, Khanavi M, Mobli M, Amin GR, et al. (2012)Comparative Study on the Effect of Different Methods of Drying on Phenolics Content       and Antioxidant Activity of Some Edible Plants. International Journal of pharmaceutical sciences and research 3: 3712-3716
- Oliveira JT, Silveia SB, Vasconcelos KM, Cavada BS, Moreira RA (1999)Compositional and Nutritional Attributes of Seeds from the Multipurpose Tree. Moringaoleifera Lamarck. J Sci and Food Agric 79:815-820.
- Torondel B, Opare D, Brandberg B, Cobb E, Cairncross S (2014) Efficacy of Moringa oleifera Leaf Powder as a Hand-Washing Product: A Crossover Controlled Study among Healthy Volunteers. BMC Complementary and Alternative Medicine 14: 57.
- AliMA, YusofYA, ChinaNL, Ibrahima MN, Basra SMA(2014)Drying Kinetics and Colour Analysis of Moringa Oleifera Leaves. Agriculture and Agricultural Science Procedia 2: 394-400.
- Aremu AK, Akintola A (2014)Effects of some Drying Methods on Nutritional Characteristics ofMoringa (Moringa Oleifera) Seeds. 2014 4th International Conference on Biotechnology and Environment Management75: 66-71.
- Potisate Y, Phoungchandang S (2015) Microwave Drying of Moringa oleifera leaves: Drying Characteristics and Quality Aspects. KKU Res J 20:12-25.
- Premi M, Sharma HK, Sarkar BC, Singh C (2010)Kinetics of drumstick leaves(Moringa oleifera) duringconvective drying. African Journal of Plant Science4: 391-400.
- Satwase AN, Pandhre GR, Sirsat PG, Wade YR (2013) Studies on drying characteristicsandnutritional composition of drumstick leaves using sun, sha dow,cabinet and oven drying methods. Open Access Scientific Reports 2: 1-4
- Gul S, Safdar M (2009) Proximate composition and mineral analysis of cinnamon. Pakistan Journal of Nutrition 8: 1456-1460.
- Jongrungruangchok S, Bunrathep S, Songsak T (2010)Nutrients and minerals content ofeleven differentsamples of Moringa Oleifera cultivated in Thailand. J Health Res24:123-127.
- Bruce DM (1975) Exposed layer barley drying, three models fitted to the new data up to 150oC. Journal of Agricultural Engineering Research 32:337-347.
- DiamanteLM, Munro PA (1993) Mathematical modelling of the thinlayer solardrying of sweet potato slices. Solar Energy 51:271-276.
- Wang CY, Singh RP (1978) A thin layer drying equation for rough rice.ASAE, St. Joseph, MI, USA, pp:78-3001.
- Yagcioglu A, Degirmencioglu A, Cagatay F (1999) Drying characteristicof laurel leaves underdifferent conditions. In: A. Bascetincelik (Ed.),Proceedings of the 7th international congress on agriculturalmechanization and energy: 565-569.
- Sharaf-Eldeen YI, Blaisdell JL, Hamdy MY (1980) Amodel for ear corndrying.Transaction of the ASAE 23: 1261-1271.
- Verma LR, Bucklin RA, Endan JB, Wratten FT (1985) Effects of dryingair parameters on rice drying models. Transaction of the ASAE 28:296-301.
- Overhults DG, White GM, Hamilton HE, Ross IJ (1973) Drying soybeans with heated air. Transactions of American Society of Agricultural Engineers 16: 112-113.
- Henderson SM, Pabis S (1961) Grain drying theory I:Temperatureeffect on drying coefficient. J Agric ResEng 6: 169-174.
- Magee TRA, Murphy WR, Hassaballah AA (1983) Internal masstransfer during osmotic dehydration of apple slices in sugar solution.Irish J. Food Sci. Technol 7: 147-155.
- Doymaz I, Ozdemir O (2013)Effect of air temperature, slice thickness and pre-treatment ondrying andrehydration of tomato. International Journal of Food Science and Technology 49: 558-564.
- Wang Z, Sun J, Chen F, Liao X, Hu X (2007). Mathematical modeling on thin layer microwave drying of apple pomace with and without hot air pre-drying, J Food Eng80: 536-544.
- GunhanT, VedatD, Ebru H, Arif H (2005) Mathematical modelling of drying of bay leaves. Energy Conversion and Management46: 1667–1679.
- DoymazI, TugrulN, PalaM (2006) Drying characteristics of dill and parsley leaves. Journal of Food Engineering77: 559-565.
- Demir V, Gunhan T, Yagcioglu AK, Degirmencioglu A (2004)Mathematical modelling and thedetermination of some qualityparameters of air-dried bay leaves. Biosyst. Eng 88: 325-335
- Aja PM, Ibiam UA, Uraku AJ, Orji OU, Offor CE, et al. (2013) Comparative proximate and mineral composition of Moringa oleifera leaf and seed. Global Advanced Research Journal of Agricultural Science 2: 137-141.
- Adeyemi SB, Ogundele KO,Animasaun MA (2014) Influence of drying methods on the proximate and phytochemical composition of Moringa oleifera. AENSI Journals Global Journal of Medicinal Plant Research 2: 1-5.
- Abiodun OA, Adegbite JA, Omolola AO (2012)Chemical and physicochemical properties of moringa floursand oil. Global Journal of Science Frontier ResearchBiological Sciences12: 13-17.
- Fagwalawa LD, Yahaya SM, Umar DI (2015)A comparative proximate analysis of bark, leaves and seed of moringa oleifera. International Journal of Basic and Applied Chemical Sciences5:56-62.
Citation: Popoola LT, Giwa A, Aderibigbe TA (2017) Kinetics, Optimization and Proximate Analysis of Drying Moringa oleifera Seeds in a Tray Dryer. Ind Chem 3: 123. DOI: 10.4172/2469-9764.1000123
Copyright: © 2017 Popoola LT, et al. This is an open-access article distributed under the terms of the Creative Commons Attribution License, which permits unrestricted use, distribution, and reproduction in any medium, provided the original author and source are credited.
Share This Article
Recommended Journals
Open Access Journals
Article Tools
Article Usage
- Total views: 5071
- [From(publication date): 0-2017 - Dec 18, 2024]
- Breakdown by view type
- HTML page views: 4219
- PDF downloads: 852
