Isolation, Purification, and Immunobiochemical Characterization of Igg from Dog (Canis Lupus Familiaris)
Received: 05-Apr-2022 / Manuscript No. jvmh-22-56226 / Editor assigned: 07-Apr-2022 / PreQC No. jvmh-22-56226 / Reviewed: 21-Apr-2022 / QC No. jvmh-22-56226 / Revised: 25-Apr-2022 / Manuscript No. jvmh-22-56226 / Accepted Date: 30-Apr-2022 / Published Date: 02-May-2022 DOI: 10.4172/jvmh.1000148
Abstract
Background: Immunoglobulin G (IgG) plays a pivotal role for secondary immune response in animals which trigger passive immunization against harmful pathogens in dogs.
Purpose: The purpose of the present study was to isolate, purify, and immunobiochemically characterize IgG isolated from serum of dog (Canis lupus familiaris).
Methods: The serum was isolated from dog which had undergone ammonium sulphate precipitation, which was dialysed overnight in a refrigerator followed by Lowry Method from where the protein concentration was estimated to be 122.22 mg/ml and the Total Protein Concentration was estimated to be 6.147 g/dl that is 61.47 mg/ml. This study continued through Column Chromatography estimation by obtaining a bell shaped graph (Absorbance vs Number of Fractions) followed by SDS-PAGE from where Rf values of different bands were obtained. Marker (Known) and samples P1, P2, P3, P4 (Unknown) graphs were obtained. The marker graph was estimated by Log of Molecular Weight of Protein Ladder Marker and the unknown graphs were estimated by Anti-Log of Molecular Weight of Protein Ladder Marker. After that DID Test was done where a single precipitin line of purified IgG of Canine dog was observed against antiserum developed in rabbit.
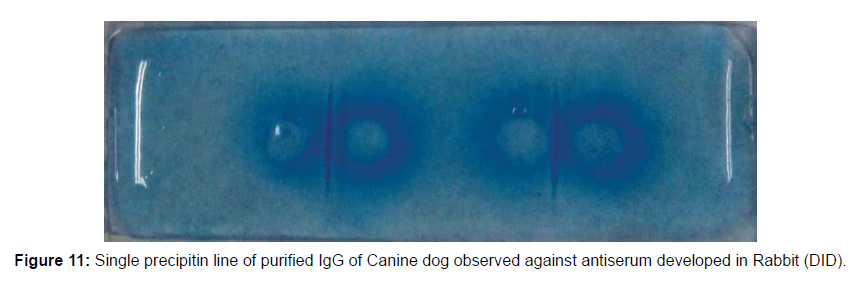
Results: A single precipitin line of purified IgG of Canine dog observed against antiserum developed in rabbit and was found to be immune-reactive by DID Test and was fully confirmed by SDS-PAGE.
Discussion: The dog serum was isolated by Ammonium Sulphate, purified by Column Chromatography, followed by Immunobiochemical Characterization which was confirmed by SDS-PAGE by obtaining a single precipitin line of IgG by DID Test.
Keywords
DID test; Immunoglobulin G; SDS-PAGE; Column chromatography; Lowry method.
Introduction
Immunoglobulin G (IgG) is mainly responsible for secondary immune response in animals. Rodney Porter [1] and Gerald M Edelman [2] first elucidated the characteristic Y-shaped structure of antibodies. In 1972, they were awarded the Nobel Prize for Medicine and Physiology for their discovery. These Y-shaped molecules were eventually identified as immunoglobulin G (IgG), [3] the structure of which is composed of four polypeptide chains- two heavy (50KDa) and two light chains (25kDa) - linked by noncovalent bonds and disulphide bridges. R J Heddle and D Rowley during 1975 [4] measured the level of IgG in dog serum, colostrum, milk, parotid saliva and small bowel fluid using the single radial immunodiffusion method.
Abdel-Rahman, [5] obtained the molecular weights of camel IgG of four bands were 63, 52, 40, and 33 kDa, this study was conducted by SDS-PAGE. Dogs (Canis lupus familiaris) are used in biomedical research because they have certain similarities with humans. Santos F.N et al. [6] enunciated that production and characterization of IgY antibody against canine IgG is very essential for serological markers in infection and also used for elaboration of diagnostic kits. Dogs are especially suitable for cardiovascular studies due to the resemblance in heart connectivity and size to the human heart. Experiments on dogs led to the discovery of insulin to treat diabetic patients, the development of blood transfusion procedures and the creation of the electrical defibrillator to restore normal heart rhythm. The efficiency of some new cancer drugs are tested in dogs with the same cancers as humans, as they can have a benefit for both humans and dogs. So dog is used for experimentation of this study and they should be taken care of, also well maintained so that crude IgG can be isolated from them properly for immunobiochemical analysis and characterization. In this study, focus has been given on IgG because they are the most common antibody present in blood and other body fluids (75% to 80%) of all the antibodies present in the body. This antibody is capable of protecting against infection by remembering which germ is been exposed before in the body and it is the one and only antibody that can cross placenta of pregnant woman to protect the baby (foetus). So the present study is to isolate, purify and immunobiochemically characterize IgG extracted from dog serum.
Materials and Methods:
Isolation of IgG: Crude IgG was extracted from dog serum. Then dog serum (3 ml) and 4.1M concentration of ammonium sulphate (3 ml) was taken in a centrifuge tube and gently mixed. Then the tube was kept in ice at about 1 hour at 40C. After 1 hour, the tube was taken out from ice and centrifuged at 5000 rpm for 15 min at 370C.
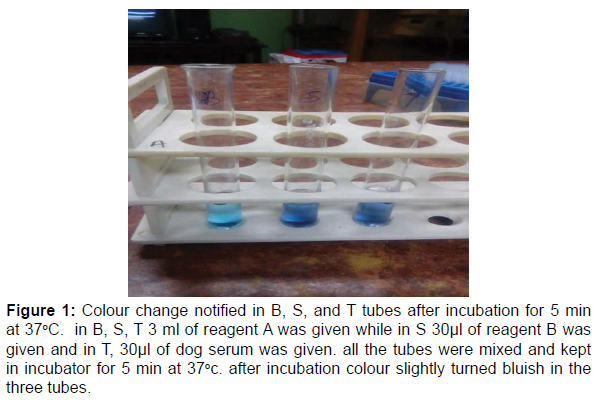
After that the supernatant was discarded out and clear precipitate was obtained which was diluted with PBS (3 ml). After dilution, the sample was mixed by vortexing and then the entire mixed sample was poured carefully into a Dialysis bag which was kept overnight at 40C. On the next day, the sample was taken out from the refrigerator and again centrifuged for 5000 rpm for 15 min to obtain the supernatant. Here the freshly obtained supernatant was considered as the Lowry Sample. After that in a separate tube 10 ml of 2% Na2CO3 (Sodium Carbonate) was taken as well as 200 μl of Na-K Tartarate (Sodium Potassium Tartarate) was also taken in the same tube and mixed properly and then the tube was wrapped carefully by an aluminium foil and kept aside. This mixture of 2% Na2CO3 and Na-K Tartarate was called Lowry Reagent. Then the three test tubes were taken Blank (B), Standard (S), and Test (T). In each of the B, S, and T tubes 3 ml of 2% Na2CO3 and Na-K Tartarate mixture was given. After that separately, in B 100 μl of distilled water (DW) was given, in S 100 μl of Bovine Serum Albumin (BSA) (BSA standard was approximately formulated at 2 mg/ml in an ultapure 0.9% sodium chloride solution) at was given and in T, 100μl of Lowry sample was given and all the tubes were mixed properly and then kept for incubation for 15 min. While the incubation was going on, in a fresh separate tube, 600 μl of Folin reagent and 600 μl of DW is taken and mixed properly with the help of micropipette. After that, the B, S, T tubes were taken from the incubator and 300 μl of Folin Reagent (FR) and DW mixture was given to each tube separately. The colour change was immediately noticed in three separate tubes and then the tubes were again kept inside the incubator for 30 min. After that the tubes were taken out and spectrophotometric readings of the three tubes were taken at 750 nm and Protein Concentration was calculated to be 122.22 mg/ml (Table 1). While on the other hand, the rest of the dog serum after completion of the ammonium sulphate precipitation experiment was taken which was later used for the calculation of Total Protein Concentration. From the rest of the dog serum, in B, 3 ml of 2% Na2CO3 was taken only. While in S, 3 ml of 2% Na2CO3 was taken and 30μl of Na-K Tartarate was taken. In T, 3 ml of 2% Na2CO3 was taken and 30μl of dog serum (remaining) was taken. All the tubes were properly mixed and set in the incubator for 5 min at 37oC. The colour change was noticed in the tubes after incubation and then spectrophotometric readings of only S and T were taken at 578 nm from where the Total Protein Concentration of the sample was calculated to be 61.47 mg/ml (Figure 1 and Table 2).
Figure 1:Colour change notified in B, S, and T tubes after incubation for 5 min at 37oC. in B, S, T 3 ml of reagent A was given while in S 30μl of reagent B was given and in T, 30μl of dog serum was given. all the tubes were mixed and kept in incubator for 5 min at 37oc. after incubation colour slightly turned bluish in the three tubes.
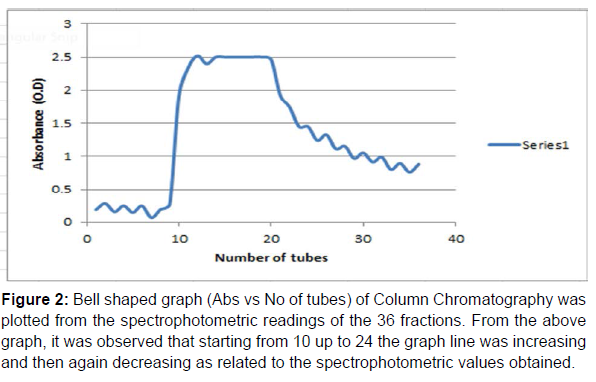
Purification of IgG: The crude IgG was purified by Column Chromatography and 36 fractions (test tubes) were taken. At first in the column 1.5 ml of the Lowry sample was given and at that time the end of the column should remain closed. After washing step of the column was done by phosphate buffer saline (PBS), 36 fractions were arranged and marked accordingly and kept under the column. After all the tubes were filled up then the spectrophotometric readings of the 36 fractions were. Then a bell shaped graph was also made (Absorbance vs no of tubes) as shown in (Table 4 and Figure 2). Then, among the 36 fractions, from test tube number (10-24), the values were gradually increasing and then decreasing, so these tubes (10-24) were considered which were kept overnight at 4oC. On the next day, the tubes (10-24) were taken out and the samples present in these tubes were kept in 5 distinct tubes, the rest of the tubes were discarded. Then 2gm of Sodium Hydroxide (NaOH) and 10 gm of Sodium Carbonate (Na2CO3) were measured and taken and dissolved in 500 ml of D W in a tube and vortexed well. The 5 tubes were there and one extra tube (named B) was taken. In a fresh tube 15 ml of 2% Na2CO3 was taken and in another fresh tube, 10 ml of 2% Na2CO3 was taken. In the 15 ml tube, 300μl of Na-K Tartarate was taken and in the 10 ml tube, 200μl of Na-K Tartarate was taken. Here, basically there are 7 tubes, one fresh B tube, one fresh S tube and five fresh T tubes (the fractions ‘10-24’ were compiled into 5 pools, called T1-T5). From the 15 ml and 10 ml tubes, 3 ml each was given in B, S, T1-T5 tubes and mixed properly. Then in B, 100 μl of DW was given. In S, 100 μl of BSA was given and from T1 to T5, samples from the 5 tubes (kept aside earlier) was given. In a separate tube, 1300 μl of Folin reagent and 1300 μl of D W was taken and mixed properly. The B, S, T1-T5 tubes were kept inside the incubator for 15min. After taking out the tubes from the incubator, 300 μl of Folin reagent and D W mixture was given in B, S, and T1-T5 tubes and mixed properly and the colour change was immediately noticed. Then the tubes were again kept inside the incubator for 30 min. After that spectrophotometric readings were taken at 750nm as shown in (Table 4). Then Protein Concentration of only T1-T5 were calculated to be 1 mg/ml, 2.069 mg/ml, 5.372 mg/ml, 3.093 mg/ml, 5.255 mg/ml.
Figure 2:Bell shaped graph (Abs vs No of tubes) of Column Chromatography was plotted from the spectrophotometric readings of the 36 fractions. From the above graph, it was observed that starting from 10 up to 24 the graph line was increasing and then again decreasing as related to the spectrophotometric values obtained.
Sl No |
Cell No/ Name | Absorbance (at 750 nm) |
|---|---|---|
| 1 (Standard) | 1- | 0.043 |
| 2 (Test 1) | 2- | 0.043 |
| 3 (Test 2) | 3- | 0.089 |
| 4 (Test 3) | 4- | 0.231 |
| 5 (Test 4) | 5- | 0.133 |
| 6 (Test 5) | 6- | 0.226 |
Table 4: Spectrophotometric readings of T1-T5 at 750 nm.
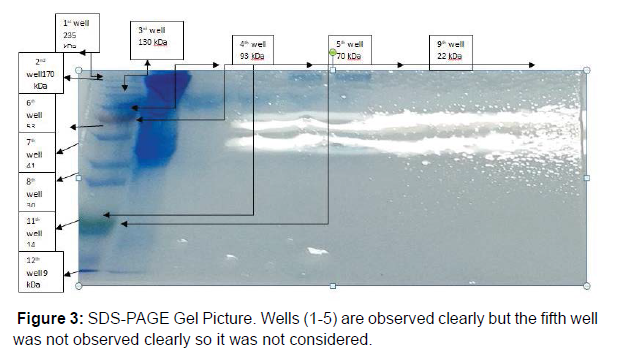
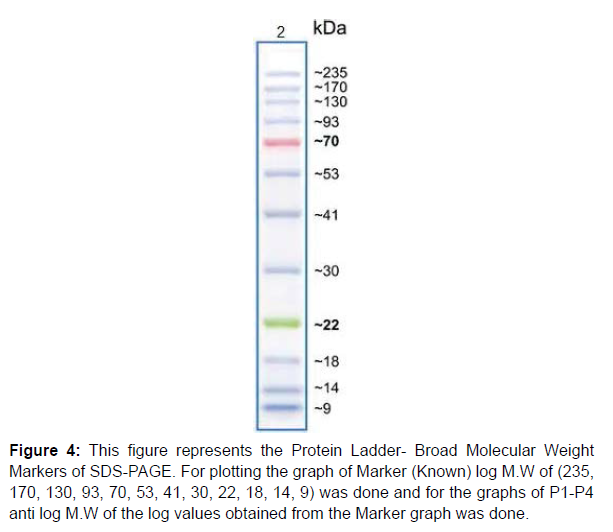
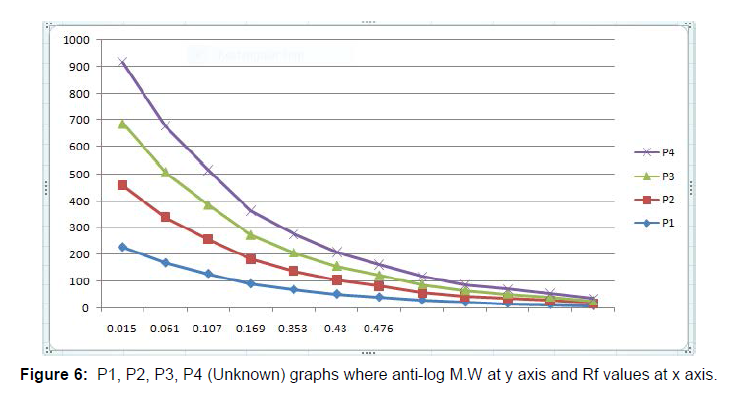
Immunobiochemical Characterization of IgG: After completion of Column Chromatography experiment Sodium Dodecyl Sulphate- Polyacrylamide Gel Electrophoresis (SDS-PAGE) was successfully done. By taking samples P1-P5 (which were earlier named as T1-T5, obtained from Column Chromatography) and Crude sample (Sample made earlier for Lowry Method) SDS-PAGE was done and the bands in the gel were obtained. Five wells were there in the gel. The first one was Marker (Known) well, the second one was P1 (Unknown) well, the third one was P2 (Unknown) well, the fourth one was P3 (Unknown) well and the fifth one was P4 (Unknown) well. The fifth well did not appear clearly so it was not considered as shown in (Figure 3). Then the Retention Factor (Rf) value of Marker and P1-P4 was calculated and logarithmic excel graph (log of Molecular Weigt vs Rf) of Marker was plotted and (anti log of Molecular Weight vs Rf) of P1-P4 were plotted accordingly with respect to the Rf values obtained. For the Calculation of Rf values of Marker and P1-P4 (P5 not considered), at first the total length of the page was measured with the help of scale. The total length of the page was 6.5 cm. Then on the basis of (Figure 3) in the first Marker well, 12 consecutive bands were observed and so the Rf values of those 12 bands were calculated. In well P1, Rf values of bands (1-7) were calculated. In P2 well, Rf values of (1-7) bands were calculated. In P3 well, Rf values of (1-7) were calculated. In P4 well, Rf values of (1-7) were calculated respectively. Now, the logarithmic excel graphs of marker and P1-P5 was plotted. For marker (log of M.W vs Rf) graph was plotted and for P1-P4 (anti log of M.W vs Rf) were plotted considering (Figure 4). The Log values of Marker (Known) graph were calculated to be Log (235) is 2.36, Log (170) is 2.23, Log (130) is 2.11, Log (93) is 1.96, Log (70) is 1.84, Log (53) is 1.72, Log (41) is 1.61, Log (30) is 1.47, Log (22) is 1.34, Log (18) is 1.25, Log (14) is 1.14, Log (9) is 0.95. On the basis of these log values the marker graph was obtained shown in (Figure 5). The Log values of P1-P4 (Unknown) were calculated to be Anti-Log (2.36) is 229.08, Anti-Log (2.23) is 169.82, Anti-Log (2.11) is 128.82, Anti-Log (1.96) is 91.2, Anti-Log (1.84) is 69.18, Anti-Log (1.72) is 52.48, Anti-Log (1.61) is 40.73, Anti-Log (1.47) is 29.51, Anti-Log (1.34) is 21.87, Anti-Log (1.25) is 17.78, Anti-Log (1.14) is 13.8, Anti-Log (0.95) is 8.91. On the basis of these Anti-Log values the graphs of P1-P4 were obtained as shown in (Figure 6). After that, Double Immunodiffusion (DID) Test was performed. At first in a small beaker D W was taken and heated in a microwave for some few minutes and then taken out. After that, 100 ml of PBS was poured into a conical flask and heated in a microwave. After heating the conical flask was taken out and 1.5 gm of agar was dissolved into it. Then two slides were taken out and washed thoroughly. The conical flask containing PBS and agar mixture is again heated inside the microwave for complete dissolve of the agar. Then the PBS and agar was poured carefully over the two slides with the help of a pipette and left for 2 hour for solidification. After solidification, in each of the two slides four wells were made, so total eight wells were made. In each of the well of the slides just one drop of PBS and agar mixture was given. After that in first slide, in the first well 20μl of Goat IgG was given. In the second well 20μl of Rabbit anti goat IgG was given. In the third well, 20μl of Rabbit anti goat IgG was given. In the fourth well, 20μl of Goat IgG was given. Then, in the second slide, in the first well 20μl of Goat IgG was given. In the second well 20μl of Rabbit anti goat IgG was given. In the third well, 20μl of Rabbit anti goat IgG was given. In the fourth well, 20μl of Goat IgG was given. Then the slides were kept for incubation overnight. On the next day, the slides were taken out from the incubator to observe the bands in the well as shown in (Figure 7). Hyper-immune serum was raised in rabbit against crude IgG of dog. Single precipitin line was observed in DID Test when the partially purified IgG was reacted with hyper-immune serum. At first, the wells of the DID slides were raised with Goat IgG and Rabbit-Anti goat IgG. Then a single precipitin line of purified IgG of canine dog was observed against antiserum developed in rabbit.
The Total Protein Concentration was calculated on the basis of the following formula:

Figure 4:This figure represents the Protein Ladder- Broad Molecular Weight Markers of SDS-PAGE. For plotting the graph of Marker (Known) log M.W of (235, 170, 130, 93, 70, 53, 41, 30, 22, 18, 14, 9) was done and for the graphs of P1-P4 anti log M.W of the log values obtained from the Marker graph was done.
Results
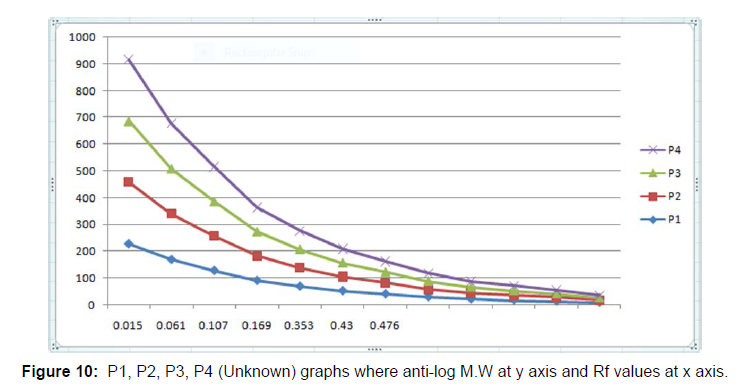
Hence, the present study was focused on how to isolate IgG from dog serum by Ammonium Sulphate Precipitation method followed by Lowry Method and Total protein Concentration, then to purify the IgG by Column Chromatography and for immunobiochemical characterization of this antibody, it was done by SDS-PAGE followed by DID test. In case of isolation protein concentration was calculated to be 122.22 mg/ml (Table 1) and total protein concentration was calculated to be 61.47 mg/ml (Figure 1 and Table 2). The purification of IgG was also estimated from (Table 3 and Figure5), from where the spectrophotometric readings of 36 fractions were taken obtaining a bell shaped curve. For the immunobiochemical characterization of IgG, in case of Marker (Known), the Rf values of 12 consecutive bands were calculated to be 0.061 cm, 0.076 cm, 0.12 cm, 0.18 cm, 0.24 cm, 0.33 cm, 0.47 cm, 0.56 cm, 0.73 cm, 0.78 cm, 0.90 cm, 0.95 cm. In case of P1 (Unknown), the Rf values of 6 consecutive bands (here the fifth band was not observed properly, so the band was calculated) were calculated to be 0.015 cm, 0.061 cm, 0.092 cm, 0.169 cm, 0.415 cm, 0.476 cm. In case of P2 (Unknown), the Rf values of 7 consecutive bands were calculated to be 0.015 cm, 0.061 cm, 0.123 cm, 0.169 cm, 0.353 cm, 0.430 cm, 0.492 cm. in case of P3 (Unknown), the Rf values of 7 consecutive bands were calculated to be 0.015 cm, 0.061 cm, 0.123 cm, 0.169 cm, 0.338 cm, 0.415 cm, 0.461 cm. In case of P4 (Unknown), the Rf values of 7 consecutive bands were calculated to be 0.015 cm, 0.061 cm, 0.107 cm, 0.169 cm, 0.353 cm, 0.430 cm, 0.476 cm. Now, the logarithmic excel graphs of marker and P1-P5 was plotted. For marker (log of M.W vs Rf) graph was plotted and for P1-P4 (anti log of M.W vs Rf) were plotted considering Figure 8. The Log values of Marker (Known) graph were calculated to be Log (235) is 2.36, Log (170) is 2.23, Log (130) is 2.11, Log (93) is 1.96, Log (70) is 1.84, Log (53) is 1.72, Log (41) is 1.61, Log (30) is 1.47, Log (22) is 1.34, Log (18) is 1.25, Log (14) is 1.14, Log (9) is 0.95. On the basis of these log values the marker graph was obtained shown in Figure 9. The Log values of P1-P4 (Unknown) were calculated to be Anti-Log (2.36) is 229.08, Anti-Log (2.23) is 169.82, Anti-Log (2.11) is 128.82, Anti-Log (1.96) is 91.2, Anti- Log (1.84) is 69.18, Anti-Log (1.72) is 52.48, Anti-Log (1.61) is 40.73, Anti-Log (1.47) is 29.51, Anti-Log (1.34) is 21.87, Anti-Log (1.25) is 17.78, Anti-Log (1.14) is 13.8, Anti-Log (0.95) is 8.91. On the basis of these Anti-Log values the graphs of P1-P4 were obtained as shown in (Figures 10 and 11).
| Sl No | Cell No/ Name | Absorbance (750 nm) |
|---|---|---|
| 1 (Standard) | 1- | 0.018 |
| 2 (Test) | 2- | 2.200 |
Table 1: Protein Concentration of sample (mg/ ml) of lowry method.
Sl No. |
Cell No/ Name | Absorbance (578 nm) |
|---|---|---|
| 1 (Standard) | 1- | 0.166 |
| 2 (Test) | 2- | 0.157 |
Table 2: Total Protein concentration method.
Sl No |
Absorbance (at 280 nm) |
|---|---|
| 1. | 0.190 |
| 2. | 0.284 |
| 3. | 0.158 |
| 4. | 0.250 |
| 5. | 0.147 |
| 6. | 0.249 |
| 7. | 0.070 |
| 8. | 0.195 |
| 9. | 0.274 |
| 10. | 1.914 |
| 11. | 2.344 |
| 12. | 2.520 |
| 13. | 2.399 |
| 14. | 2.500 |
| 15. | 2.500 |
| 16. | 2.500 |
| 17. | 2.500 |
| 18. | 2.500 |
| 19. | 2.500 |
| 20. | 2.462 |
| 21. | 1.922 |
| 22. | 1.744 |
| 23. | 1.449 |
| 24. | 1.447 |
| 25. | 1.237 |
| 26. | 1.325 |
| 27. | 1.114 |
| 28. | 1.153 |
| 29. | 0.968 |
| 30. | 1.055 |
| 31. | 0.913 |
| 32. | 0.988 |
| 33. | 0.800 |
| 34. | 0.895 |
| 35. | 0.761 |
| 36. | 0.882 |
Table 3: Spectrophotometric readings of 36 fractions of column chromatography.
Figure 8:This figure represents the Protein Ladder- Broad Molecular Weight Markers of SDS-PAGE. For plotting the graph of Marker (Known) log M.W of (235, 170, 130, 93, 70, 53, 41, 30, 22, 18, 14, 9) was done and for the graphs of P1-P4 anti log M.W of the log values obtained from the Marker graph was done.
Discussion
Crude IgG was obtained after Ammonium Sulphate Precipitation which was dialysed against PBS which could be corresponded with Duong-Ly K [7] and Miller, [8]. The protein concentration of crude IgG from dog serum was determined by the method of Lowry et al 1951 [9] and the result was 122.22 mg/ml. The total protein concentration of the serum sample was obtained 61.47 mg/ml. which almost corresponded to Kresge et al. [10]. Purified dog IgG was prepared by Column Chromatography and the respective graph was obtained according to the spectrophotometric values. This result was almost similar to that of Still et al. [11]. From the Column Chromatography, the total protein concentrations of the samples (T1-T5) were obtained as 1mg/ml, 2.069 mg/ml, 5.372 mg/ml, 3.093 mg/ml, and 5.255 mg/ml respectively. The crude and purified samples were analysed by one-dimensional SDSPAGE by Reynolds et al. [12]. Here the respective bands were obtained of marker and from P1-P4. The P5 well did not appear clearly, so it was not considered. The Rf values of the individual bands of the respective wells (Marker, P1-P4) were calculated to obtain the graphs. The graphs were obtained by calculating the logarithm of the molecular weight of protein-ladder markers. These results could be corresponded to the experiments conducted by Staikos et al. [13] Manning et al. [14] Hartinger et al. [15]. Margolis et al. [16] Wiltfang et al. [17] Guan et al. [18] Pederson et al. [19] After that a single precipitin line of purified IgG of Canine dog observed against antiserum developed in Rabbit (DID) which can be corresponded to Graham [20]. Ouchterlony, O. [21] who showed precipitin line in purified IgG desorbed from diphtheria bacteria by in-vitro method for testing the toxin producing capacity.
Conclusion
This was a novel work which opened a new dimension regarding isolation, purification and immunobiochemical characterization of IgG from dog serum. The use of immobilized antigens for the isolation of antibodies seemed to be an optimal method in the field of Column Chromatography which was based on extremely specific interactions. The antibodies could either be used to purify natural proteins or be used for recombinant protein purification in conjunction with other methods. For proteomic and genomic projects, protein separation from plasma, serum, cerebrospinal fluid (CSF), urine, and other body fluids or cellular sources were considered to be an important step. Novel antibodies could be uncovered from autoimmune disease patients. Traditionally, IgG binding proteins, generally produced by gram positive bacteria was widely explored in antibody isolation. It was anticipated that the improvements of these methods would have great influence on large scale production of antibodies, and of course the generation of new affinity based methods for the increasing number of proteins and antibody derivatives available for the protein engineering and the proteomics revolution.
References
- Porter RR, Weir R C (1966) Subunits of immunoglobulins and their relationship to antibody specificity. J Cell Physiol 67: 51-64.
- Edelamn GM et al (1969) The Covalent Structure of an entire Gamma G Immunoglobulin Molecule. Proc Natl Acad Sci USA 63: 78-85.
- Porter RR (1972) Lecture for the Nobel Prize for Physiology or Medicine 1972: Structural Studies of Immunoglobulins. Scand J Immunol 34: 381-389.
- Heddle R.J and Rowley D (1975). Dog immunoglobulins. I. immunochemical characterization of dog serum, parotid saliva, colostrums, milk and small bowel fluid. Immunology 29: 185-95.
- Abdel-Rahman EH, El-Jakee JK, et al (2017) Preparation of Goat and Rabbit Anti-Camel Immunoglobulin G Whole Molecule Labeled with Horseradish Peroxidase. Vet World 10: 92-100.
- Santos F.N (2014). Production and Characterization of IgY against Canine IgG: Prospect of a New Tool for the Immunodiagnostic of Canine Diseases. Braz arch boil technol 57: 523-531.
- Duong –Ly K (2014). Salting Out of Proteins Using Ammonium Sulphate Precipitation. Methods in Enzymology 541:85-94.
- Miller SA, Dykes DD, Polesky H F (1988) A simple salting out procedure for extracting DNA from human nucleated cells. Nucleic Acids Res 16:1215
- Lowry OH, Rosebrough N J, Lfarr A, Randall RJ (1951) Protein measurement with the Folin phenol reagent. J Biol Chem. 193:265-75.
- Kresge N, Simoni RD, Hill RL (2005) The most highly cited paper in publishing history Protein determination by Oliver H. Lowry. J Biol Chem 280:e26-e28.
- Still WC, Kahn M, Mitra A (1978) Rapid chromatographic technique for preparative separations with moderate resolution. J Org Chem 43:2923-2925.
- Reynolds JA, Tanford C (1970) Binding of dodecyl sulfate to proteins at high binding ratios. Possible implications for the state of proteins in biological membranes. Proc Natl Acad Sci 66:1002-1007.
- Staikos G, Dondos A (2009) Study of the sodium dodecyl sulphate–protein complexes: evidence of their wormlike conformation by treating them as random coil polymers. Colloid and Polymer Science 287:1001-1004.
- Manning M, Colón W (2004) Structural basis of protein kinetic stability: resistance to sodium dodecyl sulfate suggests a central role for rigidity and a bias toward β-sheet structure. Biochemistry 43:11248-11254.
- Hartinger J, Stenius K, Högemann D, Jahn R (1996) 16-BAC/SDS–PAGE: a two-dimensional gel electrophoresis system suitable for the separation of integral membrane proteins. Anal Biochem 240:126-133.
- Margolis J, Kenrick KG (1969) Two-dimensional resolution of plasma proteins by combination of polyacrylamide disc and gradient gel electrophoresis. Nature 221:1056-1057.
- Wiltfang J, Arold N, Neuhoff V (1991) A new multiphasic buffer system for sodium dodecyl sulfate‐polyacrylamide gel electrophoresis of proteins and peptides with molecular masses 100 000–1000, and their detection with picomolar sensitivity. Electrophoresis 12:352-366.
- Guan Y, Zhu Q, Huang D, Zhao, S, Jan Lo L, et al. (2015) An equation to estimate the difference between theoretically predicted and SDS PAGE-displayed molecular weights for an acidic peptide. Scientific reports 5:1-11.
- Pederson T (2008) Turning a PAGE: the overnight sensation of SDS‐polyacrylamide gel electrophoresis. The FASEB Journal 22:949-953.
- Graham S (1996) Ouchterlony Double Immunodiffusion. The Protein Protocols Handbook. Humana Press. New Jersey.
- Ouchterlony O (1948) In-Vitro method for testing the toxin- producing capacity of diphtheria bacteria. Acta Pathol Microbiol Scand 25: 186-191.
Indexed at, Google Scholar, Crossref
Indexed at, Google Scholar, Crossref
Indexed at, Google Scholar, Crossref
Indexed at, Google Scholar, Crossref
Indexed at, Google Scholar, Crossref
Indexed at, Google Scholar, Crossref
Indexed at, Google Scholar Crossref
Indexed at, Google Scholar Crossref
Indexed at, Google Scholar Crossref
Indexed at, Google Scholar, Crossref
Indexed at, Google Scholar, Crossref
Indexed at, Google Scholar, Crossref
Indexed at, Google Scholar Crossref
Copyright: © 2022 Chatterjee P, et al. This is an open-access article distributed under the terms of the Creative Commons Attribution License, which permits unrestricted use, distribution, and reproduction in any medium, provided the original author and source are credited.
Share This Article
Recommended Journals
Open Access Journals
Article Tools
Article Usage
- Total views: 1812
- [From(publication date): 0-2022 - Mar 12, 2025]
- Breakdown by view type
- HTML page views: 1490
- PDF downloads: 322
