Is Pulicat lagoon shrinking? - An Assessment through a Geospatial Approach
Received: 27-Aug-2022 / Manuscript No. Jescc-22-73963 / Editor assigned: 29-Aug-2022 / PreQC No. jescc-22-73963 (PQ) / Reviewed: 12-Sep-2022 / QC No. jescc-22-73963 / Revised: 16-Sep-2022 / Manuscript No. jescc-22-73963 (R) / Accepted Date: 16-Sep-2022 / Published Date: 23-Sep-2022 DOI: 10.4172/2157-7617.1000641
Abstract
Pulicat lagoon is a highly intricate transitional environment located on the eastern seaboard of India. The lagoon has undergone a change in size for over thousands of years as a result of natural as well as anthropogenic causes. In this work, long-term lagoon water spread area change analysis was done by using geospatial information available since 1988. Satellite imageries from 1988, 2000, 2008, and 2014 have been interpreted. During 1988-2000, the lagoon water spread area shrunk by 5.65 Km2 (from 340.28 Km2 to 334.63 Km2) with a dynamic degree of 0.14%; between 2000 and 2008, the lagoon water spread area is augmented by 1.93 Km2 i.e.336.56 Km2 with the dynamic degree of -0.07 %; from 2008 to 2014, the lagoon area is contracted by 5.56 Km2 and reached 331.00 Km2 with the dynamic degree of 0.11%. The results confirm that the Pulicat lagoon has undergone major geomorphological changes with a reduction in its areal extent which could have resulted in pessimistic ecological brunt on the environment and individual life and assets.
Keywords: Geographical information system; Pulicat lagoon; Remote sensing; Transitional environment water spread area
Introduction
Coastal lagoons are essential and dynamic inland transitional ecosystems, which are highly susceptible to environmental factors and anthropogenic influences [1]. The lagoon water spread area is mainly altered by precipitation, surface outflow, and groundwater inputs, and other factors such as evaporation, surface outflow, and groundwater outputs, and so on [2]. In addition, the amount of water that enters and leave is mainly pivoted on anthropogenic influences. Anthropogenic escalations such as a change in land use patterns in the upstream areas and industrialization with urbanization activities play a vital threat in altering the morphological setup of these fragile ecosystems. As a result of climate variability (rising temperature as well as altered precipitation), local geology and local oceanic processes coalesce with anthropogenic causes inducing a remarkable change in lagoon water spread area leading this vulnerable transitional environment into a terminal state.
The increased access to geospatial platforms with sufficient spatial and temporal resolutions, near large-scale coverage, and low expenditure, afford the potential of monitoring lagoon water environments at the greater spatial level and extended timescales. The initial footstep towards planning the protection and sustainable management of this fragile ecosystem is to have precise and updated records. Geospatial technology plays a constantly better task in monitoring and protection, they are suitable to offer the capacity to monitor changes in water body area [3-4].
Study area
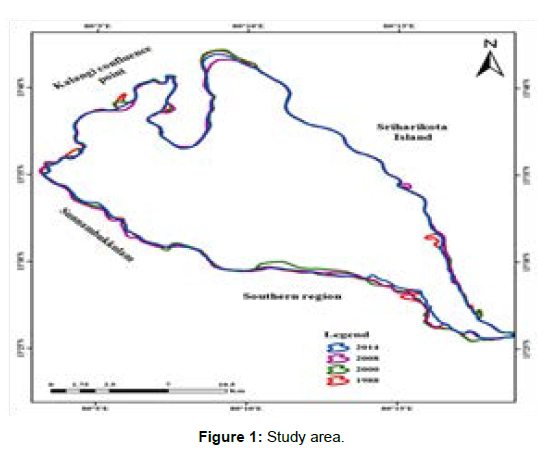
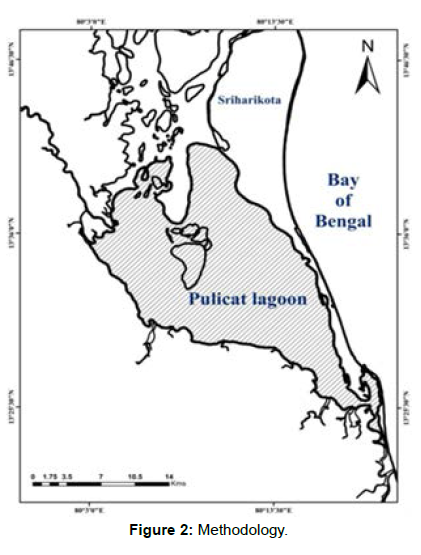
Pulicat lagoon is the second largest brackish water body next to Chilika Lake in Orissa, located in the Northern part of Chennai (13°25°-13°55°N, 80°03°- 80°19°E), and formed out of backwaters of the Bay of Bengal (Figure 1). Pulicat lagoon, also called “Lagoon of Palar Basin” [5-6] got its origin during Holocene geological period [7]. The lagoon has a length of approximately 60 km and a breadth varying from 0.2 to 17.5 km. The lagoon is drained by three major rivers namely Swarnamukhi, Arani, and Kalangi, and many minor inflows. It is connected to an estuary mouth with a width of 200 m. In the wake of its immediacy to the sea, it has turned into a salt-water lagoon. It also acts as a biodiversity hotspot on the southeast coast of India with many threatened, vulnerable, endangered, and critically endangered species listed by the International Union for Conservation of Nature (IUCN). Two colonized islands (Irukkam and Venaadu) and several unoccupied tiny mud flats are located on the northern side of the lagoon. The Buckingham Canal surpasses through the north to the south direction next to the eastern edge of the lagoon. Siltation from Swarnamukhi, Kalangi rivers, and sandbar formation at the mouth regions are the two major threats that cause danger to the complete ecological balance of this fragile ecosystem.
Data used
In order to assess the long-term lagoon water spread area, satellite data from the same season have been collected between 1988 and 2014 as shown in Table 1.
| Period | Satellite sensor | Spatial resolution (m) |
|---|---|---|
| 11-05-1988 | Landsat TM | 30 |
| 05-05-2000 | Landsat TM | 30 |
| 27-05-2008 | Landsat ETM+ | 30 |
| 28-05-2014 | Landsat ETM+ | 30 |
Table 1: Details of satellite data used.
Methodology
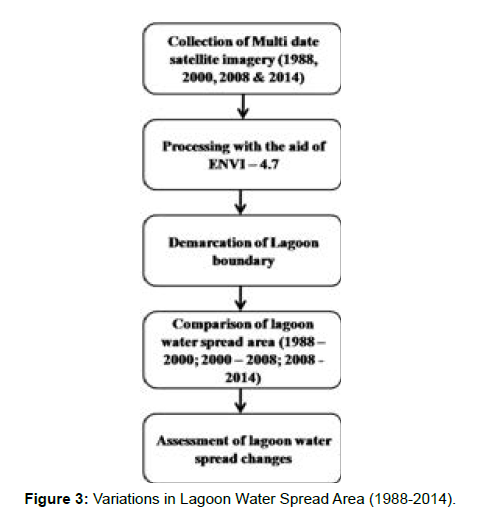
The cloud-free Landsat data was collected from USGS EARTH EXPLORER (earthexplorer.usgs.gov/), and data preprocessing progressed with ENVI 4.7. The lagoon–land boundary was digitized with the aid of ArcGIS 10.1. The vector representations of the boundary of Pulicat lagoon for 1988, 2000, 2008, and 2014 were overlaid in GIS. Figure 2 discusses the methodology followed in this study. The locations under shrinkage or expansion were demarcated by making use of the Analysis tools of ArcGIS 10.1.
To identify the change of morphology of the lagoon during various time periods and trends, the single lagoon area dynamic degree was espoused. An indicator developed by Zhao et al. (2013) was utilized to examine the alteration in the lagoon area in a particular time period

Where,
k - Dynamic indicator for the lagoon area
Ua - Lagoon area at the start date
Ub - Lagoon area at the end date
T - Timescale under consideration.
Morphological variations of Pulicat lagoon
Variations in water spread area
Digitized lagoon water spread area in 1988, 2000, 2008 and 2014 was compared with each other (Figure 3). An alternate shrinkage (in 2000 and 2014) and expansion (in 2008) in the water spread area is very much coinciding with the rainfall, resulting in net shrinkage of 9.28 km2 between 1988 and 2014 (Table 2).
| Period | Lagoon water spread area (km2) | Rainfall (mm) * |
|---|---|---|
| 1988 | 340.28 | 979.02 |
| 2000 | 334.63 | 899.33 |
| 2008 | 336.56 | 1491.7 |
| 2014 | 331.00 | 1051.4 |
| Net reduction in the water spread area between 1988 and 2014 is 9.28 km2 | ||
Table 2: Pulicat Lagoon Water Spread Area and Rainfall.
During1988 – 2000, the lagoon water spread area decreased by 5.65 km2 with a dynamic degree of 0.14%; between 2000 and 2008, the lagoon water spread area increased by 1.93 km2 with a dynamic degree of -0.07%; during 2008-2014, the lagoon boundary subsequently decreased by 2.58 km2 with the dynamic degree of 0.13% (Table 3). As stated above, the precipitation followed by surface runoff, particularly from Kalangi, Swarnamukhi and other streams contributes a major role in modifying the lagoon water spread area.
| Period | Area of change (Km2) |
Ua - Ub/Ua | Time factor |
Dynamic degree |
Lagoon status |
|---|---|---|---|---|---|
| 1988 -2000 | 5.65 | 0.017 | 0.083 | 0.14 | Shrinking |
| 2000 - 2008 | -1.93 | -0.006 | 0.125 | -0.07 | Expansion |
| 2008 - 2014 | 2.58 | 0.008 | 0.17 | 0.13 | Shrinking |
| 1988 - 2014 | 9.28 | 0.027 | 0.038 | 0.10 | Shrinking |
Table 3: Variation in Lagoon Water Spread Area (1988-2014).
Figure 3 portrays the nature of lagoon morphology and its environment. A lucid change in lagoon water spread area is noticed at the confluence point of river Kalangi revealing the dynamic processes that happened over the past decades. In line with that, the southern part of the lagoon also sustains its dynamic nature with the Bay of Bengal recognized by its footsteps. On the other hand, not much change is noticed along the north eastern part near Sriharikota which discloses the absence of natural or anthropogenic influences. Marginal changes are observed near the north western part (Sunnambukkulam) due to the confluences of minor streams.
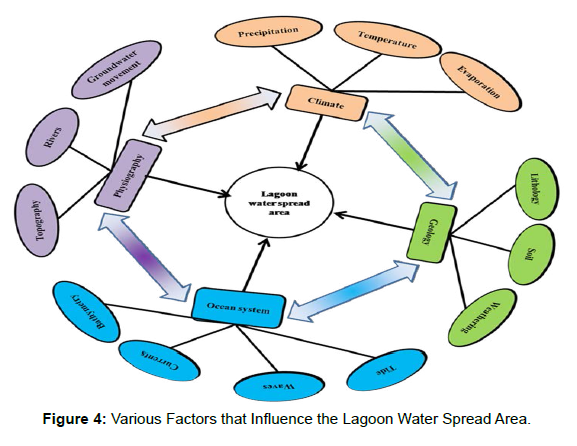
Change in lagoon water spread area is influenced by a range of causative factors. Both humans, as well as nature, play vital roles in altering the water spread area. The human role starts with modifying landscape configuration or altering land use and land cover pattern for their expedient. Apart from anthropogenic influences, nature also acting a crucial role in altering lagoon water spread area. Figure 4 enlightens various natural causative factors responsible for the lagoon water spread area changes.
Causes
The exchange of water and materials between the Pulicat lagoon and sea mainly depends upon coastal processes, tidal conditions, and cyclonic storms of the Bay of Bengal. Pulicat lagoon is mainly subjected to a limited tidal influence, the average variation between high and low tides are not often more than 30cm [8]. The lagoon is also distinguished by fairly calm waters because the barrier spit keeps off larger waves from the open sea [9-11]. Depression occurred during September 1981, severe cyclonic storms during May and October 1982, November 1984 [2], October 1985 [5], Tsunami on 26th December 2004, are all some events that cause appreciable changes along the coastal stretch of the Pulicat lagoon (Figure 4).
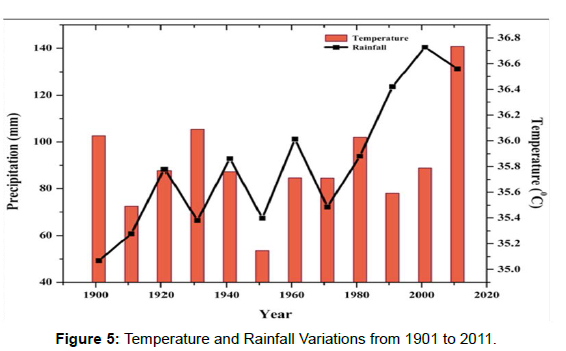
Gradually increasing temperature and shifting precipitation trends between 1901 and 2014 (Figure 5) cause considerable stress on water storage of the Pulicat lagoon.
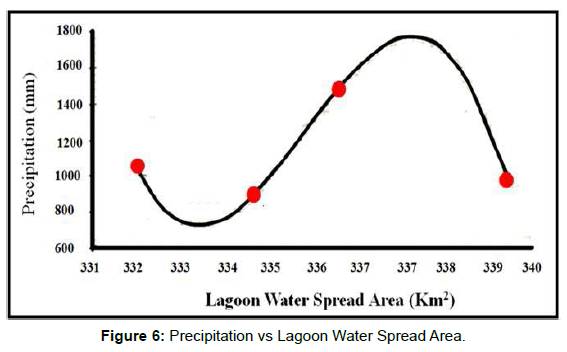
Variation in lagoon water spread area on timescales that are extended more than a century is controlled chiefly by temperature and precipitation trends. Climatic data demonstrate a steady increment in the annual precipitation and mean temperature during 1901-2010. Even though the annual temperature amplified steadily between 1988 and 2014, the annual precipitation increased slightly which leads to a significant change in the lagoon area as shown in Figure 6. This specifies that the lagoon surface area changes have a direct association with precipitation during the study period, which appears to be the most significant factor for recent lagoon shrinkage in the Pulicat lagoon.
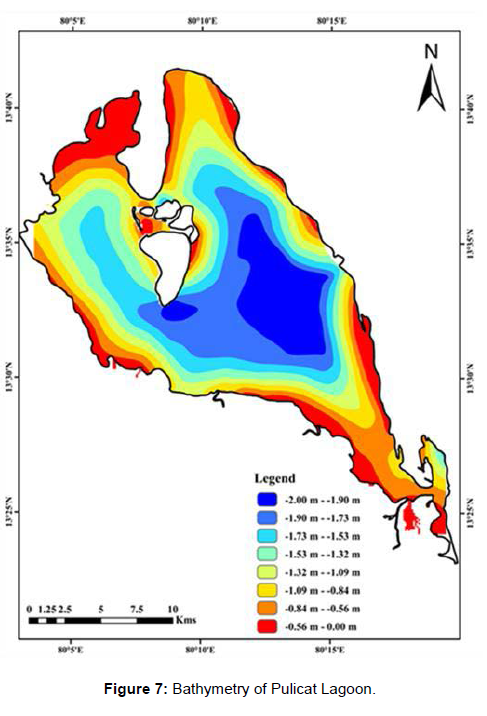
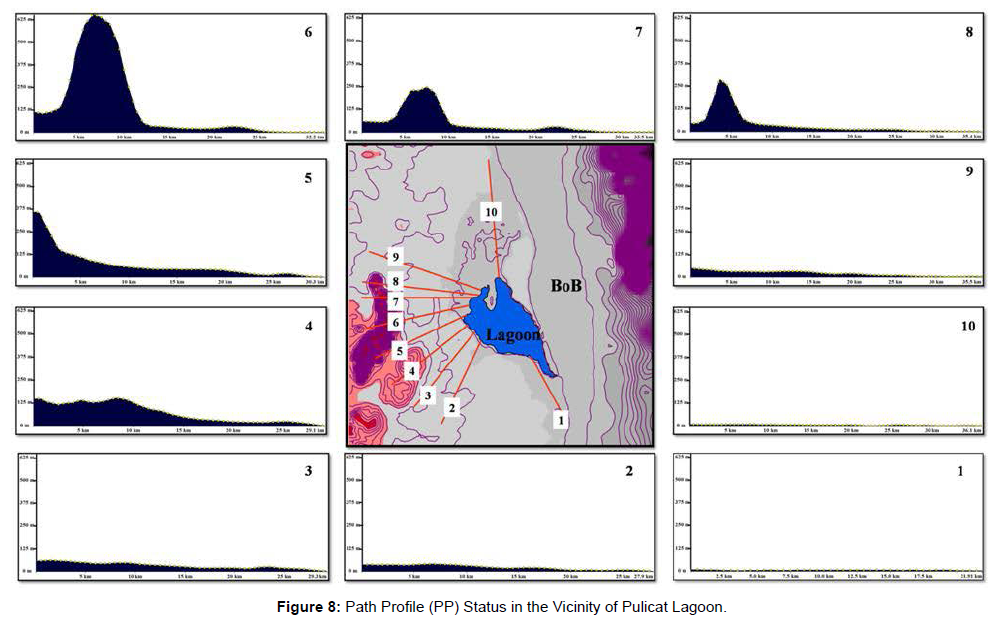
More sedimentation is inferred from the bathymetry data of 2014 collected from Integrated Coastal and Marine Area Management (ICMAM), Chennai. The maximum water depth was reduced from 6m (1970) to 2 m (Present study) (Figure 7). Maximum water depth is observed in the mid of the lagoon and nearer to Venadu island. Most of the lagoon area is shallow in nature. A gentle increment in bed slope was noticed nearer to the Kalangi confluence point indicating a higher sedimentation rate compared to the rest of the lagoon. Topography also contributes significantly to the movement of water and sediments into the lagoon. For example, in areas with high topographic relief (PP 2-9) (Figure 8), the runoff will be more and vice versa.
On the other hand, a gentle slope is noticed on the southern side of the Pulicat lagoon (PP 1 & 10) (Figure 8). Augmented water flow may change site-level hydrology as well as sedimentation rate. A drastic change in landscape configuration in the upstream areas can lead to intense sediment load in natural and artificial waterways. Pulicat lagoon receives discharges from the Buckingham Canal and two other rivers, the Arani and Kalangi, with sedimentation rates of 14.3mm/yr, 13.7mm/yr, and 15.75 mm/yr respectively [12-14]. The sedimentation rates at these discharge points are much higher as compared to the rest of the lagoon [11]. Because of sedimentation, the northern part of the lagoon is nearly dried up and has bowed the lagoon into extensive mudflats. Due to this, a large part of the lagoon becomes sterile for fisheries and is available for shorter periods for the water bird’s usage.
Lithological units in the upstream areas may also be an important indirect stricture in determining the type and amount of material got deposited in the coastal lagoon. Soft rock such as sedimentary rocks may easily undergo weathering and gets simply washed away from the source rock. Hard rocks such as crystalline rocks may not easily undergo weathering. The trail of the Kalangi and other streams is mainly formed by shale and feldspathic sandstone which are easily washed away from the source rock and got eroded.
Pulicat lagoon supports a huge and incessantly growing human population; however, many areas have been reclaimed for various purposes. As a result, the regional environment has been greatly altered over the past three decades. The effects of human activity on the lagoon in a specified area always have diverse features and depend on many issues, for instance, geomorphic uniqueness, hydrological cycling, and the types of local human actions including water conservancy projects, excavation near the mouth region, construction of breakwater, aquaculture and domestic and industrial water usage. Evaluating both the regional lagoon changes and the impacts caused by human activities in recent years is a very important factor for water resource management and the decision-making of the Local Government [5].
Conclusion
Pulicat lagoon has undergone gradual shrinkage and expansion in the water-spread area since 1988. This is mainly narrated to natural (climate, local geology, Physiography, and oceanic system) and anthropogenic influences (aquaculture and changing landscape configuration). From the authors’ point of view, the lagoon inundation resulted from increased freshwater discharge to the lagoon from Kalangi and other tributaries. A bathymetry study reveals that the maximum water depth reduced from 6m to 2 m demonstrating more sedimentation occurred during the past decades.
Linear trend analysis of mean temperature enlightens the average rate annual temperature had increased by 0.140 C. Even though the annual temperature amplified steadily between 1988 and 2014, the annual precipitation increased slightly which leads to a significant change in the lagoon area. Pulicat lagoon water spread area has decreased considerably in the 2000- 2008 and 2008- 2014 periods. Over these 14 years (2000-2014), the lagoon water spread area declined by 5.65 Km2. Net reductions in the water spread area between 1988 and 2014 is 9.28 km2. These changes are mainly attributable to reduced wet periods and also more withdrawal of water for aquaculture purposes in recent decades. Shrinking in the lagoon area has a pessimistic ecological brunt on the environment, individual life, and assets. The lagoon area is the main significant issue to ensure the environment of the lagoons’ basin and the key indicator to measure the environmental balance. This vulnerable ecosystem needs proper management measures for protection. This is very important because sustainable utilization only is the best option for maintaining the resources without deterioration.
References
- Gupta A, Asher MG (1998) Environment and the developing world: principles, policies, management. Wiley 370-376.
- Ramasastry AA, De US, Vaidya D, Sundari G (1986) Forty-day mode and medium range forecasting. Mausam 37(3): 305-312.
- Bianrong Chang, Rendong Li, Chuandong Zhu, Kequn Liu (2015) Quantitative Impacts of Climate Change and Human Activities on Water-Surface Area Variations from the 1990s to 2013 in Honghu Lake, China. Water 7(6): 2881-2899.
- Cosimo Solidoro, Vinko Bandelj, Fabrizio Aubry Bernardi, Elisa Camatti (2010) Response of the Venice Lagoon Ecosystem to Natural and Anthropogenic Pressures over the Last 50 Years. Coastal Lagoon: Environ Sci 483-512.
- Gupta H (2005) Mega-Tsunami of 26th December 2004: Indian initiative for early warning system and mitigation of oceanographic hazards. Episodes 28(1): 4.
- Prabhakar KN, Zutshi PL (1993) Evolution of southern part of Indian east coast basins. J Geol Soc India 41: 215-230.
- Das N, Desai DS, Biswas NC (1989) Cyclones and depressions over the Indian seas and the Indian sub-continent during 1987. Mausam 40(l): 1-12.
- Chacko PI, Abraham JG, Anda1 R (1953) Report on a Survey of the Flora, Fauna, and Fisheries of the Pulicat Lagoon, Madras State, India, 1951-52. Contribution from the Freshwater Fisheries Biological Station. Madras 8.
- Sanjeeva Raj PJ (2006) Macro fauna of Pulicat lagoon, NBA Bulletin No.6. National Biodiversity Authority. Chennai 67.
- Zhao RF, Chen YL, Shi PJ, Zhang LH, et al. (2013) Land use and land cover change and driving mechanism in the arid inland river basin: a case study of Tarim River, Xinjiang. J Environ Sci (China) 68:591-604.
- Ramesh R (2003) No impact zone studies in critical habitats: Pulicat lagoon ecosystem. Annual Report submitted to ICMAM - PD, Department of Ocean Development, Government of India, and New Delhi 200.
- Ramesh R, Purvaja R, Ramesh S, James RA (2002) Historical pollution trends in coastal environments of India. Environ Monit Assess 79: 151-176.
- Natesan U, Rajalakshmi PR, Vincent A Ferrer (2014) Shoreline dynamics and littoral transport around the tidal inlet at Pulicat, southeast coast of India. Continental Shelf Research 80(1): 49-56.
- Yashon O Ouma, Tateishi RA (2006) Water Index for Rapid Mapping of Shoreline Changes of Five East African Rift Valley Lakes: an Empirical Analysis using Landsat TM and ETM+ Data. Int J Remote Sens 27(15): 3153-3181.
Indexed at, Google Scholar, Crossref
Indexed at, Google Scholar, Crossref
Indexed at, Google Scholar, Crossref
Indexed at, Google Scholar, Crossref
Indexed at, Google Scholar, Crossref
Indexed at, Google Scholar, Crossref
Indexed at, Google Scholar, Crossref
Citation: Edwin Jeba Kumar G, Natesan U (2022) Is Pulicat lagoon shrinking? - An Assessment through a Geospatial Approach. J Earth Sci Clim Change, 13: 641. DOI: 10.4172/2157-7617.1000641
Copyright: © 2022 Edwin Jeba Kumar G. This is an open-access article distributed under the terms of the Creative Commons Attribution License, which permits unrestricted use, distribution, and reproduction in any medium, provided the original author and source are credited.
Select your language of interest to view the total content in your interested language
Share This Article
Recommended Journals
Open Access Journals
Article Tools
Article Usage
- Total views: 2539
- [From(publication date): 0-2022 - Nov 27, 2025]
- Breakdown by view type
- HTML page views: 2090
- PDF downloads: 449

