Introduction to Design and Manufacture of a Heart Signal Simulator and Graphic Displayer Based on the ATmega Microcontroller
Received: 21-Aug-2018 / Accepted Date: 03-Sep-2018 / Published Date: 10-Sep-2018
Abstract
The ECG Simulator is a specialized device for testing and calibrating an electrocardiogram. Using this device, can be monitor electrocardiograms and fix possible errors and problems in the ECG device. Simulator can display heart signals in different algorithms and based on the signals generated, the electrocardiographic device is evaluated. Simulator has an important function in the development and design of an electrocardiograph and is an essential medical device.
This article examines an ECG simulator device with a graphic display that can display heart signals on a display, and is based on a microcontroller that is inexpensive compared to other ECG simulators, and has Architecture is simple.
Simulator designed based on two ICs 4521 and 4017, which is used for frequency division and counter. The quartz crystal to produce a proportional frequency, which is the frequency to set up ICs and Electrocardiograms, can be generated based on capacitor and resistor connections.
The displayer of this device is based on a microcontroller, which has a simple programming to indicate the signal obtained from the simulator on the LCD.
Keywords: ECG simulator; Electrocardiogram; Cardiac; Microcontroller; Displayer
Introduction
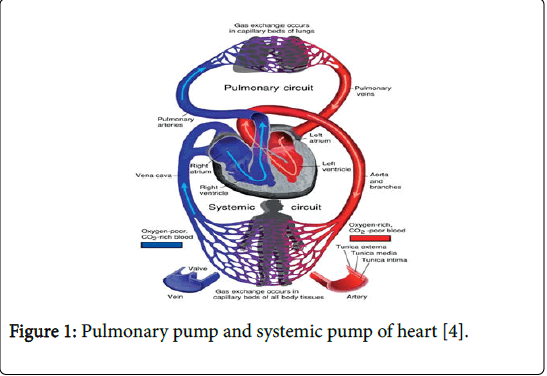
The heart is a conical member that is oblique in the middle mediastinum, which is covered by a curtain called pericardium, which is fibrosis [1,2]. The heart consists of a dual pump consisting of a pulmonary pump and systemic pump (Figure 1) [3]. The heart is made up of specialized electrical cells, which create electrical impulses in the heart.
Figure 1: Pulmonary pump and systemic pump of heart [4].
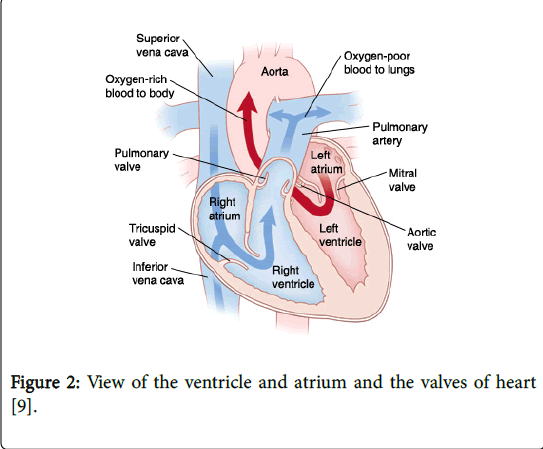
Electric impulses are transmitted to myocytes, and myocytes cause the contraction of the heart muscle [5]. The heart has two small holes called an atrium and two large holes called ventricles, separated by walls [6]. The heart consists of four valves called mitral, tricuspid, pulmonary and aortic, each of which has its own task (Figure 2) [7,8].
Figure 2: View of the ventricle and atrium and the valves of heart [9].
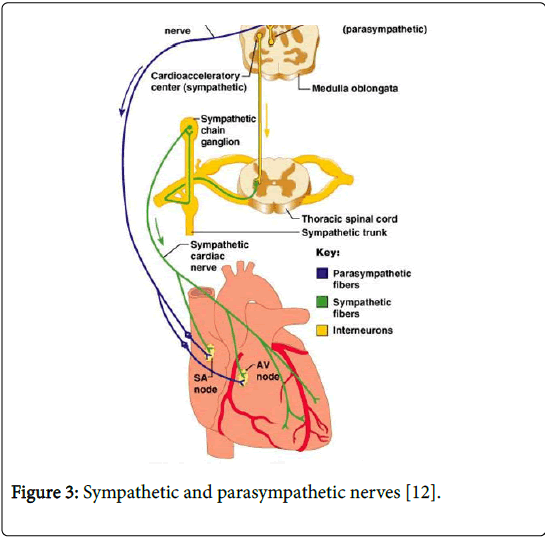
The heart of the sympathetic and parasympathetic nerves receives the nerve that the sympathetic nerves originate from the sympathetic neck nodes and sympathetic chest, and the parasympathetic nerves arise from the vagus nerve, the two nerves connecting below the aorta (Figure 3). Sympathetic nerves increase heart rate, and parasympathetic nerves reduce heart rate [10,11].
Figure 3: Sympathetic and parasympathetic nerves [12].
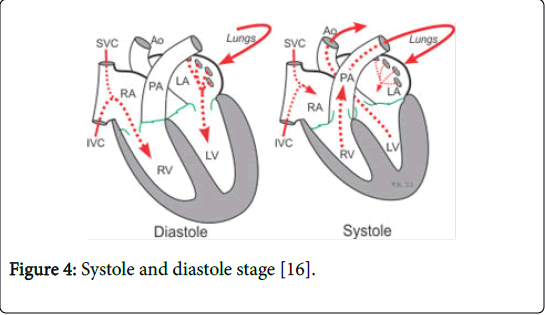
The arteries are the vessels that Take out blood directly from the heart, and the veins are the vessels that bring blood back to the heart. The arteries include aorta and pulmonary, and the veins include the pulmonary, superior vena cava and inferior vena cava [13]. The heart rate comes in two stages, called systole and diastolic, which is systolic, contractile, and diastolic phase of the cardiac rest period (Figure 4) [14].
Figure 4: Systole and diastole stage [16].
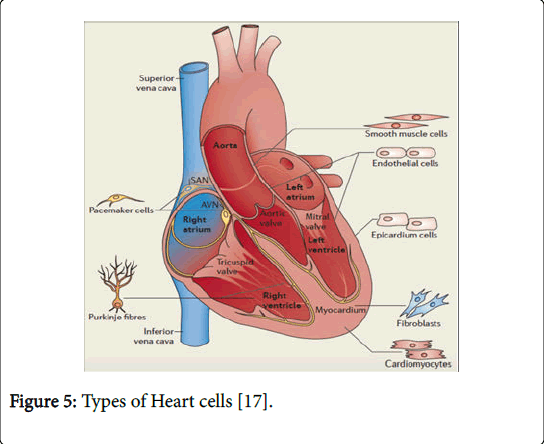
According to the electrocardiographic view, the heart has pacemaker cells, myocardial cells and electrical conductive cells, each of which plays a role in the formation of electrical activity in the heart (Figure 5). In the heart conduction system, electrical impulses flow in the heart, leading to depolarization and repolarization, and blood is pumped into the body [15].
Figure 5: Types of Heart cells [17].
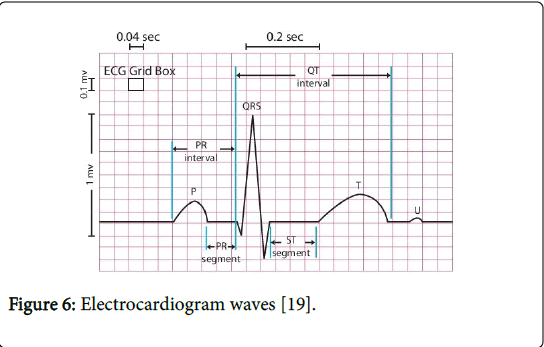
Different activities in the heart create an electrocardiogram from the heart, consisting of several parts called P wave, PR interval, QRS complex, ST segment, T wave, QT interval and U wave (Figure 6). The wave P represents the depolarization of the inside myocardium atrium. The QRS complex is due to the depolarization and contraction of the ventricles. The wave T represents the depolarization of ventricles. The QT interval represents the time needed for ventricles activity in a cardiac cycle [18].
Figure 6: Electrocardiogram waves [19].
The electrocardiograph device is responsible for recording and displaying the electrical potential of the heart, an essential diagnostic device in the medical field that can be used to monitor the status of cardiovascular function. Based on recorded signals, one can evaluate the heart health of individuals [20].
Due to the fact that the device is directly related to the patient, it should be safe and highly accurate so as not to cause any problems in the evaluation of heart signals. Therefore, checking the accuracy of diagnostic devices, especially the ECG, is important. To evaluate the ECG device, a simulator is used to simulate heart signals with different algorithms, and to check the function of the ECG device to ensure the accuracy of the ECG device [21].
Materials And Methods
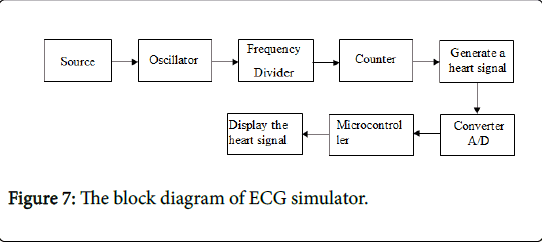
In this article, the ECG simulator was designed and built with a graphic displayer, who easily simulates heart signals; the block diagram of ECG simulator is depicted in the Figure 7.
In designing this simulator, its circuit is powered by a direct source, which causes the crystal in the circuit to start and generate the required frequency.The first IC, which is the frequency divider, divides the frequency produced by the crystal and transfers it to the second IC, which is the second IC type of counter. By activated different pins second IC and with series and parallel connections of capacitor and resistors, electrocardiograms can be generated and create a normal heart signal.
The first IC can generate a signal in two different quantities, which can be used to make the heart signal in the maximum and minimum state. To display the electrocardiogram signal produced by simulator, a displayer was used, which is made of a graphic LCD. In this block of diagrams, the analog-to-digital converter converts the amount of analogue obtained from the simulator to a digital level.
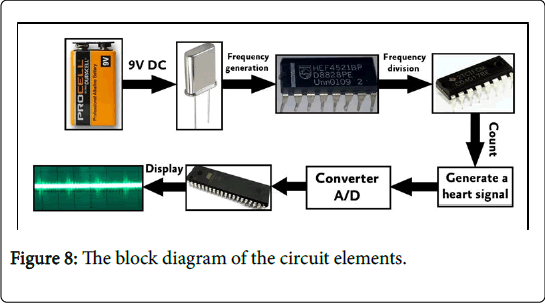
Then, the necessary processing and analysis is done by the ATmega32 microcontroller compiled by the BASIC language. Finally, the signal is amplified by the operational amplifier. The heart signal obtained by the Simulator is displayed on the LCD [22]. The block diagram of the circuit elements and their operation is shown in Figure 8.
Measurements
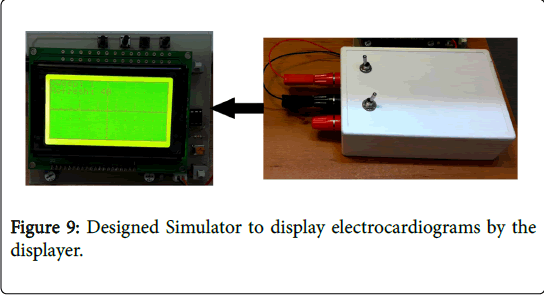
By connecting the simulator to the oscilloscope, electrocardiograms generated by the simulator can be displayed and calculated the heart rate according to the signal. Also, these electrocardiograms can be displayed using a displayer designed to display an electrocardiogram (Figure 9).
Results
This paper focuses on the design of an ECG simulator, which is made up of very simple electronic circuitry, making it easy and low costs. This Simulator is made up of accessible ICs and low cost elements. The simulator also has a display that can quickly display the signal on the graphic LCD and perform the necessary calculations and examinations with speed and accuracy. The display is based on a programmable microcontroller, which can be used to start the microcontroller with BASIC language and using the necessary processing and analysis. This signal is almost accompanied by very little noise caused by lines of power and ground.
Discussions
In this research, the design and construction of a simulator of heart signals was investigated. This simulator consists of electronic components, including IC frequency dividers, IC counters and various types of capacitors and resistors. This simulator has a very simple design than other simulators, and its construction is not complexity. This simulator can be built with the smallest number of electronic components, so it is very low cost. This simulator does not require any programming, and with the two existing ICs, can be create heart signals.
In this paper, to enhance the ability of this simulator, we used a displayer to display heart signals. Thus, by connecting the simulator to the displayer, the cardiac signals can be graphically displayed accurately and quickly. The displayer consists of a microcontroller that is programmed in BASIC language. This microcontroller displays clearly a heart signal by connecting to a graphic LCD. This displayer is very inexpensive than other displayers and has a simple programming. The displayer also has the ability to adjust and can display a variety of waveforms with this displayer.
Finally, by connecting the simulator to the displayer can be having a complete and accurate ECG simulator. It has the ability to display the heart signal and also portable. Other simulators are more cost-effective and also require more design and programming, and most of these simulators have no graphical display and cannot display the heart's signal simultaneously.
In the future, for the better performance of this simulator, using the FIR (Finite Impulse Response) filter, it eliminates the sinusoidal noise, which has an Impulse Response with Finite Time. If the Impulse function is applied to the input filter, the output will be zero after the sample N; this filter type will also be used to remove noise from ECG signals.
Also, a low pass filter in the circuit output can be used to remove the noise in the Simulator circuit. To enhance this simulator, the number of channels in this simulator can be increased so that every 12 leads of the ECG can be evaluated.
Conclusion
In this article, an ECG simulator was investigated. The simulator has a simple electronic circuit and, based on its simple architecture; it can be easily and produced at a low cost. The simulator is made up of portable and inexpensive elements, which can accurately display the heart signal and evaluate the ECG device. This simulator is portable, and signals from the Simulator can be displayed on the display, and the electrocardiogram can be quickly evaluated and tested.
References
- Burazor I, Aviel-Ronen S, Imazio M, Markel G, Grossman Y, et al. (2014) Primary malignancies of the heart and pericardium. Clin Cardiol 3: 582-588.
- Zhang Y, Aleman J, Arneri A, Bersini S, Piraino F, et al. (2015) From cardiac tissue engineering to heart-on-a-chip: Beating challenges. Biomedical Materials 10: 1-16.
- Chung L, Farber H, Benza R, Miller DP, Parsons L, et al. (2014) Unique predictors of mortality in patients with pulmonary arterial hypertension associated with systemic sclerosis in the reveal registry. Chest 146: 1494-1504.
- http://anatomyandphysiologyi.com/wp-content/uploads/2013/08/The-Systemic-and-Pulmonary-Circuits.jpeg
- Maltsev V, Yaniv Y, Maltsev AV, Stern MD, and Lakatta EG (2014) Modern perspectives on numerical modelling of cardiac pacemaker cell. J Pharmacol Sci 125: 6 – 38.
- Sheng J, Shim W, Lu J, Lim SY, Ong BH, et al. (2014) Electrophysiology of human cardiac atrial and ventricular telocytes. J Cell Mol Med 18: 355-362.
- Jana S, Tefft B, Spoon D and Simari R (2014) Scaffolds for tissue engineering of cardiac valves. Acta Biomater 10: 2877-2893.
- Shirzadfar H, Khanahmadi M, Mahlouji E and Mokhtari S (2018) Wavelet technique and function for noise removal from ecg signal. Int J Bioinform Comput Biol 3: 1-5.
- https://api.kramesstaywell.com/Content/6066ca30-310a-4170-b001-a4ab013d61fd/ucr-images-v1/Images/front-view-cross-section-of-heart-showing-atria-on-top-and-ventricles-on-bottom-showing-aorta-pulmonary-artery-mitral-valve-a
- Dick TE, Hsieh YH, Dhingra RR, Baekey DM, Galan RF, et al. (2014) Cardiorespiratory coupling: Common rhythms in cardiac, sympathetic, and respiratory activities. Prog Brain Res 209: 191-205.
- Shirzadfar H, Ghaziasgar M, Piri Z, Khanahmadi M (2018) Heart beat rate monitoring using optical sensors. Int J Biosen Bioelectron 4: 48–54.
- https://steemitimages.com/DQmSTAFW2Zwp8MN4k585S8yte2zVVEqXtPwXvXm3o2eodU5/507504.jpg
- Corada M, Morini FM and Dejana E (2014) Signaling pathways in the specification of arteries and veins. Arterioscler Thromb Vasc Biol 38: 1-6.
- Tang W, Wang Z, Shrestha K, Borowski AG, Wu Y, et al. (2015) Intestinal microbiota-dependent phosphatidylcholine metabolites, diastolic dysfunction, and adverse clinical outcomes in chronic systolic heart failure. J Card Fail 21: 91-96.
- Liu L, Qian Z, Qin Q, Shi M, Zhang H, et al. (2015) Effect of melatonin on oncosis of myocardial cells in the myocardial ischemia/reperfusion injury rat and the role of the mitochondrial permeability transition pore. Genet Mol Res 14: 7481-7489.
- https://www.cvphysiology.com/uploads/images/HD002%20cardiac%20flow%20during%20systole-diastole.gif
- https://www.researchgate.net/profile/Saleh_Alkarim/publication/308967538/figure/fig2/AS:[email protected]/Cell-types-of-the-heart-Xin-Olson-Bassel-Duby-2013b.png
- Yochum M, Renaud C and Jacquir S (2016) Automatic detection of P, QRS and T patterns in 12 leads ECG signal based on CWT. Biomed Signal Process Control 25: 46-52.
- https://i.pinimg.com/originals06/f3/e9/06f3e9df62b4a504af4f7f316fbf58f3.jpg
- Al-Hamadi H, Gawanmeh A and Al-Qutayri M (2014) Formalizing Electrocardiogram (ECG) Signal Behavior in Event-B. The 1st International Workshop on Reliability of eHealth Information Systems: 55-60.
- Behar J, Andreotti F, Zaunseder S, Li Q, Oster J, et al. (2014) An ecg simulator for generating maternal-foetal activity mixtures on abdominal ecg recordings. Physiol Meas 35: 1-17.
- Shirzadfar H and Khanahmadi M (2018) Design and development of ecg simulator and microcontroller based displayer. J Biosens Bioelectron 9: 1-9.
Citation: Shirzadfar H, Khanahmadi M (2018) Introduction to Design and Manufacture of a Heart Signal Simulator and Graphic Displayer Based on the ATmega Microcontroller. J Biol Med Sci 2: 107.
Copyright: © 2018 Shirzadfar H, et al. This is an open-access article distributed under the terms of the Creative Commons Attribution License, which permits unrestricted use, distribution, and reproduction in any medium, provided the original author and source are credited.
Share This Article
Open Access Journals
Article Usage
- Total views: 5988
- [From(publication date): 0-2018 - Apr 18, 2025]
- Breakdown by view type
- HTML page views: 5009
- PDF downloads: 979

