Integration of Geo: Spatial and RUSLE Techniques for Soil Loss Estimation and to Identify Potential Soil and Water Conservation Measures in the Northern Ethiopia
Received: 31-Jan-2023 / Manuscript No. jescc-19-1263 / Editor assigned: 01-Feb-2023 / PreQC No. jescc-19-1263 / Reviewed: 14-Feb-2023 / QC No. jescc-19-1263 / Revised: 21-Feb-2023 / Manuscript No. jescc-19-1263 / Accepted Date: 21-Feb-2023 / Published Date: 28-Feb-2023 DOI: 10.4172/2157-7617.1000669 QI No. / jescc-19-1263
Abstract
Soil erosion is one of the most severe land degradation challenges in the Ethiopia Highlands which causes siltation of large reservoirs and decline of agricultural production and productivity. This is also happening in the lake Hayq, the northern Ethiopia resulting in series agro-ecological imbalance. Improper cultivation, deforestation and rapid population growth are the main driving forces for this natural hazard. However, scientific studies are hardly found to see the impacts happening on the study area. Hence, present study was conducted with the aim of estimating the rate of soil loss and identifies potential soil and water conservation measures to be introduced in the area. Revised Universal Soil Loss Equation (RUSLE) with an integration of geo-spatial technologies applied to address the stated objectives. The RUSLE model used six important spatial factors namely rainfall data taken from Ethiopian national metrology agency, soil data, slope length and steepness derived from Digital Elevation Model (DEM), vegetation coverage from NDVI and conservation practice implemented were used. These raster baseline maps were prepared using different soft wares derived from various sources. Finally, the raster data added to the RUSLE environment model to evaluate and estimate the soil erosion loss. Similarly, potential conservation measures identified based on social acceptance, conservation performance, labor cost for implement and maintenance. Multi-criteria decisionmaking methods used to rank the conservation measures using the principle of analytic hierarchy process. The finding of this study indicated that the minimum annual soil loss estimated was zero in the outlet area which is less than the minimum tolerable soil loss 2 metric ton/ha/yr. Whereas the maximum annual soil loss was estimated to be 76.8 ton/ha/yr in steep area which is far from the maximum tolerable soil loss (18 ton/ha/yr). Generally, the mean annual soil loss from the catchment was estimated 22.8 ton/ha/yr which accounted a total of 131,966.4 ton/ha/yr soil loss. Of the total catchment, 39.4% (1860.1 ha) of the catchment area lie from non to slightly soil loss; 34.4% (1987 ha) of the catchment under moderately soil loss; 26.2% (1514.9 ha) of the catchment estimated high to very high soil loss. This result is comparable with household’s perception. Finally, the intervention map of the study area was prepared by integration of GIS, RS and RUSLE model and multi-criteria analysis applicable for conservation planning program and sustainable land management and sound soil and water conservation measures in erosion prone areas. To conclude, the study shows the effectiveness of GIS and RS techniques together with RUSLE model in estimating soil loss which can be used as a panacea for decision making such as for water resource infrastructure planning and establishment. But, such scientific studies demanded more comprehensive, reliable and accurate input data for better outcome and decision making.
Keywords
Soil and water conservation; RUSLE; Geo-spatial; Lake Hayq; Soil loss
Introduction
Land degradation is a decline in land quality and productivity which is a serious threat to food security of the rural people in the world [1]. Therefore, there is an urgent need to resolve the global challenge to produce more food to feed rapidly raising global population. Soil erosion by water has direct negative effect on global agriculture. It induces annual fluxes of 23 Mt-42 Mt (megaton) N and 14.6 Mt P-26.4 Mt P off agricultural land [2]. It is the most serious form of land degradation both on-site and off-site productivity effects which threaten the food security globally and the national economy of the country in particular [3]. Annually, Ethiopia loses over 1493 million tons of topsoil from the highlands due to erosion, which could add about 1.5 million tons of grain to the country’s harvest [4]. Furthermore, about affected by soil erosion with an estimated average of 20 t ha−1 yr−1 and measured amounts of more than 300 t ha−1 yr−1 on specific plots [5]. As a consequence, it is estimated that more than 30,000 ha of the country’s cropland will be out of production annually [6]. Ethiopia is a country with greatly vary wide range geographical diversity, wide range of climatic zones and diversity of agricultural crops have great impact in soil erosion process. A quantitative estimate of soil erosion by water is a key component of land use management plans. Soil erosion risk differs spatially because of heterogeneous topography, geology, geomorphology, soil types, land use land cover. Geographical Information Systems (GIS) is able to handle these Identification of Potential Soil and Water Conservation Measures in the 43% (537,000 km2 ) of the total highland areas of Ethiopia are highly spatially variable data easily and efficiently. The estimation of soil erosion with the support of GIS techniques lessens costs and improves accuracy [7]. Identifying spatial pattern of soil erosion using geo-spatial and RUSLE is an important strategy to reduce on site soil degradation and off-site sediment yield. Based on the survey of carried out by MoWR. The maximum depth of lake Hayq (the study area) felt down from 84 m to 81 m only within the last seven years. Other study done indicated that there is a continuous depth reduction due to land use land cover change of the watershed and high rate of sedimentation. According to, the rapidly growing population in the lake catchment is the main driver for Land Use Land Cover changes (LULC) observed in the area. Increased human population pressure and the need for more agricultural land forced the local community to cultivate land up to the periphery area of lake shore. As a result, the lake is characterized with a serious soil erosion problem in the catchment inducing heavy sediment load flowing [8].
To undertake corrective measures and prevent further degradation of the catchment, timely spatial and temporal information on the extent and distribution of the eroded areas on the catchment is vital. Such spatial evidence is essential for cost effective soil and water conservation measures to be introduced to manage such ongoing environmental problems. A large scale management program like lake Hayq catchment is not possible to restore all degraded areas at once due to spatial variability in erosion severity and financial and labor constraints. Therefore, it is necessary to focus on watershed restoration efforts on selected watershed areas giving special attention which need immediate action [9]. This can be a major step in enabling the community to minimize both on-site and off-site effects of land degradation in the long run.
Thus, identification of the hot-spot areas of erosion for prioritizing areas of intervention is best options for reducing further soil degradation, reclaiming the degraded areas of the lake catchment and improving the land productivity of the catchment [10]. To do so, RUSEL model integration with geo-spatial adopted and used successfully by different researchers. This model is one the of the soil erosion estimation models that is most widely used by many scholars. It is an empirical and parametric model which has been tested and validated under diverse soil, climate and management conditions. Under these circumstances, Geographical Information System (GIS) and Remote Sensing (RS) become valuable tools to achieve more satisfactory results in the assessment of the soil erosion risk at large catchment scale.
Remote Sensing has been used to identify and map erosion hot spot areas. GIS has made a tremendous impact in many fields of application, because it allows ease of data collection, data update, data management and data presentation in forms most suited to user requirements. At the same time, it allows for vast amounts of information on different themes and from different sources to be integrated [11]. The results of identifying potential site for water and soil conservation techniques in the study area should be feasible in terms of economic, social and scientific aspects which can be used as baseline data for the decision makers and stalk holders who are working on environmental protection and watershed management programs. This study deals with the integration of geo-spatial and RUSLE to estimate the rate soil loss and identify potential soil and water conservation measures to be implemented for the lake of Hayq, in the northern Ethiopia.
Materials and Methods
Description of study site
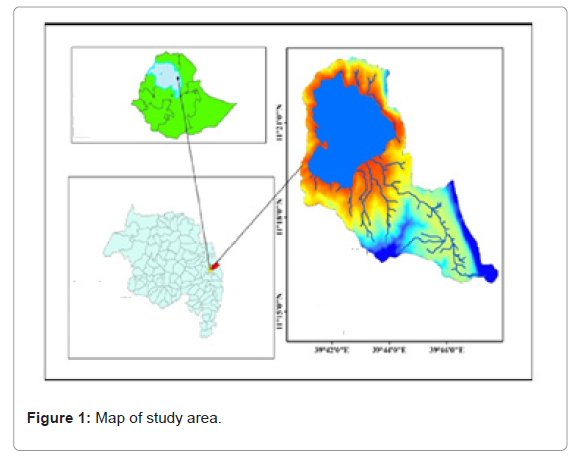
The study area (lake Hayk) catchment is located in the northern central part of Ethiopia in Amhara regional state in the north east escarpment of south Wollo, at 430 km Northeast of Addis Ababa. It is also located between 11°16’ N to 11°23’ N longitude and 39°41’ E to 39°68’ E latitude respectively. The elevation ranges from 1882-2704 m.a.s.l. with a mean elevation of 2090 m.a.s.l. The total coverage of the study area accounts 8012 hectare including the lake surface (Figure 1).
Data sources and methods used
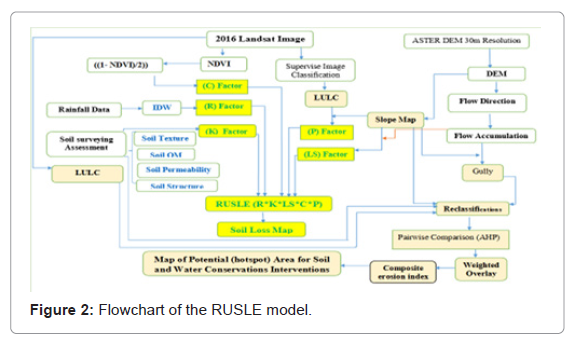
The overall methodology employed for the present study was mainly including Revised Universal Soil Loss Equation (RUSLE) model under the GIS interface environment. RUSLE model was adopted because it is suitable for prediction of the soil loss in Ethiopian high lands and appropriate the because of data availability and also recommended as gives good results. The most important factors acquired from meteorological stations, field survey, topographic maps, satellite images and Digital Elevation Model (DEM). Each determinant independent layer was built for each factor in the RUSLE and combined by cell-grid modeling procedures in ArcGIS to estimate the soil loss in a spatial domain [12]. In this study, the six main parameters of the RUSLE were used to estimate the soil loss and identify areas need interventions. The most important most parameters determining RUSLE model were collected from different sources. The fifteen years (2001-2016) annual rainfall data were collected from Ethiopian national metrological agency, soil types were collected from 19 site of study area through transact soil sampling methods while the land use/land cover of 2016 was extracted from land-sat satellite Olli image to analysis ‘C’ factor using NDVI index. While the digital elevation model with 30 m × 30 m resolution was used to drive slope Length and Slop steepness (LS factor) using ArcGIS software. Finally, the soil loss estimation was derived from rain fall data (R) erosivity factor, erodibility (K factor) was taken from laboratory result of soil sample of study site, (P factor) from land management of ground survey of the study area. At the end, the input data of the six RUSELE parameters was analyzed and modeled within ArcGIS and RUSLE interface.
Revised universal soil loss equation and associated variables
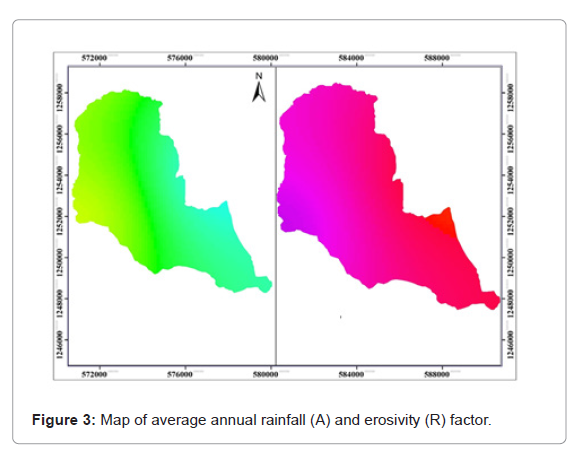
Erosivity factor: The capacity of erosion agent to cause soil detachment and transport is called erosivity. The R factor represents the erosive force of a specific rainfall event [13]. It was calculated according to the equation derived from a spatial regression analysis later suggested for the Ethiopian conditions as given below. The erosivity factor was analyzed from neighboring five metrological stations of lake Hayk catchment and interpolated using Inverse Distance Weighted (IDW) method to estimate the unknown values. It is widely used because of its simplicity in principle, speed in calculation, easiness in programming and credibility in interpolating surface [14]. The maximum and annual rainfall minimum annual rainfall was registered in Wuchale and Bati stations respectively, look below for detail (Table 1).
| No. | Name of stations | Elevation | Longitude | Latitude | Average annual RF | Erosivity factor (R_factor) |
|---|---|---|---|---|---|---|
| 1 | Bati | 1660 | 40°01'54" | 11°19'67" | 757.5 | 4119.5 |
| 2 | Kombolcha | 1857 | 39°71'76" | 11°08'39" | 905.2 | 4931.7 |
| 3 | Hayk | 1985 | 39°68'02" | 11°30'53" | 1070 | 5838 |
| 4 | Kutaber | 2672 | 39°53'44" | 11°27'62" | 891.1 | 4854.2 |
| 5 | Werebabo | 2382 | 39°46'25" | 11°20'27" | 969.1 | 5283.3 |
| 6 | Wuchale | 1949 | 39°36'20" | 11°31'03" | 1344.3 | 7346.7 |
Table 1: Mean annual rainfall and erosivity value (2001-2016).
p>Soil erodibility factor: Different soil types have different speed of erosion caused by detachment and transportation [15]. Soil erodibility in this study was calculated using key soil parameters such as soil texture, organic matter, structure and permeability [16]. It was generated on the basis of soil texture and organic matter content described in the soil survey report of the study area. Soil samples were taken based on FAO, soil classification system using transact walk of lower, medium and upper catchment. Multiple soil samples from 18 places were gathered taken to soil laboratory and analyzed the organic matter, organic carbon content, textural class. The value of (K) ranges from 0, minimum to 1, maximum value respectively. The K factor represents both susceptibility of soil to erosion and the amount and rate of runoff [17]. Soil texture, organic matter, structure and permeability determine the erodibility of a particular so [18]. The structural and permeability of the factor was determined as given by Renard, below (Table 2).k=2.1*10^4(12-OM) M^1.14+3.25(s-2)+2.5(p-3)/100 ...........Eq(2)
| Texture | Organic Content (OC) | Organic Matter (OM) | M value | Structure | Permeability | Erodibility (K) |
|---|---|---|---|---|---|---|
| Sandy loam | 1.23 | 2.12 | 6806.25 | 3 | 2 | 0.54 |
| Clay | 2.29 | 3.95 | 3906.25 | 4 | 6 | 0.35 |
| Loam | 1.65 | 2.84 | 5625 | 3 | 3 | 0.4 |
| Silty clay | 1.31 | 2.27 | 6006.25 | 4 | 6 | 0.56 |
| Clay loam | 1.55 | 2.68 | 1806.25 | 3 | 4 | 0.16 |
| Clay loam | 1.31 | 2.26 | 4556.25 | 3 | 4 | 0.41 |
| Clay | 0.97 | 1.67 | 3025 | 4 | 6 | 0.34 |
| Sandy loam | 0.96 | 1.66 | 8556.25 | 3 | 2 | 0.67 |
| Clay loam | 0.82 | 1.41 | 2500 | 3 | 4 | 0.22 |
| Clay loam | 3.29 | 5.68 | 4900 | 3 | 4 | 0.27 |
| Clay | 1.69 | 2.91 | 756.25 | 3 | 6 | 0.09 |
| Clay loam | 1.71 | 2.94 | 2256.25 | 3 | 4 | 0.18 |
| Clay | 2.21 | 3.8 | 2025 | 3 | 6 | 0.16 |
| Clay loam | 1.88 | 3.24 | 358.47 | 3 | 4 | 0.04 |
| Sandy loam | 1.23 | 2.12 | 6806.25 | 3 | 2 | 0.54 |
| Clay | 0.97 | 1.67 | 3025 | 4 | 6 | 0.34 |
| Loamy sand | 2.22 | 3.83 | 8556.25 | 4 | 2 | 0.66 |
| Clay | 1.69 | 2.91 | 756.25 | 3 | 6 | 0.09 |
Table 2: Soil texture and associated erodibility factor values.
p> Where: K-Soil erodibility factor (ton/ha) (ha.hr/MJ.mm)M-(% silt+% very fine sand) × (100% clay)
OM-% of organic matter
S-Soil structure code
P-Permeability code
Slope length and steepness factors: In RUSLE model, the effects of topography on soil erosion is estimated by the slope Length (L) and slope Steepness (S). It has been demonstrated that an increase in slope length and slope steepness can give higher overland flow velocities and correspondingly higher erosion [19]. Slope length is defined as the horizontal distance from the origin of overland flow to the point where deposition begins or where runoff flows into a defined channel [20]. The steeper the slope, the higher the velocity and erosive power of the runoff were expected. For this study, the value of flow accumulation and slope gradient were derived from DEM of 30 m × 30 m resolution and Slope Length (L) value was calculated as given by indicated in equation 1, 2 and 3 while steepness (S) value was calculated using the formula derived by and suggested by indicated in equation 4. Using raster calculator in ArcGIS environment, the final map of LS factor was prepared using both slope length and slope steepness corrospondly. The value ranges from 0 to 249 with 0.15 and 3.28 mean and standard deviations.
Slope Length (L) factor derived from (λ/22.13) m ...........Eq (3)
Were λ indicated (slope length*flow accumulation*Grid sell size) m is rill to inter rill ratio
M derived from (β/1+β) ...........Eq (4)
Where β indicated slope in degree.
β=(sin (β)/0.896)/(3(sin (β) 0.8+0.56)) .......... Eq (5)
S=−1.5+17/(1+e(2.3-6.1 sinβ)) .......... Eq (6)
Vegetation coverage factor
Land cover land use factor represents the ratio of soil loss under a given land cover [21]. Usually, the C factor was derived using empirical equations based on the measurements of many variables related to ground covers collected in the sample plots. It represents the protective coverage of canopy and organic material in direct contact with the ground [22]. It is measured as the ratio of soil loss from land cropped under specific conditions to the corresponding loss from open, fallow and continuously up and down tilled land [23]. The more soil which is uncovered by vegetation during before and after tillage the greater the risk of erosion both by water and wind while in more coverage lands intercept rainfall and reduce soil erosion. To prepare the, “C” factor for this purpose, the landsat satellite 8 image 2016 was taken to analysis the representative vegetation cover map of the catchment. Near Infrared red (band 5) from 0.85 μm-0.88 μm and red band (band 4) from 0.64 μm-0.67μm, were used to estimate normalize vegetation coverage index. The value of NDVI and coverage factor was inversely correlated. The coverage factor was found high in barren lands and low in the densely forest area. The NDVI value ranges from -1 to +1. The densely forest and grass lands have highest value as compared to barren land. The NDVI value were converted to Coverage (C) factor based on the equation [-NDVI+1/2] proposed by in tropical country like Ethiopia.
Management practice factor
The management factor is the erosion control practice or land management factor which represents the soil conservation operations or other measures that control the erosion [24]. It is measured as the ratio of soil loss with a specific support practice to the corresponding loss with ploughing up and down slope [25]. The P-factor ranges from zero to one depending on the soil management activities employed in specific plot of land. In the present study, ‘P’ value was calculated by delineating the land based on steepness and land use class. Cultivated land was classified into six classes on the bases of slope class and P-factors were analyzed based on the formula derived by Wischmeier and Smith and later suggested by Bewket and Tefera, adopted for the Ethiopian conditions [25]. Integration of slope map, field information and land use land cover change map were used to choose suitable value for P factors. Finally, the slope and land use map intersect and join with field information in spatial analysis tools using 10.1 version Arc GIS software. Which means land use and slope intersects were joined with field measurements value from exile spread sheet (Table 3 and Figure 2).
Results
Soil loss based on annual precipitation (R) factor
The finding showed that the minimum and the maximum R factor value for the study area varies from 4119.5 MJ mm ha−1 to 7346.7 MJ mm ha−1 year−1, the central, south, southwest and southeast parts experienced high erosivity factor [26]. The distribution of erosivity (R) factor value ranges from. The two nearest stations, Hayk and Werebabo metrological stations were found with highest rainfall distribution. The intensity of the erosivity was higher in the South West of the area characterized by high steep, high velocity and high runoff also high then detachment of soil from the surface of earth happened [27]. The fifteen years annual rainfall results 54% of rainfall intensity observed on July and August. At the beginning of rain season (June and April) most of cultivated lands are uncovered and soil disturbance increased through cultivation therefore the rate of detachment from soil surface was happened. Different studies indicate that soil erosion rates is expected to change in response to changes in climate for a variety of reasons, the most direct of which is the change in the erosive power of rainfall [28]. A study carried out in Ethiopia, North Shewa, specifically Andit Tid Watershed indicated i.e R factor value was estimated from 1110 MJ mm h-1 ha-1 y-1 to 7,209 MJ mm h-1 ha-1 y-1. Other similar study conducted by Tadess in northern Ethiopia, Beshilo basin presented that the rainfall erosivity value rates from 1533 MJ mm h-1 ha-1 y-1 to 4083 MJ mm h-1 ha-1 y-1 (Figure 3).
Soil loss based on erodibility (k) factor
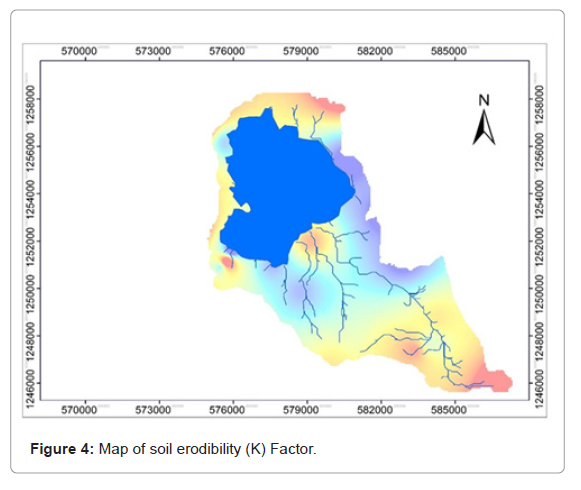
Soils change in their resistance to erosion which is a function of a range of soil properties like texture, structure, soil moisture, roughness and organic matter content. It was developed from soil survey data and analyzed for each soil unit. The finding erodibility (K) factor ranges from 0.035 Mg h MJ−1 mm−1 to 0.645 Mg h MJ−1 mm−1 respectively. In this study, the minimum soil loss was found in an area where the K value ranges from 0.035 Mg h MJ−1 to 0.2 Mg h MJ−1 value. In contrast, the maximum soil loss was found in an area where the K value, 0.2 Mg h MJ−1 to 0.64 Mg h MJ−1. Areas dominated by clay soil has low K value with low response of soil detachment but areas with sand and silt soil have high K value and high response of erosion [29]. Therefore, erodibility factor varies with soil texture, aggregate stability, shear strength, infiltration capacity and organic matter and chemical content of the soil. The physical, chemical and mineralogical soil properties and their interactions that affect K values are many and varied. As areas with highest K factor value was located in the northern, southern and somewhat in the western part of the study area [30]. However, the eastern and central part of the area has low K value. Similar study done in the northern Ethiopia, eastern Tigray by Ephrem presented K factor value, 0.2 to 0.25. Generally, different soil types have different speed of erosion caused by detachment and transportation (Figure 4).
Soil loss based on slope Length and Steepness (LS) factor
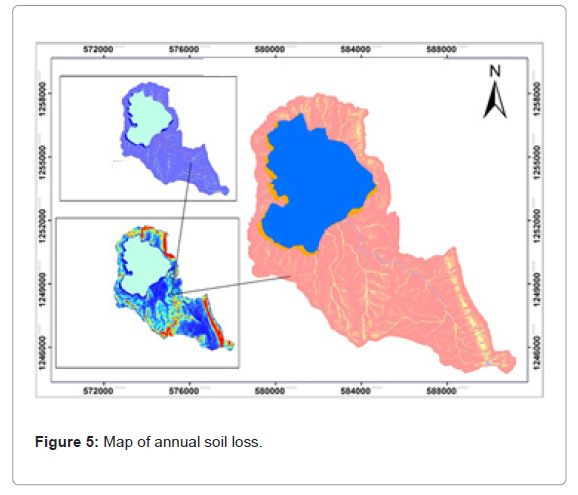
The calculated slope length result ranges up to 64 m whereas the slope percentage ranges from 0.05% to 14.07%. The two combined factors (LS) value ranges zero in flat area and 249 in steepest area. High (LS) factor value observed in high steep slope in the south east and south west of study area which results high soil loss estimation. Low (LS) factor value and non to slight soil loss observed in flat/gently topographic area. Steeper slopes can cause higher runoff velocities so that more splashes i.e contribute greater soil erosion. This result also verifies using field information data [31]. To verify the result obtained from DEM, the researchers carried out field measurement of slope length and steepness in the field. Based on the analysis, using paired sampling test, there is no substantial variation between measured and derived LS values from ASTER DEM and this DEM can be used as a reliable data source for LS factor guess [32]. Similarly, LS values have already been reported by various researchers in various areas and landscapes including in Koga watershed, northwestern Ethiopia; Borena district, south Wollo; Geleda watershed of blue Nile basin. All of these studies unanimously agreed that higher LS factor values are observed in hilly and mountainous areas with very steep topography i.e are highly susceptible to such sever soil erosion hazards (Figure 5).
Soil loss based on vegetation coverage (C) factors
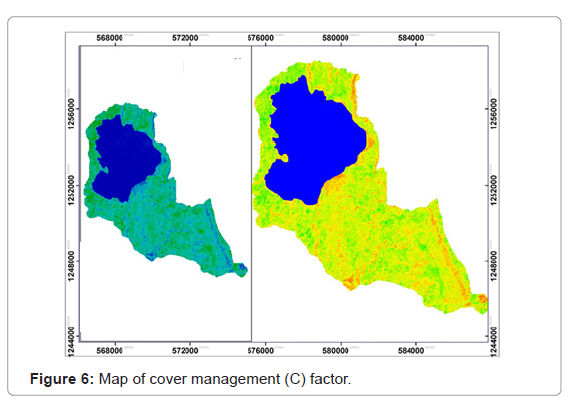
Vegetation coverage is one of the major factors which affect soil erosion. The higher vegetation coverage, the lower response of erosion due to vegetation canopy interception and hinders velocity of rain water which increases infiltration rate. This factor was acquired from Normalize Difference Vegetation Index (NDVI) in GIS environment with a value, -0.3 to 0.66. The lower NDVI value was represented water body, bare land and uncovered cultivated land while higher NDVI value symbolized forest land, grass land and shrub lands [33]. The Western and South Western of Ethiopia has low NDVI value whereas the Eastern and Northern part of the study are lie with higher NDVI values. Vegetation coverage (C) factor map derived from NDVI map using the formula adopted in tropical country like Ethiopia. The result of vegetation coverage (C) factor in this study ranges 0.3 to 0.66. Higher (C) value and high soil erosion estimation observed in bare and cultivated land while lower (C) value low soil erosion estimation observed in forest, grass and shrub lands [34]. In general, vegetation can reduce soil erosion through reducing raindrops, increasing the degree of infiltration of water drop into the soil so that diminishes the speed of the surface runoff. Then, this in turn improves the soil physical and bio-chemical properties. Thus, soil cover in the form of crop plants, mulches or residues can shield soils from wind and water erosions. Such physical measures enhance water infiltration and help to maintain agro-ecological balance system and this has an impact to less soil erosion vulnerability hazard (Figure 6).
Soil loss based on support practice (P) factor
Conservation practice factor were derived from the ratio of soil loss for a given practices to that up and down of slope farming. The (P) value was calculated by delineating the land use map based on slope class. Cultivated land was reclassified into six groups based on the slope steepness and (P) values were assigned 0.11, 0.12, 0.14, 0.19, 0.25 and 0.33 for slope class of 0%-2%, 2%-5%, 5%-8%, 8%-15%, 15%-30% and >30% respectively. Shrub lands and grass lands were assigned (P) value of 0.80 from different studies while other lands were assigned (P) value of 1. The higher conservation structures implemented in the study area have low (P) value and less soil loss rate occurred while in area without conservation practiced have high (P) value and high to extreme soil loss rate were also happened [35]. The prevention of erosion and runoff on crop fields across varied slopes has been recognized through construction of traditional furrows, waterways, some graded bunds, terracing and contour plough. The P factor represents the ratio of soil loss with a specific support practice to the corresponding soil loss. Vegetation can diminish soil erosion through reducing raindrops, increasing the degree of infiltration of water drop into the soil so that lessens the speed of the surface runoff. Then, this in turn increases the soil physical and bio-chemical properties. Thus, soil cover in the form of crop plants, mulches or residues can protect soils from wind and water erosions. Such physical measures enrich water infiltration and help to maintain agro-ecological balance system and this has an impact to less soil erosion vulnerability hazard (Figure 7).
Estimation of annual soil loss estimation
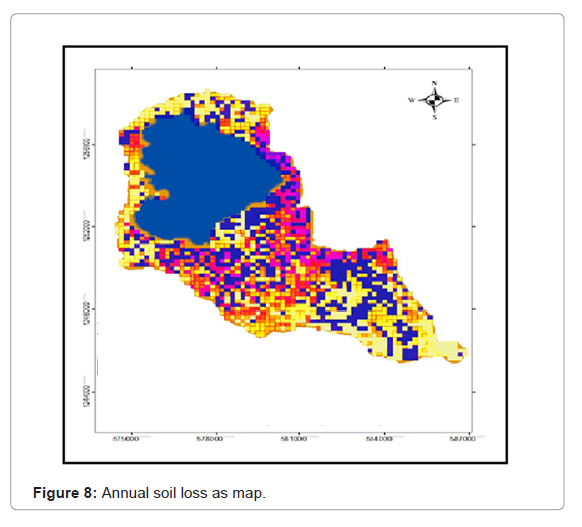
The final soil loss map was derived by combining six RUSLE factors. Erosivity factor is a natural factor which cannot control it directly but the rest factors such as erodibility, topographic, coverage and conservation practices factors were manage using participatory approach of conservation measurements. Based on the result of RUSLE factor generation the maximum soil loss resulted from bare and cultivated lands while minimum soil loss occurred in forest lands [36]. The mean annual soil loss in area estimated 22.8 tone ha-1yr-1 which makes a total of 189,846.4 tone ha-1yr-1 soil loss were estimated from total coverage of study area. The soil loss rate estimated and the spatial patterns of study area were generally representative, in related to what can be detected in the field as well as results from previous studies. For instance the maximum and average annual soil loss in koga watershed was estimated 716 and 32.2 metric ton ha-1yr-1 respectively [37].
A study conducted by quantitatively estimated mean annual soil loss ranges from nearly 0 to 504.6 with mean annual soil loss of 30.6 ton ha-1yr-1 in Jabitehinan Woreda. The study conducted by the annual soil losses in south Wollo area estimated average of 36.5-53.8 tons ha- 1yr-1. The predicted soil loss of this study area also within the range of soil loss estimated for the Ethiopian highlands by the Soil Conservation Research Project (SCRP) which ranges from 0.00 to 300 tone ha-1yr-1. Multi-criteria evaluation was determined by composite erosion index which indicated the intensity of soil loss in the catchments. High erosion index and low erosion index indicated the maximum and minimum soil erosion intensity within the catchment respectively. Other similar studies carried out in Wollo, Gelana sub-watershed in the north Ethiopia by Asmame publicized that the mean annual soil erosion was estimated 24.3 t ha-1 y-1. Furthermore, studies conducted in the north Ethiopia, Guang watershed, in the north Gonder by and in the Geleda watershed, the blue Nile basin by presented that the mean soil erosion estimated 24.95 t ha-1 y-1 and 23.7 t ha-1 y-1 respectively. Moreover, a study by Shiferaw in Ethiopia, in Borena district, south Wollo presented that the mean annual soil loss was found 27 t ha-1 y-1 which is little bit higher than the two studies. Studies by in the northwestern Ethiopia in Jabi Tehinan district and in Koga watershed, north western Ethiopia, the mean annual soil loss was found 30.6 t ha-1 y-1 and 47.4 t ha-1y-1 correspondingly.
Therefore, taking the present study area, Maybar watershed as references, the first two studies mentioned above are almost similar with this study finding. However, the 3rd, particularly the 4th and 5th studies mean annual soil loss result are highly deviated from the present study with a range value 6.2 t ha-1y-1 and 23.1 t ha-1y-1 respectively. The deviation could be brought due to the biological and physical measures particularly the soil and water conservation measures implemented in the last decades in the Maybar watershed in particular and in the north Ethiopia in general as compare to the western Ethiopia. This indicates that watershed based soil and water conservation measures implemented in the study area reduces soil loss specifically in the upper and middle parts of the watershed. However, the some part of the watershed is still highly threatened by this natural hazard thus it needs great attention to reclaim. The current estimated soil loss rate is generally realistic compared to results from previous findings. Due to resource scarcities, implementing soil conservation interventions in the entire watershed at a time is not feasible. Thus, prioritization of intervention areas based on the severity and risks of soil erosion is mandatory (Figure 8).
There are six categories of soil loss risk ranging from low (0 t ha−1 y−1-11 t ha−1 y−1) to extreme (100 t ha−1 y−1-245 t ha−1 y−1). According to these sources, the area was classified under low class soil loss (0 t ha-1 y-1-11 t ha-1 y-1), moderate soil loss (11 t ha-1 y-1-18 t ha-1 y-1), high soil loss class (18 t ha-1 y-1-30 t ha-1 y-1), very high soil class (30 t ha-1 y-1-50 t ha-1 y-1), severe class of soil loss (50 t ha-1 y-1-100 t ha-1 y-1) and very severe class (100 t ha-1 y-1-245 t ha-1 y-1) respectively. About 56% of the study area was categorized into low to moderate soil loss class which is under Soil Loss Tolerance (SLT) values ranging from 2 t ha-1 y-1 to 18 t ha-1 y-1 and this is similar with a study done. While the remaining, 26% of the study area was found under high, very high and very severe erosion severity classes. Generally, the rate of loss for these classes are higher than the maximum tolerable soil loss, which is 18 t ha-1 y-1 for the Ethiopia as suggested by Hurn. And these areas contributed about 44.18% of the soil loss estimated in the study area. A study carried out by Habtamu and Amare in south Ethiopia, Wondo Genet watershed presented that 54.54% of the soil loss was arisen from 23.5% of the area. On the other hand, in the priority class VI, the amount of soil loss is a bit little in fact these areas contributed 40.5% of total annual soil loss. But, the rate of soil loss is below the acceptable soil loss range. Therefore, undertaking soil conservation measures based on the given priority is a better solution.
Identification of conservation priority area using composite soil erosion index
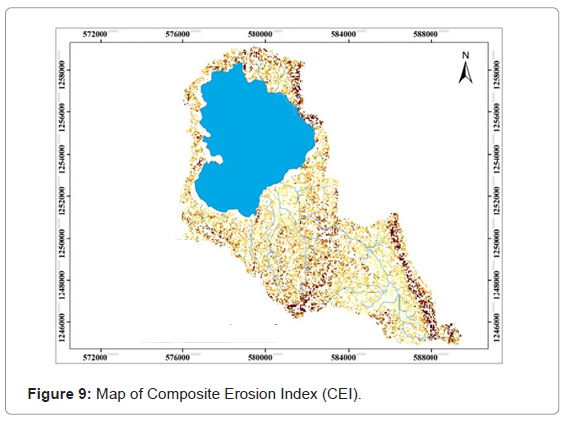
Multi-criteria evaluation was determined by composite erosion index which indicated the intensity of soil loss in the catchments. High erosion index and low erosion index indicated the maximum and minimum soil erosion intensity within the catchment respectively.
The final prioritize map area obtained from composite erosion map were derived by weighted overlay of soil data, slop data, land use/land cover and gully erosion sites. Based on the result of Composite Erosion Index (CEI) map the study area classified as non to slight erosion observed at index of (1.85-3.283), erosion index (3.3-4.1), moderately erosion index (4.1-4.7), high erosion index (4.7-5.4) and very high erosion index (5.4-7.5) (Figure 9).
composite soil erosion map of this study area is helpful in identifications of prone areas to soil erosion. This shows the spatial distribution of different erosion classes in the study area. Severe soil loss occurred with increased slope gradient in agricultural land and bare land. As the result of final composite erosion map of study area, 39.4% (1860.1 ha) of the catchment area non to slightly to low soil loss, 34.4% (1987 ha) of the catchment under moderately soil loss and 26.2% (1514.9 ha) of the catchment estimated high to very high soil loss (Table 4).
Discussion
Present study was conducted with the aim of estimating the rate of soil loss and identifies potential soil and water conservation measures
to be introduced in the area. Revised Universal Soil Loss Equation
(RUSLE) with an integration of geo-spatial technologies applied to
address the stated objectives. The result indicated that the estimated soil
loss rate varies over a wide range with zero which is the lowest value and
less than the minimum tolerable soil loss, 2 metric t ha-1 yr-1. Whereas
the maximum annual soil loss was estimated 76 t ha-1 y-1 which is far
from the maximum tolerable soil loss (18 t ha-1 y-1). The average annual
soil loss rate was found, 22.8 t ha-1 y-1 that exceeds the range of soil loss
tolerance for the Ethiopia and even for the Africa, too. However, since
the soil loss rate varies across a wide range of agro-ecology, the area’s
soil erosion vulnerability hazard was classified into low, medium, high,
very high and severe based on the soil loss per area per hectare per
year. It can be generalized that the very severe soil loss was observed in
the very steep slope upper part of the watershed at a rate that exceeds
the tolerable soil loss limit. In contrast, the tolerable soil loss rate was
found in most part of the lower and middle parts of the watershed. This
is due to gentle slope and the presence of erosion resistant soil type
(clay loam). Out of the total area, 39.4% (1860.1 ha.) of the catchment
area lies from non to slightly soil loss; 34.4% (1987 ha) is found under soil loss and identifies potential soil and water conservation measures
to be introduced in the area. Revised Universal Soil Loss Equation
(RUSLE) with an integration of geo-spatial technologies applied to
address the stated objectives. The result indicated that the estimated soil
loss rate varies over a wide range with zero which is the lowest value and
less than the minimum tolerable soil loss, 2 metric t ha-1 yr-1. Whereas
the maximum annual soil loss was estimated 76 t ha-1 y-1 which is far
from the maximum tolerable soil loss (18 t ha-1 y-1). The average annual
soil loss rate was found, 22.8 t ha-1 y-1 that exceeds the range of soil loss
tolerance for the Ethiopia and even for the Africa, too. However, since
the soil loss rate varies across a wide range of agro-ecology, the area’s
soil erosion vulnerability hazard was classified into low, medium, high,
very high and severe based on the soil loss per area per hectare per
year. It can be generalized that the very severe soil loss was observed in
the very steep slope upper part of the watershed at a rate that exceeds
the tolerable soil loss limit. In contrast, the tolerable soil loss rate was
found in most part of the lower and middle parts of the watershed. This
is due to gentle slope and the presence of erosion resistant soil type
(clay loam). Out of the total area, 39.4% (1860.1 ha.) of the catchment
area lies from non to slightly soil loss; 34.4% (1987 ha) is found under
Table 4: Prioritizing erosion risk based on soil erosion index for SWC intervention. The final soil loss risk map of the area which was derived from
multi-criteria evaluation and total soil loss derived from RUSLE model
and can be used for decision makers and supporting systems of soil
resource management, land use planners to implement sustainable land
management. Soil and water conservation practices and stream bank
protections are important to save and reduce the rate of deposition
of sediments in low lying area of study catchment. To conclude, this
study shows the importance of geo-spatial technologies together with
RUSLE model in estimating soil loss which can be used as a panacea
for decision making such as for water resource infrastructure planning
and establishment. But, such scientific studies demanded more
comprehensive, reliable and accurate input data for better outcome and
decision making.
ID
CEI
Severity class
Area (ha)
Area coverage in %
Priority for SWC interventions
1
1.85-3.283
Non to slight
1860.1
32.2
V
2
3.284-4.098
Low
416
7.2
IV
3
4.099-4.738
Moderate
1987
34.4
III
4
4.739-5.399
high
1018
17.6
II
5
5.4-7.471
Very high
496.9
8.6
I
Conclusion
References
Citation: Nigusse AGM, Alemu B (2022) Integration of Geo-spatial and RUSLE Techniques for Soil Loss Estimation and to Identify Potential Soil and Water Conservation Measures in the Northern Ethiopia. J Earth Sci Clim Change 13: 638. DOI: 10.4172/2157-7617.1000669
Copyright: © 2022 Nigusse AGM, et al. This is an open-access article distributed under the terms of the Creative Commons Attribution License, which permits unrestricted use, distribution and reproduction in any medium, provided the original author and source are credited.
Select your language of interest to view the total content in your interested language
Share This Article
Recommended Journals
Open Access Journals
Article Tools
Article Usage
- Total views: 1903
- [From(publication date): 0-2023 - Oct 21, 2025]
- Breakdown by view type
- HTML page views: 1457
- PDF downloads: 446

