Integration of Earn Value Management into BIM Projects
Received: 11-Dec-2018 / Accepted Date: 28-Dec-2018 / Published Date: 04-Jan-2019 DOI: 10.4172/2168-9717.1000221
Abstract
This study presents a tool which aims to support construction managers, particularly by combining BIM technology and the Earned Value Management (EVM) technique to allow the visualization of cost and time performance of construction works at a given time in a 3D BIM model. The following research will expose concepts and tools of integrating Building Information Modeling (BIM) system tools in construction projects; the proposed will be tested in a real-case project and all the different software tools that can be used for modeling and customize project information workflow. The research will demonstrate how to develop an Earned Value Management (EVM) technique based on the information from Autodesk Revit models; the research will explain how to extract data from the project and analyze all the earn value variables.
Keywords: Construction management; Integration; Visual programing; Data analysis
Introduction
Technology is transforming the way that buildings and infrastructure are designed, constructed and operated. It’s helping to improve decision-making and performance across the building and infrastructure’s lifecycle. Technology is slowly breaking through construction management practices and new contractual methods are emerging [1]. The objective of this study is to create an EVM/BIM tool that allows the direct visualization of the cost and time performance of construction works in the BIM model created with Autodesk Revit. The research paper will demonstrate how to develop an Earned Value Management (EVM) technique based on the information from Autodesk Revit models; the research will explain how to extract data from Autodesk Revit to Microsoft Excel using Dynamo [2,3]. This data allows the user to obtain the cost and time performance of the project and of each element of the model. These elements are then colored according to a colors code system in which each color symbolizes a specific performance. The tool enables the manager to detect the sensitive areas of the construction works in the BIM model, and categorize them in terms of their level of importance [4,5].
Literature Review
Since the beginning of civil construction, two-dimensional (2D) drawings are commonly used for planning and design. Many different types of drawing can be used during the process of designing and constructing buildings. Construction drawings are used to describe a place or object, to communicate building or fabrication instructions, or also can be used to estimate quantities. With the advances of new technologies and innovation in the construction industry the process of planning and designing emerge to a three-dimensional (3D) building models and digital rendering. Utilizing 3D models is a cost-effective alternative to physical models. Many firms have taken advantage of this new technology to replace traditional methods of physical modeling. BIM is an intelligent 3D model-based process that gives architecture, engineering, and construction professionals the insight and tools to more efficiently plan, design, construct, and manage buildings and infrastructure. BIM is being increasingly present in the mind of construction practitioners [6,7]. BIM provides better visualization of the project, improved design coordination, enhanced team, reduced project costs and duration. BIM can also be seen as a virtual process that incorporates all building data in a unique model, which enables a more efficient and precise collaboration between all stakeholders, owner, contractors and architects. Any of them can adjust or refine the model in order to make it as thorough as possible before the start of the execution works [8]. Moreover, BIM does not only refer to a 3D intelligent model or modeling software. According to him, it is also a process that can deeply impact the project delivery processes or the workflow.
Earned Value Management is a management technique used in different areas such as Information Technology (IT) project or construction projects, which aims to monitor cost, schedule and technical performance of a project. One of its main uses is the forecast of project cost and time through the use of performance indices. It constitutes an early warning of performance problems when properly applied. It is based on the interpretation of three S-curves in a costtime graph. Each curve represents cumulative data of a specific parameter. The Project Management Institute (PMI) defines three input parameters:
• The Planned Value (PV): Based on the work plan, it is the planned cost of the project work, which I supposed to be done at any time in the schedule. The highest and last value of PV is the Budget at Completion (BAC) corresponding to the total budget baseline for the activity.
• The Actual Cost (AC): Represents how much resources have been used to reach the actual work performed. It requires having a system for tracking costs over time and by project component.
• The Earned Value (EV): Represents the amount of work accomplished to date or in a given period.
Visual programming and scripting has become an important tool for the design and construction areas. It constitutes an alternative to computer programming, which is usually required for designers to implement their sophisticated design intent in parametric BIM. It can replace the conventional elaborate coding with a visual metaphor of connecting small blocks of independent functionalities into a whole system or procedure [9]. Furthermore, a survey of 50 visual programming languages showed that a more visual style of programming could be easier to understand for non-programmers or novice programmers such as architects [10,11].
Methodology
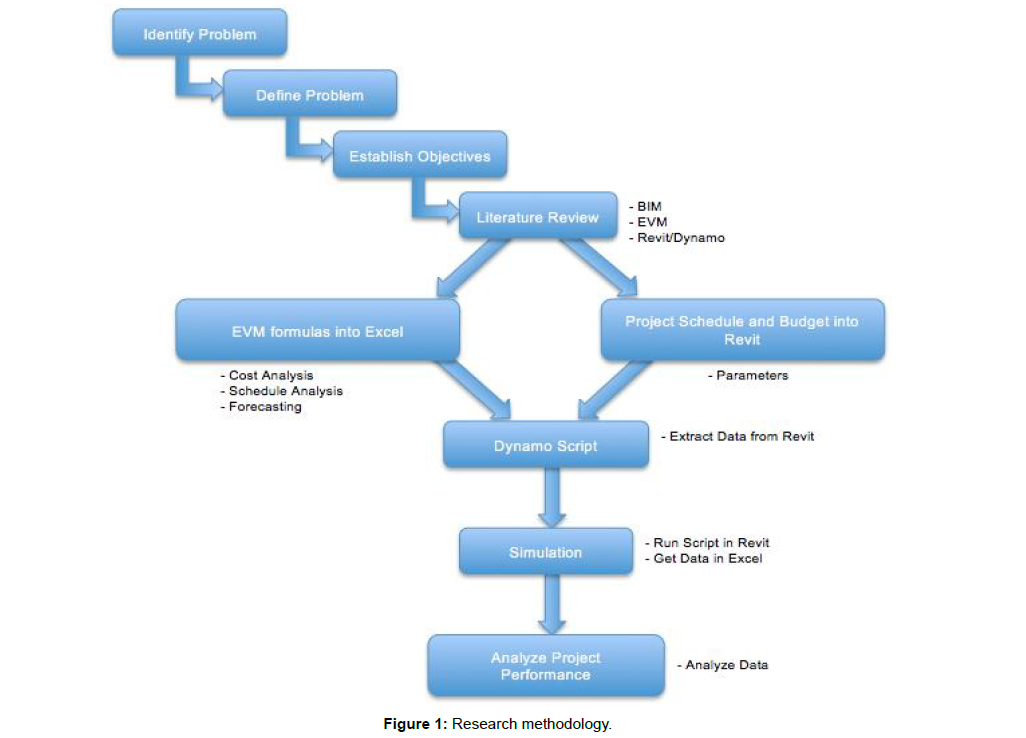
The research provides an analysis of the possibility and potential of combining BIM and EVM techniques in order to create a framework that can provide a support and guidelines for construction managers. To begin with the research the first step is to identify and define the problem in order to establish the objectives, purpose and goals. After constitute the goals, a literature review is conducted in order to get a full understanding about BIM and EVM theory and application in construction management, also a review about the concepts, implementation of the software and technology used. An Excel sheet is created with the costs, schedule and forecasting analysis formulas in order to develop an EVM work sheet. Project’s schedule and budget data is imported into Revit as a parameter for each different family type. Dynamo programming script is developed to create the connection between Revit and Excel sheet. The script has to be run and simulate in order to extract data from Revit and imported into the Excel sheet. Finally, with the EVM data in Excel, a project’s performance analysis is conducted. The analysis of the EVM will improve project management visibility and understanding of the cost and schedule performance in order to manage and control the project. Figure 1 shows the flow and steps of the research methodology.
Development and Results
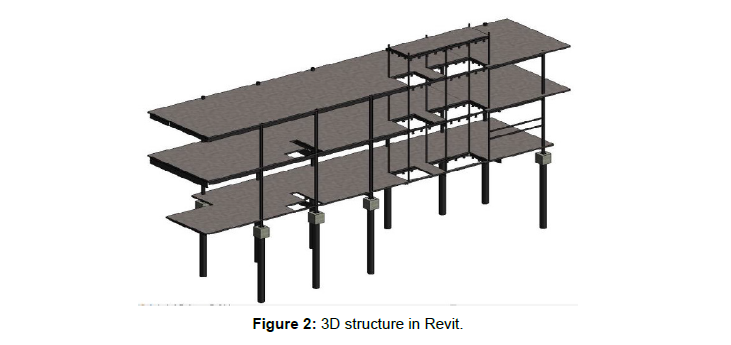
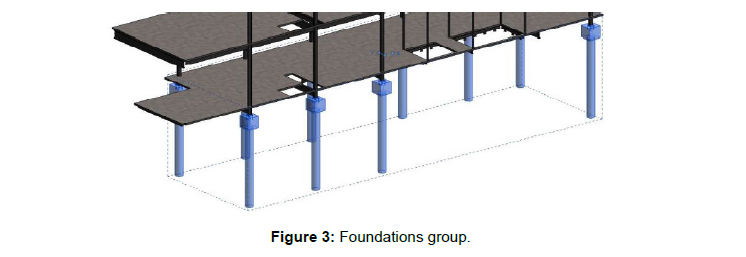
The integration of the tool requires extracting real data from Revit to Excel. In order to accomplish the objective, it is necessary to have a construction project modeled with activity’s cost and duration in Revit. This study presents a two-story structure with four project’s activities (Foundations, Columns, Framing and Slabs) as in Figures 2 and 3. All the elements in the model are assigned to an activity as an element group. The foundations are grouped together in order to assign them to the first activity.
After the creation of the groups by activities, it is necessary to develop instance properties for each group as in Figure 4. The properties are created as data parameters, every group have an Activity ID, Activity Name, Duration, Budget, %Complete, Earn Value, Actual Cost. The user must input data to the parameters following the information from the project’s schedule of value.
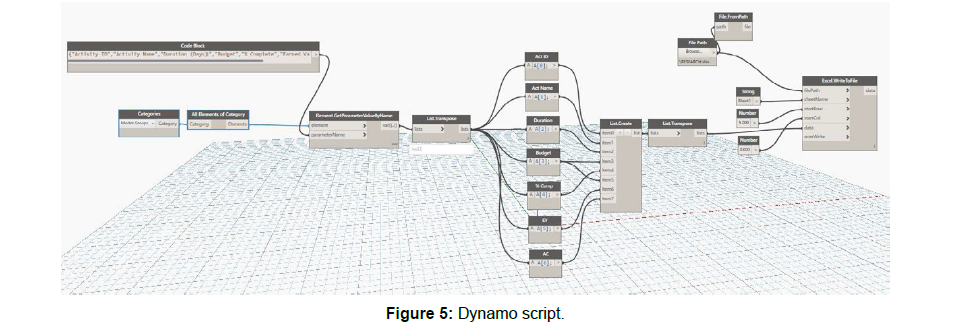
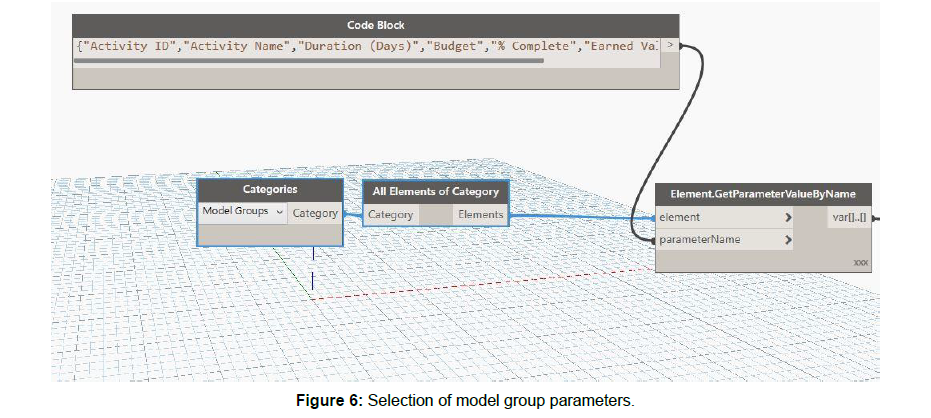
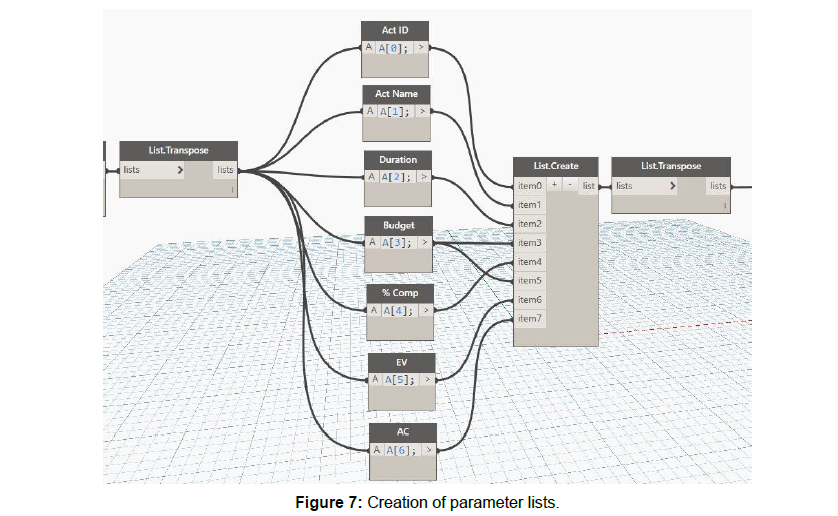
Next step is to create the Dynamo script in order to extract all the data from the groups (Figure 5). The script selects the data to be extract. The parameters are into the Model Group type, first step is to select Model Group with a category node, then extract all the parameters that will be necessary to develop the analysis as in Figure 6. Second step is to create the list of data as in Figure 7 and finally assigned an Excel file to write the data extracted as in Figure 8.
After running the script all the data is extracted and analyzed in Excel as in Table 1. In order to analyze the data and obtain a project performance, it is necessary to introduce the EVM Formulas which is given in Tables 2-4.
| I.D. | Activity | Duration | Budget | %Complete | PV | EV | AC | SV | SPI | CV | CPI | BAC | ETC | EAC | VAC | TCPI-BAC | TCPI-EAC |
|---|---|---|---|---|---|---|---|---|---|---|---|---|---|---|---|---|---|
| 1 | Foundations | 10 | 45000 | 100 | 45000 | 45000 | 50000 | 0 | 1 | -5000 | 0.9 | 45000 | 0 | 50000 | -5000 | 0 | #DIV/0! |
| 2 | Columns | 5 | 50000 | 100 | 50000 | 50000 | 48000 | 0 | 1 | 2000 | 1.041667 | 50000 | 0 | 48000 | 2000 | 0 | #DIV/0! |
| 3 | Framing | 5 | 40000 | 50 | 40000 | 20000 | 20000 | -20000 | 0.5 | 0 | 1 | 40000 | 20000 | 40000 | 0 | 1 | 1 |
| 4 | Slabs | 8 | 60000 | 0 | 60000 | 0 | 0 | -60000 | 0 | 0 | #DIV/0! | 60000 | #DIV/0! | #DIV/0! | #DIV/0! | 1 | #DIV/0! |
Table 1: Excel EVM data analysis.
| EVM formulas | |
|---|---|
| Schedule Variance (SV) | EV – PV |
| Schedule Performance Index (SPI) | EV/PV (>1 ahead, < 1 behind) |
| Cost Variance (CV) | EV- AC (+under, - over) |
| Cost Performance Index (CPI) | EV/AC (>1 under, < 1 over) |
| Estimate to Complete (ETC) | (BAC – EV)/CPI |
| Estimate at Completion (EAC) | AC +ETC |
| Variance at Completion (VAC) | BAC – EAC (+under, - over) |
| To Complete Performance Index (TCPI) | To achieve EAC: (BAC – EV)/(EAC – AC) |
| To achieve BAC: (BAC – EV)/(BAC – AC) | |
Table 2: EVM formulas.
| Performance Measure | Schedule | |||
|---|---|---|---|---|
| SV>0 & SPI>1.0 | SV=0 & SPI=1.0 | SV<0 & SPI<1.0 | ||
| Cost | CV>0 & CPI>1.0 | Ahead of schedule under budget | On schedule under budget | Behind schedule under budget |
| CV=0 & CPI=1.0 | Ahead of schedule on budget | On schedule on budget | Behind schedule on budget | |
| CV<0 & CPI<1.0 | Ahead of schedule over budget | On schedule over budget | Behind schedule over budget | |
Table 3: Performance measures for data analysis (PMBOK Guide).
| Project Management Question | EVM Performance Measures |
|---|---|
| How are we doing timewise? | Schedule Analysis & Forecasting |
| Are we ahead or behind schedule? | Schedule Variance (SV) |
| How efficiently are we using time? | Schedule Performance Index (SPI) |
| How are we doing cost-wise? | Cost Analysis & Forecasting |
| Are we under or over our Budget? | Cost Variance (CV) |
| How efficiently are we using our resources? | Cost Performance Index (CPI) |
| How efficiently must we use our remaining resources? | To-Complete Performance Index (TCPI) |
| What is the project likely to cost? | Estimate at Completion (EAC) |
| Will we be under or over Budget? | Variance at Completion (VAC) |
| What will the remaining work cost? | Estimate to Complete (ETC) |
Table 4: Analysis management questions (PMBOK Guide).
Conclusion
This study aimed to provide support and guidelines to the construction managers in order to control and manage the schedule and the budget for construction projects. The final tool presented is an integration and analysis of Revit data with EVM. The integration is done by a Dynamo script, which performs the interoperability between the two soft wares platforms.
The EVM gives an accurate estimation of the actual and future cost and time performance, which are two of the most important criteria to evaluate the success of a project. This BIM tool can be very useful to help managers to analyze project’s performance and be more proactive in making prompt decisions and timely adjustments. This in turn could result in the avoidance of major delays and budget overspendings.
Furthermore, by integrate Revit with EVM; construction managers have a better visualization of the project. The managers are able to introduce data directly to the model and analyze it in Excel. The study has demonstrated that the combination of Revit and EVM concepts is complementary and worthwhile. The paper has proved the potential of BIM technology, a potential that is emphasized by the use of visual programming that enlarges its capabilities. It has also showed that BIM can be a valuable visualization support instrument. It can be concluded that this tool fulfills the scope and objectives of the study.
References
- Gal U, Lyytinen K, Yoo Y (2008) The Dynamics of IT Boundary Objects, Information Infrastructures, and Organisational Identities: The Introduction of 3D Modeling Technologies into the Architecture, Engineering, and Construction Industry. European Journal of Information Systems 3: 290-304.
- Haron AT, Marshall Ponting AJ, Aouad GF (2009) Building information modelling: Literature review on model to determine the level of uptake by the organization. University of Salford.
- Jardim-Goncalves R, Grilo A (2010a) SOA4BIM: Putting the Building and Construction Industry in the Single European Information Space. Automation in Construction 4: 388-397
- Peterson F, Hartmann T, Fruchter F, Fischer M (2011) Teaching Construction Project Management with BIM Support: Experience and Lessons Learned. Automation in Construction 2: 115-125
- Project Management Institute. (ed) (2013) a Guide to the Project Management Body of Knowledge (PMBOK Guide). Fifth edition. Newtown Square: Project Management Institute.
- SOUSA VF, ALMEIDA NA (2015) Construction Planning. [Lecture] Construction Planning and Economics. Department of Civil Engineering, Instituto Superior Técnico, Lisbon.
- Tauscher E, Mikulakova E, Beucke K, König M (2009) Automated generation of construction schedules based on the IFC object model. Computing in Civil Engineering 666-675.
- Carmona J, Irwin K (2007) 'BIM: Who, What, How and Why', Building Operating Management.
- Boeykens S, Neuckermans H (2009) Visual Programming In Architecture: Should Architects Be Trained As Programmers?
- Dossick CS, Neff G (2010) Organizational Divisions in BIM-Enabled Commercial Construction. Journal of Construction Engineering and Management, ASCE 4: 459-467
- Owen R, Amor R, Palmer M, Dickinson J, Tatum CB, et al. (2010) Challenges for Integrated Design and Delivery Solutions. Architectural Engineering & Design Management S1: 232-240
Citation: Bejarano E (2019) Integration of Earn Value Management into BIM Projects. J Archit Eng Tech 7: 221. DOI: 10.4172/2168-9717.1000221
Copyright: © 2019 Bejarano E. This is an open-access article distributed under the terms of the Creative Commons Attribution License, which permits unrestricted use, distribution, and reproduction in any medium, provided the original author and source are credited.
Share This Article
Recommended Journals
Open Access Journals
Article Tools
Article Usage
- Total views: 6630
- [From(publication date): 0-2018 - Apr 21, 2025]
- Breakdown by view type
- HTML page views: 5615
- PDF downloads: 1015

