Research Article Open Access
Integrating Spatial and Aspatial Factors in Measuring Accessibility to Primary Health Care Physicians: A Case Study of Aboriginal Population in Sudbury, Canada
Lu Wang* and Travis Tormala
Department of Geography, Ryerson University, Toronto, Canada
- Corresponding Author:
- Lu Wang
Department of Geography
Ryerson University
350 Victoria Street, Toronto
Ontario, M5B 2K3, Canada
Tel: 416-979-50002689
Fax: 416-979-5362
E-mail: luwang@ryerson.ca
Received Date: January 23, 2014; Accepted Date: April 28, 2014; Published Date: April 30, 2014
Citation: Wang L, Tormala T (2014) Integrating Spatial and Aspatial Factors in Measuring Accessibility to Primary Health Care Physicians: A Case Study of Aboriginal Population in Sudbury, Canada. J Community Med Health Educ 4:284. doi: 10.4172/2161-0711.1000284
Copyright: © 2014 Wang L, et al. This is an open-access article distributed under the terms of the Creative Commons Attribution License, which permits unrestricted use, distribution, and reproduction in any medium, provided the original author and source are credited.
Visit for more related articles at Journal of Community Medicine & Health Education
Abstract
Heath care accessibility can be determined in both a spatial and aspatial context. While spatial access is the geographic restraints limiting one’s ability to access care, apatial access refers to the non-geographic constraints affecting access to care, typically measured by socio-economic factors. The paper presents a methodological framework to combine spatial and aspatial factors to assess the accessibility to primary care physicians. Attention is focused on the aboriginal population within an isolated city, Sudbury, in northern Ontario, Canada. A range of datasets were analyzed including the 2008 Canadian Medical Directory, 2006 census and 2008 DMTI road network data. Spatial accessibility of the aboriginal population to family physicians was measured using the enhanced two-step floating catchment area model that accounts for varying travel time thresholds associated with different travel time zones. The z-score-based aspatial scores were calculated at a DA level to reveal the highest and lowest concentrations of the aboriginal population in the study area. Combining the spatial and aspatial scores allows for problem census DAs to be determined where there are both low spatial scores and a high concentration of the aboriginal population. The methodology developed in this paper is flexible with the ability to be altered to fit different studies in different geographic regions. It provides results that are easy to interpret by health policy makers.
Keywords
Accessibility; Enhanced two-step floating catchment area method; Aboriginal population; Sudbury; Ontario
Background
Geographic access plays an important role in health care utilization as neither health services nor population are distributed in space evenly. According to Nugent, ‘‘in health care, geography is destiny’’ and locally available healthcare is critical in improving population health. In a more general sense, accessibility to healthcare practitioners and facilities could typically affected by both spatial and non-spatial factors. A universal health system implies the equal provision of healthcare to all subsets of the population regardless of status and location. For Canada universal coverage extends to accessibility, which is one of the five criteria and conditions in the Canada Health Act that provincial and territorial health insurance plans must meet. The Canada Health Act, however, does not provide a clear definition of what constitutes “reasonable access” and this results in various responses by the provinces in improving economic access based on financial charges and physician access based on service location [1]. In Canada, the maldistribution of physicians and hospitals results in underserved areas and hospital catchments of extreme sizes [2-4]. The geographic literature on health suggests that accessibility can be determined in both a spatial and aspatial context [5-8]. Spatial access refers to the relative ease with which individuals from one location can reach other specified zones or point locations and is often measured based on travel time or distance [5,9,10]. On the other hand non-spatial (or apatial) access is affected by geographic constraints that limit one’s ability to access care and are typically measured by socio-economic factors [11]. This paper examines the accessibility of a disadvantaged group–the original population in Sudbury Canada–in order to better understand the ability of the population to access primary care physicians or family physicians within an isolated small city.
Within Canada’s healthcare system the importance of primary care physicians or family physicians cannot be overstated as they are integral in the health of Canadian citizens [12]. A family physician acts as a filter within the Canadian healthcare system and patients need to be referred by their family physicians to different types of specialists. The literature on access to health care services has often focused on large geographical areas such as nations, provinces and large metropolitan areas, for example, health care access in rural Canada and the Canadian province of Nova Scotia [13-15], health care disparities in rural U.S. and urban and rural differences in access to care in the U.S. [16]. Also, the work on measuring accessibility to physicians is largely situated in large cities such as Chicago, Toronto, and Washington D C [8,17,18]. Very little in-depth investigation has been conducted on single, small and isolated non-metropolitan areas. However, the issue on health care access needs not be associated with a large study area to be critical and a social phenomenon needs not be associated with a large population to be important. By situating the study in a relatively remote and small Canadian city that has a sizable aboriginal population, the paper sheds light on whether the physician distribution in the area provides equitable access to disadvantaged social groups and whether the fundamental principle on accessibility in the Canada Health Act are being followed in small Canadian cities that have fewer primary care physicians proportionally than major metropolitan areas [13].
A number of methods have been developed to quantify spatial accessibility. One of the simplest is through a cumulative measure that counts the opportunities within a given buffer area [19].The widelyused gravity-type accessibility models conceptualize accessibility as a trade-off between destination attractiveness and spatial separation that is usually measured by travel time or travel distance [5,11,20-24] The traditional gravity-type accessibility measures focus on the supply side and largely overlook competition among users (e.g., patients) in determining trip distribution. The refined gravity-type accessibility measures, of which a special type is the so-called two-step floating catchment area (2SFCA) measure, include demand competition to the existing models [8,18,25]. The 2SFCA model has been used in a number of studies measuring health care accessibility [18,26-29]. It compares supply and demand in an intuitive sense by assuming a uniform catchment size and undifferentiated accessibility within a catchment [30]. Compared to the refined gravity-type accessibility measure, the 2SFCA model is simple to be understood by policy makers and is relatively easy to be implemented in geographic information system (GIS); it does not contain a distance impedance function which requires the calibration of parameters and makes the computation more complicated. Recent studies have developed various improvements to the 2SFCA method to account for variations in travel behaviour that cannot be fully modelled by a uniform travel threshold using a simplistic two step approach [31]. For example, Luo and Qi [32] use weights created from a distance friction coefficient applied to predetermined thresholds. In other studies, different transportation modes, transit timetables and bus stop locations, and various travel time thresholds associated with different travel time zones are considered in the enhanced 2SFCA models [33,34].
As discussed previously, not only geographic accessibility, nonspatial factors can affect health and health status in different ways. Previous studies on population health inequalities suggest a close relationship among socioeconomic status, health outcomes and health care utilization, with lower socioeconomic status more likely to be associated with poor health and underutilization of health services [35]. In Canada, the disparity in health is particularly evident between population enjoying a higher socioeconomic status and disadvantaged population including the aboriginal and ethnic minorities [36]. Using primarily a social-determinants-of-health framework, research reveals persistent health inequalities between the aboriginal population in Canada and non-aboriginal population in self-reported health status, functional and chronic conditions and children’s health [36-38]. Aboriginal people especially those in remote geographic regions have limited access to healthcare services and healthy foods due to local availability of healthcare facilities, climate condition and the structured built environment [39,40]. Under the population health framework, not only commonly used socio-economic factors that impact health and healthcare use, language and cultural differences between a physician and a patient can also cause significant healthcare barriers that may lead to misunderstanding of symptoms and instructors[41,42]. Aspatial and spatial factors have often been studied separately in healthcare access. Among the limited literature that attempts to examine both types of factors simultaneously, Luo and Wang [8] created an integrated approach that combines both aspatial and spatial access in order to calculate spatial accessibility and identify health professional shortage areas. Within the study a list of variables for aspatial factors that affect health care access are created and factor analysis is used to group these variables.
The paper examines the accessibility to family physicians for a specific social group–the aboriginal population of the Sudbury Census Metropolitan Area (CMA) (see Figure 1). Located about 400 kilometers northwest of Toronto, Ontario, Sudbury is Canada’s 24th largest CMAs with a population of 158,258. A portion of the city has been set aside for current and future operations within the mining industry and is labeled as industrial. A minority population can be seen with close to 10,000 people (6.3%) identifying themselves as aboriginal. The two aboriginal reservations identify as part of the Anishinaabe peoples. The language spoken by this group is Anishinaabemowin. None of the family physicians in Sudbury reported speaking Anishinaabemowin or any other aboriginal languages. According to the 2006 Census, despite a similar education level between the aboriginal and non-aboriginal population in Sudbury, the aboriginal population had higher rates of unemployment, 10% lower income than non-aboriginals, and one in four of them lived below the poverty line (Statistics Canada, 2010) [43]. In Ontario the primary care given to aboriginal population has been shown to be inadequate making the population disadvantaged within the health care system [44]. In this context, the paper aims to:

Figure 1: The study area–Sudbury Census Metropolitan Area, Ontario, Canada.
1. model spatial accessibility that reveals the ability for the general population in Sudbury to access primary care family physicians at the dissemination area (DA) level;
2. analyze the settlement (residential) pattern of aboriginal population in Sudbury and reveal areas of concentrations of aboriginals;
3. identify areas with poor spatial accessibility to family physician for the aboriginal population and combine spatial access scores and population data to highlight problem areas that have low spatial scores and high concentration of aboriginal populations.
The study makes the following contributions:
1. It provides a model to study the accessibility to health care services of one social group instead of the entire population.
2. It is set in a CMA and highlights issues that arise when working with a relatively isolated non-metropolitan area, while previous studies on healthcare access tend to focus on large cities or states/provinces.
3. It uses the enhanced two-step floating catchment area model by Luo and Qi [32] that accounts for distance decay (i.e., various travel zones) and represents a more realistic approach to modelling actual travel behavior than the original 2SFCA model.
Data
The physician data used within the study came from the 2008 Canadian Medical Directory. Each family physician is given as point data and their office address is geocoded to using a six digit postal code. This means the point data is not the exact address, and more than one family physician can fall inside the same postal code. Postal codes can be especially problematic in more rural areas where the area covered by a postal code can be quite large, and the approximate location given by the centroid can fall farther away from a physician’s office. In the data, languages spoken by a physician was self-reported. There are 131 family physicians within the Sudbury CMA and none self-reported speaking any aboriginal languages.
Road network data was extracted from the 2008 DMTI dataset. The data allows for computing travel times within a catchment area as opposed to distance. The road network gives the speed for each road, which allows for the travel time to be computed. One limit is that the dataset only gives the max speed, which is not always the case at certain times of day. Thus, any travel times created using the dataset gives the optimal time assuming that the driver follows the speed limits and does not incur any traffic congestion. The travel times are computed through the ArcMap Network Analyst tool.
The population data was provided by the 2006 Canadian Census. The variable used was the population identifying as Aboriginal at a DA level. DAs are the smallest geographic boundary available in Canadian census. In the literature census tracts are often used, but with only 43 census tracts within the Sudbury CMA spatial variability would be harder to determine. There are 267 DAs within the Sudbury CMA; six were given a null value. Two of the DAs have no population due to industrial usage, and the other four have suppressed aboriginal population values, a common approach in Census to ensure confidentiality [45-47].
Modeling Spatial Accessibility Using Enhanced-2sfca (E2sfca) Model
The E2SFCA measure was chosen over other gravity-type accessibility measures. Despite the similarities with the original 2SFCA measure, the E2SFCA measure is able to take into consideration distance decay within a catchment size, and also retains the advantages of the 2SFCA measure. Within the conventional 2SFCA model, opportunities located within the threshold are treated equally accessible and are given a score of one. The E2SFCA measure instead creates travel thresholds that are given different weights. In both models opportunities outside of the max travel threshold are considered inaccessible and are given a score of zero. The E2SFCA uses an impedance function to create weights for opportunities within the catchment area. While distance decay has been accounted for within the E2SFCA measure there are still other limitations. The travel time zones created for the E2SFCA measure are each weighted differently and this can lead to a substantial difference for a centroid that falls on the edge of the time zones. For example if a centroid falls at 9 minutes away from the physician location it could be weighted as 1, and if a centroid falls at 11 minutes it could be weighted as 0.68. Also, travel zones used within the E2SFCA measure can alter the results depending on how fine the travel zones are. For example travel zones for every 10 minutes could provide different results than travel zones for every 5 minutes [48].
Due to the lack of empirical data on the travel pattern of aboriginal population in accessing family physicians, we use the same travel time divisions from the study by Luo and Qi [32] where the E2SFCA model was developed and tested. Thresholds or travel zones from 0 to 10 minutes, 10 to 20 minutes and 20 to 30 minutes are given different weighting schemes in order to create a modified accessibility score. Ten minute intervals work well for the Sudbury study area. Since much of the study area is rural, people are willing to travel longer to visit a physician. It is possible for a highly urbanized area that five minute thresholds could be more appropriate, and the travel thresholds can be changed to be more appropriate for a given study area.
The data was prepared in a specific manner in order to properly run the E2SFCA measure. For the population data centroids were created. A threshold of 30 minutes is then created around the population centroid. Three different thresholds (0 to 10 minutes, 10 to 20 minutes and 20 to 30 minutes) were then created around each physician point.
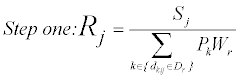
The first step of implementing the E2SFCA model within ArcMap is the creation of the physician to population ratio for each physician (equation 1).Three separate zones are created; 0 to 10 (D1), 10 to 20 (D2), and 20 to 30 minutes (D3). For each physician location (j), all population locations (k) that fall within the specific threshold zone (Dr) are counted. A weight is also assigned to each population (Wr). This creates a weighted physician to population ratio (Rj). The population locations (k) are the populations that fall within a particular threshold ( dkj ∈ Dr ) for a physician’s location (j). Sj is the number physicians at a particular location (j).
 (1)
(1)
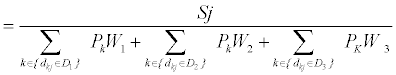
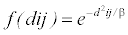
Pk represents the populations that fall within a particular threshold ( dkj ∈ Dr ) for a physician location (j). Sj is the number physicians at location (j). Rj is the physician-to-population ratio at physician location j. By giving the populations that fall within each travel time threshold a weight (W1, W2, W3) distance decay function can be factored into the accessibility to a physician’s location (j). The weights used within the paper were created using the Gaussian function (equation 2) that has been used in a number of studies on healthcare access [8,18]. The weights chosen for the E2SFCA measure are 1 for 0-10 minutes, 0.68 for 10-20 minutes, and 0.22 for 20-30 minutes, adopted from Luo and Qi [31]. Each weight is for the first time within each threshold. This is why the first threshold has a value of one, since it corresponds to a time of zero minute from the physician location. It is important to note that for different study areas another set of weights could be considered more appropriate.
 (2)
(2)
Thirty minutes is used as the cut-off point for β, and in order to account for a more gradual distance decay a critical value of 0.03 is used. The weights are calculated for the first time within a drive time threshold. For the 0-10 minute threshold zero minutes is used as the weight for the entire threshold, which is why a weight of one is used. This was repeated for the other two drive time thresholds. The Gaussian function has a steep decline close to the trip origin [18], but within the E2SFCA measure the first weight is not taken until 10 minutes from the trip origin.
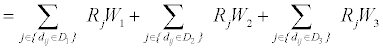
The second step in implementing the E2SFCA measure is adding the three weighted physician to population ratios that were created for each of the three travel time zones (equation 3).
 (3)
(3)
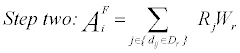
All of the physician locations (j) within the 30 minute travel time threshold are calculated within each population location (i). The population locations (i) have the three thresholds created; 0 to 10 (D1), 10 to 20 (D2), and 20 to 30 minutes (D3). The physician to population ratio’s (Rj) calculated within the first step are summed up for each separate travel time zone and added together for the physician locations (j) that fall within the population location threshold (dij ∈Dr ). The same weights (Wr) used in step one are again applied in step two in order to account for distance decay.AiF is the accessibility score calculated for each population location (i).
The calculated accessibility scores for the Sudbury CMA using the E2SFCA method are shown in Figure 2. Figure 3 shows the standardized z-scores of the accessibility scores shown in Figure 2 using a 30 minute drive time max threshold and 10 minute intervals. The scores ranged from 0 to 0.0011 family physicians per person, and by using z-scores one can see how the highest and lowest scores are distributed within the CMA. Values of the edge tracts (DAs at the edge of the study area) must be interpreted with caution, since physicians and populations outside the study area are not considered in the modelling exercise. The spatial scores from the E2SFCA measure have higher accessibility scores in the city of Sudbury, which is the urbanized core of the CMA. The lower scores fall out towards the more rural parts of the CMA. Rural communities closer to the city of Sudbury maintain higher scores than communities farther from the urbanized core.

Figure 2: Calculated spatial accessibility to family physicians using E2SFCA measure.

Figure 3: E2SFCA Standardized Z-scores.
Measuring Aspatial Distribution
As discussed earlier, aboriginal population in Canada are associated with a lower level of income, and higher rates of both unemployment and poverty compared to the general population. They also show lower health status and are found to experience significant barriers in accessing needed health care [36,39,44]. The population is thus considered to be aspatially disadvantaged in this study. By mapping the distribution of the aboriginal population at a DA level, concentrations of aboriginal peoples in the Sudbury CMA can be identified in relation to accessibility scores to family physicians.
Percentage of aboriginal population in DA was used in mapping and standardized z-scores were created to allow the highest and lowest concentrations of the aboriginal population to be more easily viewed. Z-scores were used to create travel thresholds for factor scores [8]. In the study where data on the socioeconomic status of the aboriginal population in the study area is unavailable, z-scores were used to create a threshold for high concentrations of the aboriginal population. There are two first nation reservations located within the Sudbury CMA: The Whitefish Lake Reservation, and the Wanapitei Reservation. Both have close to 90% of the population identifying themselves as aboriginal peoples and the combined aboriginal population is approximately 400 people. When the z-scores were created the two reservation values were not included since they skewed the z-score distribution. However, the first nation reservations remained within the study and were added in after the standardized z-scores were created.
Figure 4 reveals the spatial distribution of the aboriginal population within the Sudbury CMA using z-scores. There are in total 37 DAs that fall above 1 standard deviation, and the total goes up to 39 with the two First Nation reservations being included. One positive standard deviation is for a DA with an aboriginal population over 11.5% and these 39 DAs hold close to 40% of the aboriginal population within the Sudbury CMA .The highest concentration of the aboriginal populations lies both in the city of Sudbury as well as the rural areas outside. There are 24 DAs with high concentrations of aboriginal peoples within the city of Sudbury and 15 located outside the urban core. One issue is that four of the rural DAs over 1 standard deviation would be considered edge tracts, which includes both First Nation reservations. The results for these edge tracts must be interpreted with caution. Including the surrounding rural populations in the study would prove difficult, since the population is sparse surrounding the Sudbury CMA and DAs do not exist in rural areas. A different level of geography (census subdivisions) could complicate the results.

Figure 4: Standardized Z-scores for Aboriginal Population in Sudbury CMA.
Combining Spatial and Aspatial Scores
Examining the distribution of spatial accessibility scores in relation to the settlement pattern of aboriginal people in the study area allows for problem DAs to be determined where there are both low spatial scores and a high concentration of the aboriginal population. As previously stated high aboriginal scores were set at one positive standard deviation, that is, 11.5% of the population being aboriginal.
The low spatial scores must also be determined. Within Luo and Wang’s [8] study, a cut-off point using the HPSA criteria (one family physician per 3,500 people) was used to determine Health Professional Shortage Areas HPSA in Chicago Metropolitan Area. However, there are no designations to follow to determine a critical physicianto- population ratio for Sudbury, Canada. As a result, standardized z-scores were created based on calculated accessibility scores. The cutoff point for one negative standard deviation is an accessibility score of 5.1 physicians per 10,000 people (approximately 1 physician per 2,000 people). It is important to note that high and low scores created based on the cut-off point are only relevant to the specific study area. What is considered to be low accessibility in Sudbury could change for other regions. If specific criteria were made for healthcare designations within Canada they could be easily implemented in the model used in the paper.
The total aboriginal population that fell in low spatial accessibility areas was calculated. All DAs that had spatial accessibility scores less than one family physician per 2,000 people had their total aboriginal identity population combined. The percent of the aboriginal population living in DAs associated with low spatial accessibility is 27% (approximately 2,500 aboriginal individuals).
Figure 5 reveals the results of combining the spatial and aboriginal map. The results show the areas of major concern (low spatial score and high aboriginal concentration) fall in the rural areas and the two first nation reservations. The majority of the DAs with a relatively high aboriginal population have high spatial scores. In total 9 DAs are given this designation. The percent of the aboriginal population with low spatial scores that are captured by the high concentrated areas is 41% (approximately 1,000 aboriginal individuals captured in the 9 DAs). The results show that the two first nation reservations, which have the highest percentage of aboriginals, have poor spatial access to family physicians. Figure 5 also shows the areas with either low spatial access or a high percentage of aboriginal population. The urban areas with high aboriginal population are also mapped. While these areas are shown to have adequate spatial access as compared to the Sudbury CMA the aspatial disadvantages associated with socioeconomic status, as discussed earlier, can lead to low use of health services.

Figure 5: Combination of Spatial and Aspatial Scores.
The approach of combining the spatial and aspatial scores is able to highlight low spatial accessibility areas and high concentrations of a predetermined population with aspatial disadvantages. Also, the methodology allows for case by case analysis, or if specific thresholds for the population and the spatial accessibility are created they can be integrated into the approach. Overall it is useful for instances when studying the accessibility of a specific group rather than an entire population.
Summary and Discussions
In summary, the paper provides a methodology to examine the spatial accessibility for an aspatially disadvantaged population. The Sudbury CMA’s aboriginal population is used as a case study. Datasets analyzed include the 2006 Canadian Census data as well as family physician location data from the 2008 Canadian Medical Directory. The enhanced two step floating catchment area (E2SFCA) model is employed and implemented in GIS in order to calculate the spatial accessibility scores for the study area. Standardized z-scores are created to better understand the distribution of the aboriginal population in the study, and to identify areas with the high/low concentration. A threshold to determine low spatial accessibility and high concentrations is created using standardized z-scores. First, the percent of the disadvantage population that falls in areas with low spatial accessibility scores is calculated. This way the spatial accessibility for all of the disadvantaged population can be seen instead of only where the highest percent live. Second, the percent of disadvantage population that falls in areas with low spatial accessibility captured by the DAs deemed to have high concentrations is created. Third, the scores are combined in order to determine the areas with both high concentrations of the population and low aspatial accessibility scores.
For the Sudbury case study the paper revealed some interesting results. Spatial accessibility to family physicians is the highest within the city of Sudbury and then decreases in the more rural areas. There is a high percentage of aboriginal population that have low spatial accessibility to family physicians (one in four falling in DAs with less than one family physician per 2,000 people), and they are fairly dispersed throughout the rural parts of the CMA. Of the aboriginal population with low spatial scores approximately 40% can be captured within 9 DAs. These could be areas of interest for policy makers. However, the 9 DAs are spread apart in the outskirts of the Sudbury CMA. The dispersion makes it difficult to reach the rural aboriginal population with poor spatial access to family physicians. A practical implication would be to encourage physicians to open a secondary practice location in the rural area and develop alternative strategies, such as using mobile clinics, to provide health services to rural aboriginals living in the 9 DAs. Recognizing the challenges of opening a health clinic in rural Sudbury, we suggest that tele-health may be a temporary and practical solution to the low accessibility experienced by this group. Currently, the Telehealth Ontario program, provided by the Ministry of Health and Long-Term Care in Ontario, provides free consultation with a Registered Nurse over the phone on symptoms described. The Registered Nurse assesses the patient and can either advise self-care or recommend a visit to a health practitioner. Special effort could be made to minimize the wait time for callers from rural Sudbury (or other rural areas) in order to address their health concerns in a timely fashion.
This paper has several limitations. One limitation is associated with the use of DA as the unit of spatial analysis. Mid-sized Canadian cities have a much smaller population than major urban centres. This can have an effect on the level of geography used as the number of census tracts (commonly used in accessibility studies) is small. As a result DAs are used but data suppression due to confidentiality reasons can lead to values of zero. Edge tracts were a problem since people living outside the CMA can enter the study area to access family physicians and people living within the CMA can use physicians that are located outside the CMA. Also, the area surrounding the CMA had a dispersed population. The smallest level of geography outside the CMA is census sub-divisions, which make it hard to incorporate into the study. Taking out the edge tracts can remove a large portion of the rural population and is thus not recommended.
There are also limitations to using z-scores to create cut-off points to determine high/low spatial and asptial scores. The cut-off points are case sensitive and would vary from one study to the next. If a score to designate low spatial scores or high aboriginal population was available then the need to create cut-off points using z-scores would not be needed. Future research can use different spatial statistics to identify clusters of aboriginal population (e.g., Moran’s I index, Getis-Ord Gi* statistics) or develop a more general set of z-score based cut-off points by taking into consideration the aboriginal settlement pattern of a larger and relevant region. However, the benefit of using cut-off points is that the results are easy for policy makers to understand. Also, the E2SFCA measure within the study used three 10 minute intervals, and weights from the Guassien function. Both the weights and the intervals in the E2SFCA measure can change for different study areas depending on the level of urbanization and size of the study area. Primary survey data would have been more capable to determine the actual travel thresholds and boundaries of travel zones associated with population located in different areas.
The paper adds to a growing number of studies focused on the issue of accessibility to healthcare. An integrated approach that considers a number of aspatial factors and spatial accessibility has been developed by Wang and Luo [8]. This study adds a methodology to measure single aspatial social groups as opposed to accessibility of the entire population by using the enhanced two-step floating catchment area method that has been developed fairly recently [31]. This can be applied to a number of different aspatial groups to better understand their accessibility to healthcare. For example the spatial access of different age groups, such as the elderly or young children could be considered. Also, families with socio-economic disadvantages, and minority populations (such as the aboriginal population studied within the paper) could be considered.
By combining the spatial accessibility scores and the aspatial scores based on population distribution the results can facilitate policy makers to identify areas with under serviced areas (with respect to access to family physicians) and high concentration of disadvantaged population. These would be areas of concern and could be targeted by policy makers to increase accessibility, or to provide alternative measures for physician access. While many studies focus on health care access in large metropolitan area [7,8] or relatively large geographical areas such as a province [14] the inequality of health care provision in small non-major metropolitan area is a relatively under researched area. By focusing on the Sudbury CMA, a small metropolitan area in Northern Ontario, the paper adds to the literature on health and access. For cities that are isolated the access among rural and urban population to primary care physicians is especially critical since there are few if any opportunities outside of the urban center.
For the Sudbury case study the at-risk areas were fairly dispersed, which would make it challenging to target those areas that have a high concentration of aboriginal peoples and low spatial access to family physicians. Strategies such as encouraging physicians to open a secondary practice location could be considered by health planning officials to improve access among rural aboriginal population. Also, better accessibility is needed for the two first nation reservations, which complicated by the interactions between the city of Sudbury and the aboriginal reservations. For planning purposes different strategies could be implemented to provide better access to the urban and rural aboriginal population.
Acknowledgements
Financial assistance from SSHRC (Social Science and Humanities Research Council of Canada) (Grant # 410-2008-2575) is gratefully acknowledged.
References
- Wilson K1, Rosenberg MW (2004) Accessibility and the Canadian health care system: squaring perceptions and realities. Health Policy 67: 137-148.
- Anderson M1, Rosenberg MW (1990) Ontario's underserviced area program revisited: an indirect analysis. SocSci Med 30: 35-44.
- Schuurman N1, Fiedler RS, Grzybowski SC, Grund D (2006) Defining rational hospital catchments for non-urban areas based on travel-time. Int J Health Geogr 5: 43.
- Lin G, Allan DE, Penning MJ (2002) Examining distance effects on hospitalizations using GIS: a study of three health regions in British Columbia, Canada. Environment and Planning A 34: 2037-2053
- Guagliardo MF (2004) Spatial accessibility of primary care: concepts, methods and challenges. Int J Health Geogr 3: 3.
- Laditka JN (2004) Physician supply, physician diversity, and outcomes of primary health care for older persons in the United States. Health Place 10: 231-244.
- Luo W, Wang F (2003) Spatial accessibility to primary care and physician shortage
- Wang F1, Luo W (2005) Assessing spatial and nonspatial factors for healthcare access: towards an integrated approach to defining health professional shortage areas. Health Place 11: 131-146.
- Kwan MP (1998) Space-time and integral measures of individual accessibility: a comparative analysis using a point-based framework. Geographical Analysis:191-216
- Arcury TA1, Gesler WM, Preisser JS, Sherman J, Spencer J, et al. (2005) The effects of geography and spatial behavior on health care utilization among the residents of a rural region. Health Serv Res 40: 135-155.
- Joseph AE, Phillips DR (1984) Accessibility and Utilization Geographical Perspectives on Health Care Delivery. Happer& Row Publishers, New York.
- Phillips D R (1979) Spatial variations in attendance at general practitioner services. Social Science & Medicine. Part D: Medical Geography: 169-181.
- Laurent S (2002) Rural Canada: Access to Health Care, Government of Canada
- Schuurman N, Berube M and Crooks VA (2010). Measuring potential spatial access to primary health care using a modified gravity model. The Canadian Geographer: 24-45
- Agency for Healthcare Research and Quality US. Department of Health and Human Services. (2009) Choosing nonopioid analgesics for osteoarthritis: clinician summary guide. J Pain Palliat Care Pharmacother 23: 433-457.
- Hartley D1, Quam L, Lurie N (1994) Urban and rural differences in health insurance and access to care. J Rural Health 10: 98-108.
- Guagliardo MF1, Ronzio CR, Cheung I, Chacko E, Joseph JG (2004) Physician accessibility: an urban case study of pediatric providers. Health Place 10: 273-283.
- Wang L (2007) Immigration, ethnicity, and accessibility to culturally diverse family physicians. Health Place 13: 656-671.
- Handy SL, Niemeier DA (1997) Measuring accessibility: an exploration of issues and alternatives. Environment and Planning A: 1175-1194.
- Joseph AE, Bantock PR (1982) Measuring potential physical accessibility to general practitioners in rural areas: a method and case study. SocSci Med 16: 85-90.
- Shen, Q. (1998) Location characteristics of innercityneighborhoods and employment accessibility of low wage workers, Environment and Planning B 25: 345-365
- Talen E and Anselin L (1998). Assessing spatial equity: An evaluation of measures of accessibility to public playgrounds, Environment and Planning 30: 595-613.
- Wang F, Minor WW (2002) Where the jobs are: employment access and crime patterns in Cleveland. Annals of the Association of American 92: 435-450.
- Yang DH1, Goerge R, Mullner R (2006) Comparing GIS-based methods of measuring spatial accessibility to health services. J Med Syst 30: 23-32.
- Radke, J., & Mu, L., 2000. Spatial decomposition, modeling and mapping service regions to predict access to social programs. Geographic Information Sciences, 6, 105-112.
- lbertDP,Butar FB (2005) Estimating the de-designation of single-county HPSAs in the United States by counting naturopathic physicians as medical doctors. Applied Geography, 25: 271-285.
- Langford M, Higgs G (2006) Measuring potential access to primary healthcare services: the influence of alternative spatial representations of population. The Professional Geographer: 294-306.
- Cervigni F, Suzuki Y, Ishii T, Hata A (2008) Spatial accessibility to pediatric services. J Community Health 33: 444-448.
- Ngui AN, Apparicio P (2011) Optimizing the two-step floating catchment area method for measuring spatial accessibility to medical clinics in Montreal. BMC Health Serv Res 11: 166.
- McGrail MR, Humphreys JS, 2009, Measuring spatial accessibility to primary care in rural areas: Improving the effectiveness of the two-step floating catchment area method, Applied Geography: 533-541.
- McGrail MR (2012) Spatial accessibility of primary health care utilising the two step floating catchment area method: an assessment of recent improvements. Int J Health Geogr 11: 50.
- Luo W, Qi Y (2009) An enhanced two-step floating catchment area (E2SFCA) method for measuring spatial accessibility to primary care physicians. Health Place 15: 1100-1107.
- Langford M, Fry R,Higgs G (2012) Measuring transit system accessibility using a modified two-step floating catchment technique, International Journal of Geographical Information Science :193-214
- Mao L1, Nekorchuk D (2013) Measuring spatial accessibility to healthcare for populations with multiple transportation modes. Health Place 24: 115-122.
- Willson A E (2009) Fundamental Causes of health disparities: A comparative analysis of Canada and the United States. International Sociology: 93-113
- Wilson K ,Nicolette C (2012) Urban Aboriginal health: Examining inequalities between Aboriginal and nonâ Aboriginal populations in Canada, Canadian Geographer: 116.
- Adelson N (2005) The embodiment of inequity: health disparities in aboriginal Canada. Can J Public Health 96 Suppl 2: S45-61.
- Greenwood ML, de Leeuw SN (2012) Social determinants of health and the future well-being of Aboriginal children in Canada. Paediatr Child Health 17: 381-384.
- Joseph P, Davis AD, Miller R, Hill K, McCarthy H, et al. (2012) Contextual determinants of health behaviours in an aboriginal community in Canada: pilot project. BMC Public Health 12: 952.
- Leduc N, Proulx M (2004) Patterns of health services utilization by recent immigrants. J Immigr Health 6: 15-27.
- Statistics Canada (2010) 2006 Aboriginal Health Profile for Sudbury.
- Wang L, Rosenberg M, Lo L (2008) Ethnicity and utilization of family physicians: a case study of Mainland Chinese immigrants in Toronto, Canada. SocSci Med 67: 1410-1422.
- Shah BR, Gunraj N, Hux JE (2003) Markers of access to and quality of primary care for aboriginal people in Ontario, Canada. Am J Public Health 93: 798-802.
- Ford JD, Ford LB, King M, Furgal C (2010) Vulnerability of Aboriginal health systems in Canada to climate change, Global Environmental Change 20: 668-680
- Omar AK, Ric S, (2003) Geographic Information Systems and Health Applications. Idea Group Publishing, Hershey, 260-278.
- Field K (2000) Measuring the need for primary health care: an index of relative disadvantage. Applied Geography 20 305–332.
- Joseph A E (1979) The referral system as a modifier of distance decay effects in the utilization of mental health care services. Canadian Geographer23 159-169.
- Matthew RM, Humphreys J S (2009) Measuring spatial accessibility to primary care in rural areas: Improving the effectiveness of the two-step floating catchment area method. Applied Geography 29 533-541.
Relevant Topics
- Addiction
- Adolescence
- Children Care
- Communicable Diseases
- Community Occupational Medicine
- Disorders and Treatments
- Education
- Infections
- Mental Health Education
- Mortality Rate
- Nutrition Education
- Occupational Therapy Education
- Population Health
- Prevalence
- Sexual Violence
- Social & Preventive Medicine
- Women's Healthcare
Recommended Journals
Article Tools
Article Usage
- Total views: 16639
- [From(publication date):
June-2014 - Apr 04, 2025] - Breakdown by view type
- HTML page views : 11956
- PDF downloads : 4683