Research Article Open Access
In Vitro Photochemical Induction of Kojic Acid-DNA Adducts
Jian-Dong Duan and Gary M. Williams*Department of Pathology, New York Medical College Valhalla, NY, United States
- *Corresponding Author:
- Williams GM
Department of Pathology
New York Medical College Valhalla
NY, USA United States
Tel: (914)594-4105
Fax: (914)594-4163;
E-mail: gary_williams@nymc.edu
Received date: July 01, 2016; Accepted date: August 02, 2016; Published date: August 04, 2016
Citation: Duan JD, Williams GM (2016) In vitro Photochemical Induction of Kojic Acid-DNA Adducts. Toxicol Open Access 2:115. doi:10.4172/2476-2067.1000115
Copyright: © 2016 Duan JD, et al. This is an open-access article distributed under the terms of the Creative Commons Attribution License, which permits unrestricted use, distribution, and reproduction in any medium, provided the original author and source are credited.
Visit for more related articles at Toxicology: Open Access
Abstract
Objective: Kojic Acid (KA) is a natural substance which inhibits skin melanin production and, when used alone or in combination with other compounds, is effective in reducing pigmentation in melasma patients. KA was classified by IARC as presenting limited evidence of carcinogenicity based largely on a single study showing thyroid neoplasms. More recently KA has been shown to be carcinogenic in rat liver, but not mouse skin. KA has produced positive and negative results in both in vivo and in vitro genotoxicity tests and was considered to be genotoxic in vitro by IARC. KA is photochemically unstable causing in vitro breakage of DNA. Consistent with this, photochemically KA is weakly mutagenicity in bacteria and induced chromosome aberrations in Chinese hamster lung cells, although it was negative on mouse epidermis in a photo-micronucleus assay. To assess the potential of KA to photochemically induce formation of DNA adducts, we investigated effects of irradiating KA and DNA with 320 nm light and analyzing for DNA adducts by the nucleotide 32P-postlabeling (NPL) method.
Methods: The ability of KA irradiated at 320 nm to induce formation of DNA adducts was compared to direct chemical reaction of chloro-KA with DNA. To ascertain the reliability of this approach, we also studied adduct formation by the photoactivated 8-mehtoxy-(8-MOP) and 4.5`, 8-trimethyl-(TMP) psoralens.
Results: All compounds in the presence of UV irradiation produced DNA adducts assessed by one or more of the NPL enhancement methods used. The pattern of major adducts formed photochemically with KA and directly with chloro-KA were similar, but could represent residual KA in chloro-KA samples. Psoralens produced different pattern of adducts.
Conclusions: Thus, KA may have the potential to be photoactivated to DNA-damaging products in skin.
Keywords
Kojic acid (KA); DNA adducts; Photochemistry; Chlorokojic acid; Psoralen
Introduction
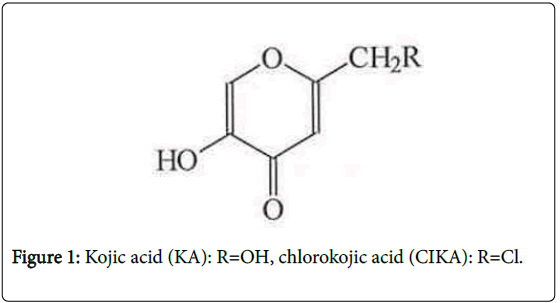
Kojic Acid (KA, 5-Hydroxy-2-hydroxymethyl-4H-4-pyranone) (Figure 1) is a natural substance produced by many microorganisms including Aspergillus oryzae . It inhibits melanin production [1] and with topical application alone, or in combination with other compounds, KA is effective in reducing pigmentation in melasma patients [2,3].
The carcinogenicity of KA was reviewed by IARC [4]. Based on a single study showing increased thyroid neoplasms in mice it was classified as having limited evidence of carcinogenicity (Group 3). KA has been shown to have some carcinogenic activity in rat liver [5,6], but not in mouse skin [5].
KA has produced both positive and negative results in both in vivo and In vitro genotoxicity assays [4,7] and was considered to be genotoxic In vitro [4]. However, in some in vivo studies KA produced negative results. Namely, it did not induce micronuclei in rat liver [8] and did not form detectable DNA adducts in rat thyroid [9] or liver [5] following oral administration.
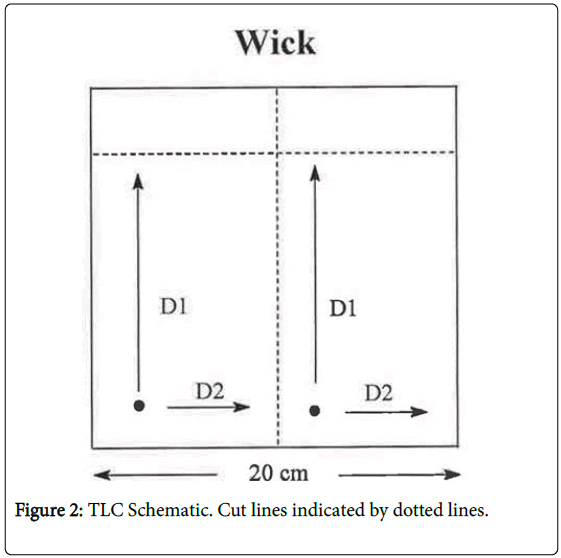
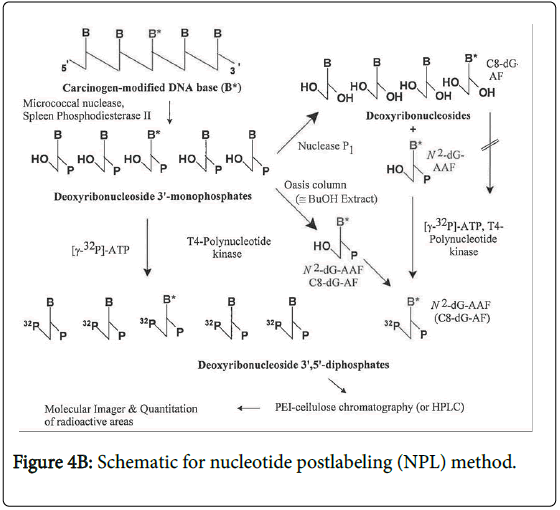
KA has long been known to be photochemically unstable causing In vitro breakage of calf thymus DNA [10]. Higa et al. [5] have addressed the potential photoactivation of KA. These authors reported that KA exerted weak photo-mutagenicity in bacteria and, with UV irradiation, induced chromosome aberration in Chinese hamster lung cells, but was negative in a mouse skin photo-micronucleus assay. To assess the relevance of the photochemical instability with respect to possible DNA adduct formation, we have investigated DNA adduct formation by irradiating KA with 320 nm light (the wavelength at the transition from UVA to UVB) in the presence of DNA and analyzing for DNA adducts by the sensitive nucleotide 32P-postlabeling (NPL) technique (Figure 2).
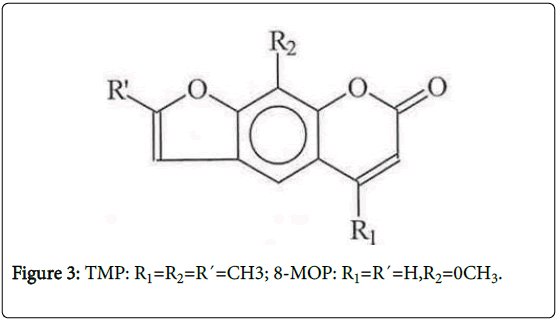
Chloro-KA (CIKA) (Figure 1) was used to establish the chromatographic conditions needed to detect KA adducts. To ascertain the reliability of this approach, we also studied photoactivation of two psoralens (8-methoxypsoralen (8-MOP) and 4, 5`, 8-trimethylpsoralen (TMP), Figure 3), which are known to be photomutagenic, although only 8-MOP has been shown to be photocarcinogenic, the data on TMP being considered inadequate [11].
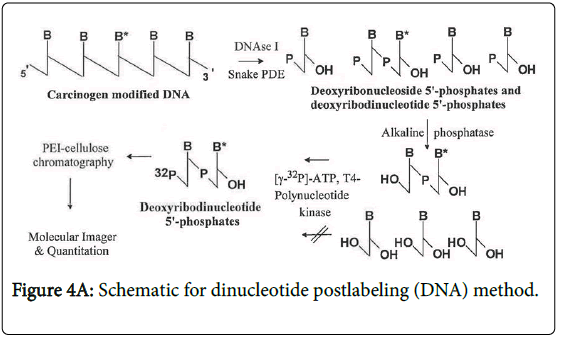
A dinucleotide postlabeling (DNP) method (Figure 4A) has been developed to enhance the detection sensitivity of psoralen-DNA adducts [12]. The basis for this modification to the NPL assays is that some DNA base modifications cannot be phosphorylated efficiently by the polynucleotide kinase (PNK) used to transfer the radiolabeled terminal phosphate group of the 32P-ATP to the modified 2`- deoxyribouncleoside 3`-phophate. Since the enzyme typically phosphorylates polynucleotides, when the DNA is digested to deoxyribodinucleotides, these are more similar to the normal substrate and therefore more likely to be phosphorylated. However, not all DNA base modifications inhibit the phosphodiesterase and consequently a deoxyribonucleotide rather than a deoxyribonucleoside is formed. In this case, alkaline phosphatase treatment will form a deoxyribonucleoside which is not a substrate for the PNK and thus this DNP cannot be used.
We report that CIKA reacted directly with DNA whereas KA, and psoralens, 8-MOP and TMP, only with UV irradiation at 320 nm and 365 nm, respectively, produced DNA adducts detected by one or more of the postlabeling enhancement methods. The major adducts formed photochemically with KA and directly with chloro-KA (CIKA) were chromatographically similar, but could represent residual KA in CIKA samples. Psoralens produced different pattern of adducts. Thus, KA may have the potential to be photoactivated to DNA-damaging products in skin.
Materials and Methods
KA, thionyl chlororide, 8-MOP, TMP, calf thymus 2`deoxyribonucleic acid (CT-DNA), micrococcal nuclease, spleen phosphodiesterase, DNAse І (D4263), snake venom phosphodiesterase (P6877) and alkaine phosphatase (P4252) and nuclease P1 (NP1) were obtained from Sigma Chemical Co.,St. Louis, MO, T4 PNK from USB corp. Cleveland OH, adenosine (γ-32P) triphosphate from PerkinElmer Life and Anal Sci, Waltham, MA and PEI cellulose thinlayer chromatography (TLC) plates (JT4473-4) through VWR Scientific Corp, Bridgeport NJ. Chloro-KA (CIKA) was prepared as previously described by Kipnis et al. [13] by adding 142 mg (1 mmoles) KA to 147 μl thionyl chloride (2 mmoles) in 3 ml chloroform, which was then gentled reflux for 3 hours. After cooling and evaporation of the chloroform, the CIKA was recrystallized from water (mp 164-166°C) [13].
In vitro modification of DNA
CIKA (4 mg) dissolved in acetone (80 μl), was added to CT-DNA (400 μg) in 320 μl in 0.1 M sodium phosphate buffer, pH 7.2 and incubated for 12 or 72 hours at 37°C. Control samples with KA (4 mg) or solvent alone were similarly incubated.
Photochemically, CT-DNA (400 μg/ml in 10 mM Tris HCl buffer, pH 7.2 or 9.2) was modified by incubation with 1.5 or 0.15 mM KA and irradiation with 1.8 mJ/cm2 (6 μW/cm2 for 5 min) of 320 nm UV light using a SPF-500C spectrofluoremeter (SLM-Amino Inc) and a 20 nm bandpass. The photochemical decomposition of KA was measures by decline in the absorption at 320 nm. For the psoralens, CT-DNA 100 μg/100 μl 10 mM Tris HCl buffer pH 7.2 was irradiated with 150 mJ/cm2 (250 μW/cm2 for 10 minutes) of UVA light (365 nm) with or without 40 μg 8-MOP or TMP 50 μg (in DMSO 10 μl) in 10 mM Tris HCl, pH7.2. To precipitate the DNA, half the volume of 7.5 M ammonium acetate was added followed by 2 volumes of ethanol. Cold ethanol (70%) was used to wash the DNA which was re-dissolved in water and its purity and quantity estimated from 230/260/280 ratios of the UV spectra in 10 mM Tris HCl buffer, pH 7.2.
Nucleotide 32P-postlabeling of DNA adducts
Digestion: The standard NPL procedures (Figure 4B) were conducted as previously described [14]. The DNA samples (10 μg) were enzymatically digested to 2`-deoxyribonucleoside 3`-phosphates using micrococcal nuclease and spleen phosphodiesterase. The digestion mixtures were then enriched for DNA modified bases using NP1 digestion [15] or OASIS HLB [14] enrichment methods. For the DNP (Figure 4A), [12] isolated DNA (10 μg) was enzymatically digested into 2`-deoxyribodinucleoside 3`-monophosphates using DNAse І (0.4U), snake venom phosphodieterase (0.04U) and alkaline phosphoatase (0. 4U) at 37°C for 20 hours in 4mM magnesium chloride, 10 mM Tris HCl, pH 7.5 buffer. The next day, hydrolysis was continued by the further addition of 0.02 U snake venom phosphodiesterase and 0.2 U alkaline phosphatase and 3 hours later the reaction was stopped with 5 vol cold ethanol and the enzymes and buffers removed by centrifugation before the supernatant was evaporated to dryness using a Speed Vac. The pellets were resuspended in 12 μl distilled water and 3 μl of 0.5 M Tris-base.
Kinase reaction: For the NPL, to the enriched DNA modified bases preparation were added 100 μCi adenosine (γ-32P) triphosphate and 45U T4 PNK and incubated for 40 min at 37°C before the labeled modified bases were resolved using two-direction TLC on PEIcellulose plates using the solvent as indicated in the tables and figures.
For the DNP, each DNA sample was incubated with 5U of T4 PNK and 100 μCi 32P-ATP in 0.5 μl 10 mM bicine, pH 9.7 in the kinase buffer supplied with the enzyme for 35 min at 37°C. Each tube received 0.4U of apyrase for 30 min.
Detection: The reaction mixtures were spotted on TLC plates and chromatographed using the solvents as indicated in Table 1 and Figure 2. The 32P-labeled modified bases were detected using a Molecular Dynamics storm system and quantified using Imagequant ( general Electric, Schenectady, NY) and Peakfit software (Systat Software, Inc, Chicago, IL). Quantitation should be considered relative since each modified base is detected with its own specific efficiency resulting from different efficiencies of digestion, enrichment and phosphorylation.
| TLC Buffer Designation | Composition | ||
|---|---|---|---|
| N | 0.28 M ammonium sulfate/50 mM sodium phosphate pH 6.6 | ||
| S1 | 2.3 M sodium phosphate, pH 5.5 | ||
| S3 | 3.3 M lithium formate/8.0 M Urea pH 3.5 | ||
| S4 | 1.2 M lithium chloride, 0.5 M Tris HCL, 8 M urea pH 8.0 | ||
| S5 | 1.4 M urea, 0.14 M NaH2, PO4, pH 6.4 | ||
| TLC Buffer Dilution for optimal separation* | Enhancement | Figure | |
| 8-MOP | ↑S1, →N, ↑40% S5 | DNP | 6C |
| TMP | ↑S1, →N, ↑80% S5 | DNP | 6D |
| CIKA | ↑S1, ↑N, →60% S3 | NPL | 7C |
| KA + UV | ↑S1, ↑65% S4, →60% S3, ↑65% S4 | NPL | 8C |
Table 1: TLC Buffer Composition and Use.
Results and Discussion
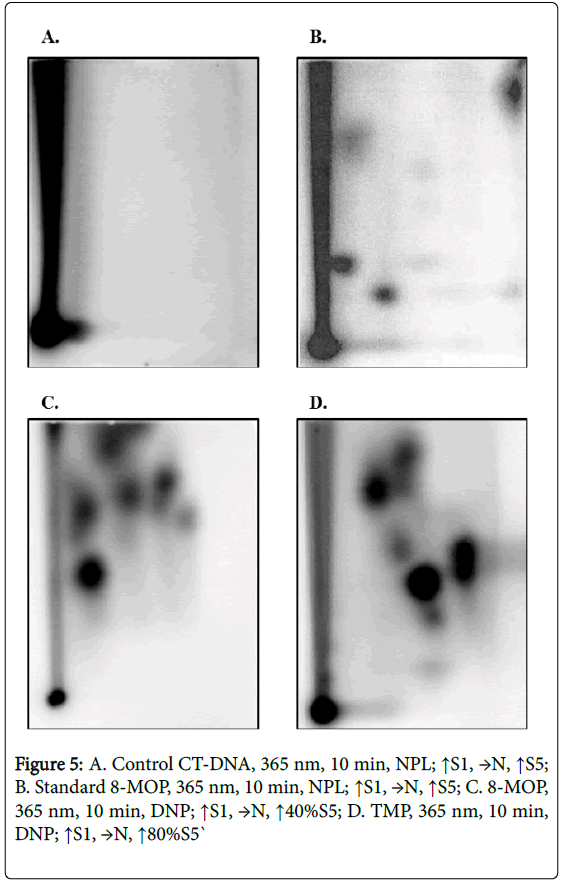
Psoralens were used as initial test substances since they are well established to react photochemically with DNA. Following irradiation at 365 nm, both 8-MOP and TMP showed DNA adducts by NP1 and OASIS enrichment NPL methods, but the sensitivity was substantionally better using the psoralen-specific DNP method (Figures 5B-5D and Table 2). All methods gave complex patterns of adducts which were qualitatively similar by the NP1 and OASIS methods but different by DNP method (Figures 5B and 5C) since chemically different phosphorylated adducts are produced by this method [16]. Adduct patterns change with increased duration of irradiation as additional cross-linking occurs (data not shown). No adducts were present in irradiated control CT-DNA samples (Figure 5A).
| Compound | UV | Oasis HLB | Nuclease P1 | DNP | |||
|---|---|---|---|---|---|---|---|
| No spots* | Adducts in 108 | No spots* | Adducts in 108 | No spots* | Adducts in 108 | ||
| 0.15mM KA, pH 7.2 | 320nm | ND | - | 2 | 21 | ND | - |
| 1.5mM KA, pH 7.2 | 320nm | ND | - | 3 | 385 | ND | - |
| 1.5mM KA, pH 9.2 | 320nm | ND | - | 3 | 623 | ND | - |
| CIKA 12 hrs | - | ND | - | 3 | 1.6 | ND | - |
| CIKA 72 hrs | - | ND | - | 3 | 53 | ND | - |
| 8-MOP | UV-A | 3 | 211 | 3 | 134 | 4 | 5703 |
| TMP | UV-A | 4 | 3318 | 4 | 4833 | 3 | 8627 |
Table 2: Summary Table of DNA Adduct Levels.
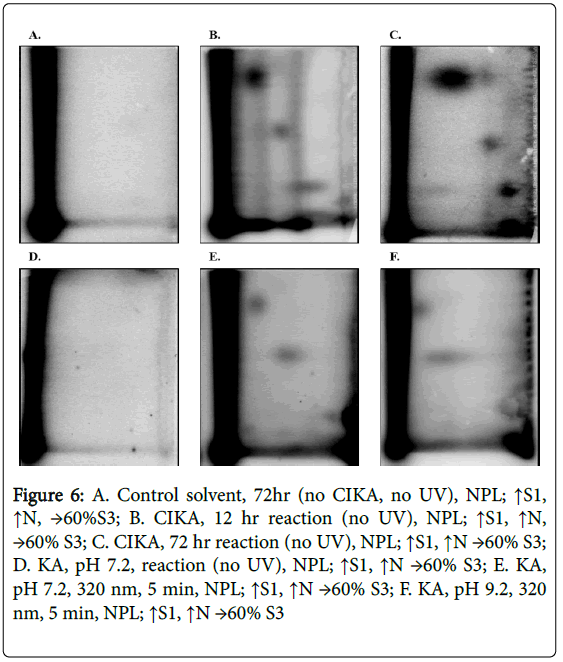
Since CIKA has been reported to react with nucleophiles, likely involving the 5-hydroxyl group and elimination of the halide moiety, we determined whether it would react with DNA and thereby provide additional reference DNA adducts to guide establishment of chromatographic conditions for detection of any photochemically formed adducts between KA and DNA. CIKA was synthesized and reacted In vitro with CT-DNA. The CT-DNA was analyzed by both NPL, with enrichment by both NP1 and OASIS HLB methods, and DNP. No DNA adducts were detected in the DNA treated in a similar manner with KA at pH 7.2 in the dark or solvent alone (Figures 6A and 6D), likewise, no adducts were present in the samples with KA without UV irradiation at pH 9.2 (data not shown). In contrast, CIKA samples showed several major DNA adducts (Figures 6B and 6C) with DNA adduct levels of 1.6 in 108 by 12 hours and 53 in 108 by 72 hours (Table 2).
Figure 6: A. Control solvent, 72hr (no CIKA, no UV), NPL; ↑S1, ↑N, →60%S3; B. CIKA, 12 hr reaction (no UV), NPL; ↑S1, ↑N, →60% S3; C. CIKA, 72 hr reaction (no UV), NPL; ↑S1, ↑N →60% S3; D. KA, pH 7.2, reaction (no UV), NPL; ↑S1, ↑N →60% S3; E. KA, pH 7.2, 320 nm, 5 min, NPL; ↑S1, ↑N →60% S3; F. KA, pH 9.2, 320 nm, 5 min, NPL; ↑S1, ↑N →60% S3
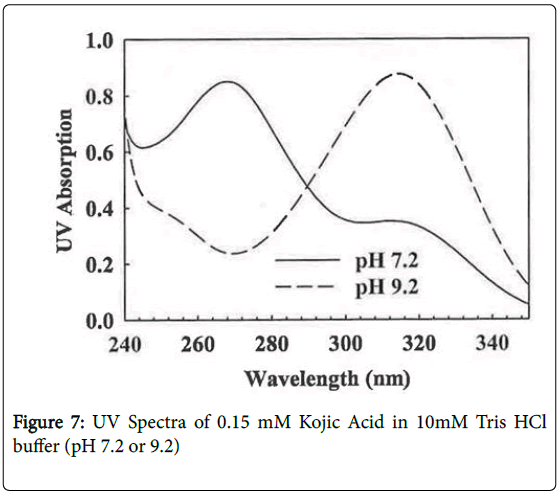
KA undergoes a significant UV spectral shift as it ionizes (pKa 7.72, [17]) from a maximum at 268 nm at pH 7.2 to 314 nm at pH 9.2 (Figure 7). Owing to this absorption change, KA was irradiated at both pH values but, as expected owing to the lower molar extinction coefficient, a longer time was needed at the low pH value to deplete the KA as measured by decrease in absorption at 320 nm and lower adduct levels were found (Table 2). With UV irradiation a similar DNA adduct pattern was found at both pHs (Figure 6E and 6F).
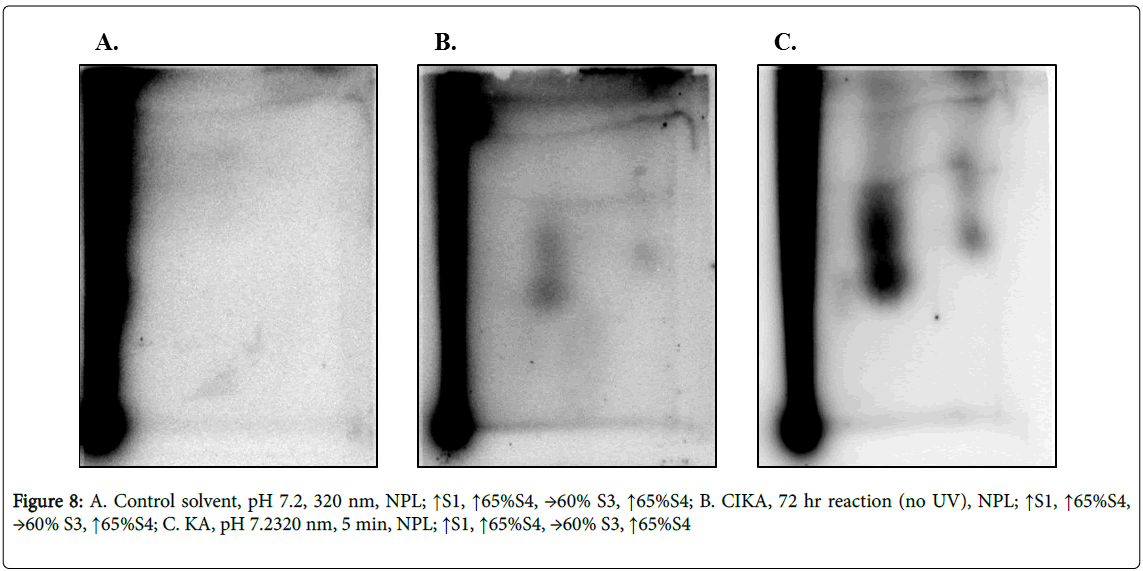
As with the direct reaction of CIKA with DNA, the photochemically prepared KA-DNA samples showed several DNA adducts (Figures 8B and 8C), some being chromatographically similar to those formed from CIKA (compare Figures 6C, 6E and 8B, 8C). It cannot be excluded that the similar patterns of adducts could be a result of residual KA in the CIKA samples. No adducts were present in the control samples with solvent alone (Figure 8A). Since the TLC system is not highly resolving, additional verification of adduct identity would be needed before the chromatographically similar spots could be considered conclusively to represent the same adduct. The relative intensities of the spots were not, however, equivalent in the two samples. Total DNA adduct levels are summarized in Table 2. Owing to the differences in methods used and the many assumptions made in the quantitation, the values cannot be taken as absolute.
One characteristic of the major KA-DNA adducts was that in initial stages of chromatography in the S1 and standard S3 buffers, the adducts did not move, whereas, they migrated in S4 and subsequently in S3. This was interpreted as evidence that the DNA adduct had undergone some chemical change on the TLC plate under the acidic condition of the buffer. Experiments in which the pH of the kinase reaction was, after the initial standard incubation, lowered to pH 3.5 for an hour, which is the approximate time of the chromatography in the S4 buffer, failed to reveal any change in the chromatographic properties of the KA-DNA adducts.
Thus we can only surmise that it requires additional catalytic effects of the polyethylimine in the cellulose matrix. Similar effects have been previously noted [18]. This does not alter the fundamental observation of DNA adduct formation, but indicates that caution is needed to avoid possible negative results depending upon the order in which the solvents are run. These changes, although not yet fully characterized, are reminiscent of those seen with the malondiadehydedeoxyguanosine adduct which has been suggested to involve a Schiff base formation [19].
Thus, KA-DNA adducts were readily formed with exposure to 320 nm light. UVA/B radiation of these wavelengths comprises about 8% of total solar energy [20] and the amount of light used in this experiment was equivalent to less than 2% of the energy in direct zenith sunlight [21]. Therefore patients using KA-containing preparations during daylight without adequate photo protection might well be susceptible to UVA/B light sources, including sunlight, until the KA has diffused from the skin. KA is considered not to possess initiation or promotion activity in mouse skin carcinogenesis [5]. In a photo-micronucleus study in which 1 or 3% KA-containing cream was applied to the back of animals with a 24 hours interval, KA did not induce micronuclei in mouse epidermal cells and was not considered to have photocarcinogenic potential [5]. Photocarcinogenesis, however, has not been studied directly. Analysis of skin biopsies from KA-treated patients for KA-related DNA adducts could provide further confirmation of our finding and would be valuable in undertaking a human risk assessment.
In summary, In vitro photochemical activation of chemicals to DNA-reactive species is a facile means of assessing potential photogenotoxicity.
Acknowledgement
One colleague, Alan Jeffrey, who is now deceased, contributed to this study. We wish to thank Tetyana Kobets for the help with the revision of the manuscript.
References
- Moon KY, Ahn KS, Lee J, Kim YS (2001) Kojic acid, a potential inhibitor of NF-kappa B activation in transfectant human HaCaT and SCC-13 cells. A rch Pharm Res 24: 307-311.
- Garcia A, Fulton JE Jr (1996) The combination of glycolic acid and hydroquinone or kojic acid for the treatment of melasma and related conditions. DermatolSurg 22: 443-447.
- Prignano F, Ortonne JP, Buggiani G, Lotti T (2007) Therapeutical approaches in melasma. DermatolClin 25: 337-342.
- International Agency for Research on Cancer (IARC) (2001). IARC Monograph on the Evaluation of Carcinogenic Risks to Humans. Volume 79. Some Thyrotropic Agents. Lyon, France 607-618.
- Higa Y, Kawabe M, Nabae K, Toda Y, Kitamoto S, et al. (2007) Kojic acid -absence of tumor-initiating activity in rat liver, and of carcinogenic and photo-genotoxic potential in mouse skin. J ToxicolSci 32: 143-159.
- Takizawa T, Imai T, Onose J, Ueda M, Tamura T, et al. (2004) Enhancement of hepatocarcinogenesis by kojic acid in rat two-stage models after initiation with N-bis(2-hydroxypropyl)nitrosamine or N-diethylnitrosamine. ToxicolSci 81: 43-49.
- Nohynek GJ, Kirkland D, Marzin D, Toutain H, Leclerc-Ribaud C, et al. (2004) An assessment of the genotoxicity and human health risk of topical use of kojic acid [5-hydroxy-2-(hydroxymethyl)-4H-pyran-4-one]. Food ChemToxicol 42: 93-105.
- Suzuki H, Ikeda N, Kobayashi K, Terashima Y, Shimada Y, et al. (2005) Evaluation of liver and peripheral blood micronucleus assays with 9 chemicals using young rats. A study by the Collaborative Study Group for the Micronucleus Test (CSGMT)/Japanese Environmental Mutagen Society (JEMS)-Mammalian Mutagenicity Study Group (MMS). Mutat Res 583: 133-145.
- Tamura T , Mitsumori K , Totsuka Y , Wakabayashi K , Kido R , et al. (2006) Absence of in vivo genotoxic potential and tumor initiation activity of kojic acid in the rat thyroid. Toxicology 222: 213-224.
- Bhat R, Hadi SM (1992) Photoinduction of strand scissions in DNA by kojic acid: role of transition metal ions and oxygen free radical intermediates in the reaction. Mutagenesis 7: 119-124.
- International Agency for Research on Cancer (IARC) (1998) Monographs on the Evaluation of Carcinogenic Risks to Humans Overall Evaluations of Carcinogenicity: An Updating of IARC Monographs Volumes 1 to 42 Supplement 7. Monographs.
- Gillardeaux O, Périn-Roussel O, Nocentini S, Périn F (1994) Characterization and evaluation by 32P-postlabelling of psoralen-type DNA adducts in HeLa cells. Carcinogenesis 15: 89-93.
- Kipnis F, Soloway H, Ornfelt J (1948) Kojic acid derivatives. J Am ChemSoc 70: 4264-4265.
- Jeffrey AM, Luo FQ, Amin S, Krzeminski J, Zech K, et al. (2002) Lack of DNA binding in the rat nasal mucosa and other tissues of the nasal toxicants roflumilast, a phosphodiesterase 4 inhibitor, and a metabolite, 4-amino-3,5-dichloropyridine, in contrast to the nasal carcinogen 2,6-dimethylaniline. Drug ChemToxicol 25: 93-107.
- Reddy MV, Randerath K (1986) Nuclease P1-mediated enhancement of sensitivity of 32P-postlabeling test for structurally diverse DNA adducts. Carcinogenesis 7: 1543-1551.
- Uher M, Szymonska J, Korenova A, Tomasik P (2000) Re-examination of NucleophilicSubstitutioninChlorokojic Acid. MonatsheftefuerChemie 131: 301-307.
- Balaz S, Sturdík E, Ujhelyova R, Valigura D, Uher M, et al. (1993) Biologically Important Physicochemical Properties of Kojic Acid Derivatives. Collect Czech ChemCommun 58: 693-701.
- Wacker M, Schuler D, Wanek P, Eder E (2000) Development of a 32P-postlabeling method for the detection of 1, N2-propanodeoxyguanosine adducts of trans-4-hydroxy-2-nonenal in vivo. Chem Res Toxicol 13: 1165-1173.
- MaoH, Schnetz-Boutaud NC, Weisenseel JP, Marnett LJ, Stone MP (1999) Duplex DNA catalyzes the chemical rearrangement of a malondialdehydedeoxyguanosine adduct. ProcNatlAcadSci USA 96: 6615-6620.
- Gibson J H. UVB Radiation: Definition and Characteristics.
- MHI (Micropyretics Heaters International.Inc) (2008) Online Conversion-Watt Calculator.
Relevant Topics
- Aflatoxins
- Cardiac Toxicity
- Chemical Toxicology
- Developmental Toxicology
- Drug Toxicity
- Heavy Metal Toxicity
- Heavy Metal Toxins
- Industrial Hygiene Toxicology
- Insecticides Toxicology
- Metal Toxicology
- Nano Toxicology
- Pesticidal Toxicology
- Renal Toxicity
- Reproductive Toxicology
- Skin Toxicology
- Tetanus Toxin
- Toxicogenomics
- Toxicology Reports
- Toxicology Testing
Recommended Journals
Article Tools
Article Usage
- Total views: 12274
- [From(publication date):
October-2016 - Apr 02, 2025] - Breakdown by view type
- HTML page views : 11333
- PDF downloads : 941
