Research Article Open Access
Improving Resource Use Efficiency of Cereal Based Cropping Systems with Integration of Best Management with Conservation Agriculture Under Changing Agricultural Scenarios in Cauvery Delta of Tamil Nadu
Sharma S1*, Rajendran R2, Ravi V2, Panneerselvan P1, Janarthanan P1, Saharawat Y2 and Ladha JK11International Rice Research Institute-India Office, NASC Complex, Pusa, New Delhi, India
2Coconut Research Station, Tamil Nadu Agricultural University, Veppankulam, Thanjavour, Tamil Nadu, India
3Tamil Nadu Rice Research Institute, Tamil Nadu Agricultural University, Aduthurai, Thanjavour, Tamil Nadu, India
4International Center for Agricultural Research in the Dry Areas (ICARDA), Kabul, Afghanistan
- *Corresponding Author:
- Sharma S
International Rice Research Institute-India Office
NASC Complex, Pusa, New Delhi, India
Tel: +919873417161
E-mail:sheetal.sharma@irri.org
Received Date: August 03, 2015; Accepted Date: October 04, 2016; Published Date: October 07, 2016
Citation: Sharma S, Rajendran R, Ravi V, Panneerselvan P, Janarthanan P, et al. (2016) Improving Resource Use Efficiency of Cereal Based Cropping Systems with Integration of Best Management with Conservation Agriculture Under Changing Agricultural Scenarios in Cauvery Delta of Tamil Nadu. J Ecosys Ecograph 6: 213. doi:10.4172/2157-7625.1000213
Copyright: © 2016 Sharma S, et al. This is an open-access article distributed under the terms of the Creative Commons Attribution License, which permits unrestricted use, distribution, and reproduction in any medium, provided the original author and source are credited.
Visit for more related articles at Journal of Ecosystem & Ecography
Abstract
Cropping systems in Cauvery Delta Zone of Tamil Nadu is intensive rice based with double or triple rice crops in a year. The rice system in the region is threatened by yield stagnation, scarcity of water and labour, increased costs of cultivation, and resource degradation. During 2009-2012, we evaluated four scenarios involving a range of best management practices (BMPs) with and without conservation agriculture (CA) components for improving the system productivity and economic returns of rice-based system. Four scenarios were (i) current farmers’ practice (S1), (ii) BMPs with conventional tillage (S2), (iii) BMPs with conservation agricultural technologies (S3), and (iv) BMPs with conservation agricultural technologies along with crop diversification (S4). The key parameters tested were crop yields, system productivity, labour and energy use efficiency, and economics. Results indicated that compared to S1, the BMPs in S2 improved system crop productivity (22–57%), and net economic returns (67–166%) with reduced cultivation cost (10-16%), and total system energy use (4.4-8%), and higher labour productivity (18-59%). Compared to farmers practices (S1), BMPs with CA practices such as zero/reduced tillage, direct seeding of rice in dry season and mechanical transplanting of rice in wet season (S3) had lower labor (14-25%) and energy (20-37%) usages with higher economic returns (25-73%). Crop diversification with maize in place of dry season rice in S4 though saved in labor input, crop productivity and economic returns were also lower. This study concluded that there is potential of improving productivity and economic returns of rice based cropping systems with BMPs and CA in Cauvery Delta Zone of Tamil Nadu. However, more medium to long-term adaptive system research is needed to identify compatible alternative crops/management practices in rice based systems to diversify the food production and increase the system productivity while conserving the natural resources.
Keywords
Best management practices; Conservation agriculture; Rice; System productivity; Resource use efficiency; Crop diversification
Introduction
It is estimated that the global food production must increase by about 60% between 2010 and 2050 to meet the growing demand which is likely to be higher with developing countries [1]. Rice is the most important food crop of the developing world and staple food of millions in Asia. India has the world’s largest area under rice cultivation and is one of the largest producers of white rice, accounting for 20% of global rice production. India must increase its production substantially to feed one and a half billion plus population by 2050 [2]. However, the declining yield growth rates are of particular concern in double and triple crop rice mono-cropping system [3]. Average yield growth rate of rice was 2.5% per year from 1967 to 1984 but it dropped to 1.2% during 1984- 1996 [4]. The possible causes of decline in growth rates could be many but yield stagnation or yield decline resulting from poor agronomy and soil management including intensive tillage and labor intensive planting methods are believed to be key [5].
Tamil Nadu is the seventh largest rice producing states of India [6]. Rice is grown in 2 million ha in different seasons, and it occupies 61 percent of net irrigated area of the state [7,8]. The Cauvery Delta Zone considered to be rice bowl of Tamil Nadu, contributes major part of the rice production in the state. Cropping pattern in the Cauvery Delta Zone is largely rice-based. The green revolution has transformed the irrigated areas of this zone into intensive double cropped rice-rice system and triple cropped rice-rice-rice systems [9]. Similar to Tamil Nadu, India, there are millions of hectares of double or triple rice based cropping systems in South and South East Asia [10,11]. However, future contribution of these systems is threatened by yield stagnation, shortages of labor and water, increased costs of cultivation and resource degradation [12-15].
Since there is not much scope for opening of new area under rice due to increasing urbanisation and shortages of inputs particularly water, the additional production must come from existing cultivated area through greater productivity and greater input use efficiencies [16]. To ensure food security and to achieve the projected demand, crop intensification along with system management approaches should be adopted [15,17]. This is possible through best management and conservation agricultural (CA) practices, integrated into intensive cropping systems [10,15,18].
Rice is predominantly grown by transplanting seedling into puddled and ponded soil and the field is kept flooded during most of the cropping season. The soil is puddled to achieve good crop establishment, weed control, and to reduce deep percolation losses [19,20]. However, soil puddling and transplanting require large amounts of water and energy, which are getting meagre and more expensive, thus reducing the profitability and system sustainability [21,22]. Furthermore, the conventional tillage-transplanted rice is also a major contributor of global methane emissions [23,24] and destroys soil structure with adverse effects on the growth and yield of upland crops in rotation [20]. Therefore, CA based practices such as zero/ reduced tillage, residue management and direct seeding of rice, could be superior alternative to puddled transplanted rice. The major benefits of conservation tillage and direct seeding of rice with lower or equivalent crop yields compared to transplanted rice lie with higher resource use efficiency and farmers profit [21,25-30]. Shifting from intensive tillage and transplanting to reduce or no tillage and drill seeding, not only allows crop diversification and intensification but also allows residue retention which otherwise not feasible especially in double lowland rice system [31-33]. Residue retention in soil after crop harvest plays an important role in maintaining soil health including favourable soil water conditions. Additionally, there is a need of exploring the alternative or additional crop [34] for double or triple rice based cropping systems. Crops such as a legume or maize for which demand is rising [34] could be included as an additional or a substitution crop which may increase overall system productivity and profitability.
As part of a regional (Cereal Systems Initiative for South Asia; http://csisa.org/) study, we established four production scale research platforms in 2009 representing major food production systems of South Asia to evaluate and optimize three cropping systems and agronomic management scenarios in comparison with the current farmers practices. Earlier, we published the results of three sites covering agroecologies in Indo-Gangetic Plains (Western – Karnal, Haryana India; central – Patna, Bihar India; and eastern – Gazipur, Bangladesh). This paper reports results of a 3 year study at the sub-tropical South India – Aduthurai, Tamil Nadu, India which is characterized by an intensive double-cropped rice-rice system with an aim to improve system production and efficiency with lower environmental footprints [35]. A range of parameters related to crop productivity, economic outputs, and labor and energy use efficiencies were measured.
Materials and Methods
Experimental site
The study was conducted at the Cereal System Initiative for South Asia (CSISA) experimental research platform located at Tamil Nadu Rice Research Institute, Aduthurai, Cauvery Delta Zone, Tamil Nadu (11°N latitude and 79.3°E longitude) which represents the subtropical south Indian peninsula. Under the project four treatments/scenarios varying in input and management practices were established in 2009 with an expected time frame of at least 10 years. The climate of Aduthurai is subtropical with mean annual rainfall of 1142 mm and maximum and minimum temperatures of 33.3°C and 24.1°C respectively. The relative humidity is 94% during forenoon and 61% during afternoon. The bright sunshine hours are 7.4 d¹. Seasonal weather data including rainfall, mean monthly minimum and maximum temperature for the study period are presented in Figure 1. Rice is the major crop in the area and crop production is distributed across the three seasons: dry season (Kuruvai); June-September, wet season (Thaladi): October – January and summer season: February – March. The site was under continuous rice cultivation for several years before the establishment of the experimental platform. The initial soil characteristics of the site are given in Table 1.

Figure 1: Rainfall, maximum temperature and minimum temperature for the experimental year 2009-2012.
| Soil properties | 0-15 cm soil depth | 16-30 cm soil depth | ||
|---|---|---|---|---|
| Range | Mean±S.E.a | Range | Mean±S.E.a | |
| Clay (%) | 40-52 | 46.5±0.5 | 42-54 | 48.2±0.5 |
| Silt (%) | 18-30 | 22.8±0.3 | 16-26 | 21.0±0.3 |
| Sand (%) | 26-36 | 30.8±0.4 | 24-38 | 30.8±0.5 |
| Soil texture | Clay | Clay | ||
| pH (1:1 soil:water) | 7.1-7.7 | 7.5±0.02 | 7.3-8.0 | 7.7±0.02 |
| EC (dsm-1) (1:1 soil:water) | 0.3 – 1.6 | 0.5±0.03 | 0.3 – 0.8 | 0.5±0.02 |
| Total carbon (%) | 0.9 – 1.7 | 1.2±0.02 | 0.6 – 1.4 | 0.9±0.03 |
| Total nitrogen (%) | 0.08 – 0.13 | 0.1±0.002 | 0.04 – 0.11 | 0.07±0.002 |
| Available P (mg kg-1) | 1.9– 28.6 | 11.1±0.7 | 1.3 – 19.3 | 5.9±0.6 |
| Exchangeable K (mg kg-1) | 258-344 | 323±6.6 | 94-126 | 114±2.9 |
| Particle density (g cm-3) | 2.3 – 2.6 | 2.4±0.01 | 2.2 – 2.6 | 2.4±0.01 |
aS.E., standard error
Table 1: Initial soil properties at 0-15 cm and 16-30 cm soil depth of research platform site, Aduthurai, Tamil Nadu.
Experimental details and management
The experimental field was laser levelled and a cover crop of rice was grown in dry (Kuruvai) 2009 to encourage soil uniformity. The four cropping system treatments (referred as scenarios; S) were established in wet season 2009-10. Each scenario was replicated thrice in production scale plots, each of 2000 m² size (80 m × 25 m), in a randomized complete block design. The scenarios were designed based on different drivers of agricultural change and they varied from each other in crop rotation, tillage, crop establishment, residue management, and crop management (Table 2). The four scenarios were compared with one another, of which S1 represented farmers practice. Scenario 1 included farmers’ practices including crop rotation, crop establishment and residue management. This was based on on-farm survey conducted in surrounding farmers’ fields before the establishment of the trials. Ricefallow- rice, a dominant rotation in the region was adopted in S1. Both rice crops were transplanted in puddled soil and residue removed in S1. Other key farmer’s key management practices include: transplanting of 20-30 days old seedlings at random spacing, addition of pre emergence herbicide followed by only hand weeding for weed control and thin film of water maintained at the time of planting (Table 3). Scenario 2 included available BMPs with conventional tillage and partial residue (stubbles) incorporation in rice-black gram-rice rotation. Scenarios 3 and 4 both had BMPs with conservation tillage and residue mulch but S3 had rice-black gram-rice rotation and S4 had rice-maize-maize or rice-maize-rice rotation.
| Features | Scenario 1 | Scenario 2 | Scenario 3 | Scenario 4 |
|---|---|---|---|---|
| Business-as-usual – Farmers’practice | Best management practices (BMPs) | BMPs along with partial conservation agriculture (CA) based system | BMPs with partial CA in diversified systems | |
| Drivers of change | None | Need for increased production and farmers’ income | Need for increased production and farmers’ income in the face of increasing scarcity of labor, water, energy and soil degradation | Need for diversification, increased production and farmers’ income in the face of increasing scarcity of labor, water, energy and soil degradation |
| Approach | Farmers’ management practices | BMP and partial crop residue retention | BMP, reduced tillage, machinery use and crop residue retention | Crop diversification, BMP, reduced tillage, machinery use and crop residue retention |
| Crop rotation | Wet season : Rice Summer : Fallow Dry season: Rice (Rice –Fallow–Rice) |
Wet season : Rice Summer : Legume Dry season: Rice Rice – Legume –Rice) |
Wet season : Rice Summer : Legume Dry season: Rice (Rice – Legume –Rice) |
Wet season : Rice Summer : Maize Dry season: Maize (yr 1 and 2 and rice yr 3) (Rice- Maize-Maize) |
| Tillage | Wet season: Conventional till (puddled) Summer: Fallow Dry season: Conventional till (puddled) |
Wet season: Conventional till (puddled) Summer: Zero tillage Dry season: Conventional till (puddled) |
Wet season: Un-puddled (reduced till) Summer: Zero tillage Dry season: Zero tillage |
Wet season: Un-puddled (reduced till) Summer: Zero tillage Dry season: Zero tillage |
| Crop establishment | Wet season: Transplanted manually Summer: Fallow Dry season: Transplanted manually |
Wet season: Transplanted manually Summer: Relay Dry season: Transplanted manually |
Wet season: Mechanically transplanted Summer: Relay Dry season: Drillsown |
Wet season: Mechanically transplanted Summer: Drill sown Dry season: Drill sown |
| Residue management | All crop residues removed | Wet season: 30 cm rice straw of dry season incorporated Summer: 30cm rice residue of wet season mulched Dry season: The entire residue of legume from the summer season incorporated. |
Wet season: 70% of machine harvested rice residue mulched Summer: 70% of machine harvested rice residue as mulched Dry season: The entire residue of legume from the summer season mulched. |
Wet season: 70% of manually harvested maize(maize in yr 1, 2 and rice yr 3)straw were mulched Summer: 70% of machine harvested rice straw and residues were mulched Dry season: 70% of manually harvested maize straw mulched |
Table 2: Summary of the four cropping systems scenarios.
| Activity/operation | Scenario 1 | Scenario 2 | Scenario 3 | Scenario 4 | |
|---|---|---|---|---|---|
| (a)Wet season rice | |||||
| Crop | Rice | Rice | Rice | Rice | |
| Cultiver | ADT 38 | ADT 46 | ADT 46 | KRH 2in 2009-10 and ADT 38 in 2010-11 | |
| Seeds and seedling nursery management | |||||
| Seeds | Certified seeds | Certified seeds | Certified seeds | Certified seeds | |
| Seed treatment @ 3 g kg-1 seed | Pseudomonas fluorescens 10g/kg of seed | Pseudomonas fluorescens 10g/kg of seed | Pseudomonas fluorescens 10g/kg of seed | Pseudomonas fluorescens 10g/kg of seed | |
| Seed bed | Flat bed | Dapog nursery | Tray | Tray | |
| Seed rate (kg ha-1 of seed bed) | 40 | 40 | 40 | 40 | |
| Land preparation Power tiller |
Intially ploughed 6 days before transplanting with a tractor drawn cultivator and then puddled with a tractor drawn cage wheel. The field was leveled with a woodedn plank before layout formation. | Intially ploughed 6 days before transplanting with a tractor drawn cultivator and then puddled with a tractor drawn cage wheel. The field was leveled with a woodedn plank before layout formation. | Zero tillage | Zero tillage | |
| Date sown | 06 September | 14 September | 06 October | 18 September | |
| 2009 | |||||
| 2010 | 22 August | 1 September | 26 September | 26 September | |
| 2011 | 5 Oct | 7 Oct | 12 Oct | 12 Oct | |
| Date transplnted/planted | 27 September | 30 September | 20 October | 2 October | |
| 2009 | |||||
| 2010 | 12 September | 17 September | 10 October | 10 October | |
| 2011 | 08 Nov | 28 Oct | 20 Nov | 06 Nov | |
| Seed rate (kg ha-1 of main field) | 40 | 40 | 40 | 40 | |
| Row spacing (cm) | Random | 22.5 × 22.5 | 20 × 10 | 20 × 10 | |
| Fertilizer use (kg ha-1) 2010 |
|||||
| N-P-K-S-Zn at 0 DAT | 75-50-25-0-0-0 | 75-50-25-0-0-0 | 75-50-25-0-0-0 | 75-50-25-0-0-0 | |
| N top dress | 37.5 at 26 DAT 37.5 at 52 DAT |
37.5 at 26 DAT 37.5 at 52 DAT |
37.5 at 26 DAT 37.5 at 52 DAT |
37.5 at 26 DAT 37.5 at 52 DAT |
|
| K top dress | 25 at 52 DAT | 25 at 52 DAT | 25 at 52 DAT | 25 at 52 DAT | |
| 2011 | |||||
| N-P-K-S-Zn at 0 DAT | 75-50-25-0-0-0 | 75-50-25-0-0-0 | 75-50-25-0-0-0 | 75-50-25-0-0-0 | |
| N top dress | 37.5 at 26 DAT 37.5 at 56 DAT |
37.5 at 26 DAT 37.5 at 56 DAT |
37.5 at 26 DAT 37.5 at 56 DAT |
37.5 at 26 DAT 37.5 at 56 DAT |
|
| K top dress | 25 at 56 DAT | 25 at 56 DAT | 25 at 56 DAT | 25 at 56 DAT | |
| Weed control Pre-emergence herbicide application(0.99 a.i. l ha-1) |
Butachlor | None | Butachlor | Butachlor | |
| Hand weeding(no.) | 15, 30 and 60 DAT |
14 and 25 DAT cono weeder operation was given. 60 DAT hand weeding was done. | If needed hand weeding according to the weed growth. . Glyphosate spray was applied after the crop harvest. | If needed hand weeding according to the weed growth. . Glyphosate spray was applied after the crop harvest. | |
| Insect and disease control Pesticide application 2010 |
Pseudomonas fluorescens @ 400 g/l and Butachlor @ 1 kg/ha and Chlorpyriphos @ 500 ml/ha | Pseudomonas fluorescens @ 400g/ l and Chlorpyriphos @ 500 ml/ha | Pseudomonas fluorescens @ 400 g/l and Butachlor @ 1 kg/ha and Chlorpyriphos @ 500 ml/ha | Pseudomonas fluorescens @ 400 g/l and Butachlor @ 1 kg/ha and Chlorpyriphos @ 500 ml/ha | |
| 2011 | Pseudomonas fluorescens @ 400 g/l and Butachlor @ 1 kg/ha and Chlorpyriphos @ 500 ml/ha | Pseudomonas fluorescens @ 400 g/l and Chlorpyriphos @ 500 ml/ha | Pseudomonas fluorescens @ 400 g/l and Butachlor @ 1 kg/ha and Chlorpyriphos @ 500 ml/ha | Pseudomonas fluorescens @ 400 g/l and Butachlor @ 1 kg/ha and Chlorpyriphos @ 500 ml/ha | |
| Water management | A thin film (just to cover the surface) of water was maintained at the time of planting.For the next 8-10 days, irrigation and drainage of water were alternated to facilitate aeration and adequate moisture for establishment of seedlings.Thereafter, the crop was irrigated to 5 cm depth at required intervals.Irrigation was withheld ten days prior to harvest. | A thin film (just to cover the surface) of water was maintained at the time of planting. Alternate wetting and drying was maintained. .Irrigation was withheld ten days prior to harvest. | A thin film (just to cover the surface) of water was maintained at the time ofplanting. The crop was at required intervals.Irrigation was withheld ten days prior to harvest. | A thin film (just to cover the surface) of water was maintained at the time ofplanting. The crop was at required intervals.Irrigation was withheld ten days prior to harvest. | |
| (b) Summer legume/maize | |||||
| Crop | Fallow | Blackgran | Blackgram | Maize | |
| Cultiver | ADT3 | ADT3 | NK 6240 | ||
| Seeds | Certified seeds | Certified seeds | Certified seeds | ||
| Seed rate (kg ha-1 of main field) | 30 | 30 | 20 | ||
| Sowing | The blackgram was relayed 7-10 days before the harvest of the previous rice crop. | The blackgram was relayed 7-10 days before the harvest of the previous rice crop. | Glyphosate spray (Zero tillage) |
||
| Date sown 2010 2011 2012 |
6Feb 14 Jan 13 Mar |
15 Feb 26 Jan 23 Mar |
15 Feb 1 Mar 4 Apr |
||
| Row spacing (cm) | Random | Random | 60 × 25 | ||
| Fertilizer use (kg ha-1) N-P-K-S-Zn at 0 DAT N top dress |
75-75-37.5-0-0-0 37.5 at 26 DAT 37.5 at 52 DAT |
||||
| K top dress | 37.5 at 52 DAT | ||||
| Weed control Pre-emergence herbicide application(0.99 a.i. l ha-1) |
No treatment | No treatment | Atrazine | ||
| Hand weeding(no.) | No treatment | No treatment | 40-45 DAS | ||
| Insect and disease control Pesticide application |
Pseudomonas fluorescens @ 400 g/l and Butachlor @ 1 kg/ha and Chlorpyriphos @ 500 ml/ha | ||||
| ( C ) Dry season rice/rice/rice/maize | |||||
| Crop | Rice | Rice | Rice | Maize | |
| Cultiver | ADT 43 | ADT43 | ADT43 | NK 6240 | |
| Seeds and seedling nursery management | |||||
| Seeds | Certified seeds | Certified seeds | Certified seeds | Certified seeds | |
| Seed treatment @ 3 g kg-1 seed | Pseudomonas fluorescens 10g/kg of seed | Pseudomonas fluorescens 10g/kg of seed | Pseudomonas fluorescens 10g/kg of seed | No treatment | |
| Seed bed | Flat bed | Dapog nursery | None | None | |
| Seed rate (kg ha-1 of seed bed) | 60 | 60 | 60 | 20 | |
| Land preparation | |||||
| Power tiller | Intially ploughed 6 days before transplanting with a tractor drawn cultivator and then puddled with a tractor drawn cage wheel. The field was leveled with a woodedn plank before layout formation. | Intially ploughed 6 days before transplanting with a tractor drawn cultivator and then puddled with a tractor drawn cage wheel. The field was leveled with a woodedn plank before layout formation | Glyphosate spray (Zero tillage) |
Glyphosate spray (Zero tillage) |
|
| Date sown | 26 May | 16May | 18 May | 18 Jun | |
| 2010 | |||||
| 2011 | 9May | 16 May | 21May | 6 Jul | |
| 2012 | 25 May | 25 May | 17 Jul | 8 Aug | |
| Date transplnted/planted | 15 June | 1 June | |||
| 2009 – 10 | |||||
| 2010 – 11 | 29 May | 31 May | |||
| 2011--12 | 26Jun | 14 Jun | |||
| Seed rate (kg ha-1 of main field) | 60 | 60 | 60 | 20 | |
| Row spacing (cm) | Random | 22.5 × 22.5 | 20 × 10 | 60 × 25 | |
| Fertilizer use (kg ha-1) 2009-10 N-P-K-S-Zn-B at 0 DAT |
75-50-25-0-0-0 | 75-50-25-0-0-0 | 75-50-25-0-0-0 | 75-75-37.5-0-0-0 | |
| N top dress | 37.5 at 26 DAT 37.5 at 47 DAT |
37.5at 26 DAT 37.5at 47 DAT |
37.5at 26 DAT 37.5at 47 DAT |
37.5 at 31 DAT 37.5 at 62 DAT |
|
| K top dress | 25 at 47 DAT | 25 at 47 DAT | 25 at 47 DAT | 37.5 at 62 DAT | |
| 2010 – 2011 | |||||
| N-P-K-S-Zn-B at 0 DAT | 75-50-25-0-0-0 | 75-50-25-0-0-0 | 75-50-25-0-0-0 | 75-75-37.5-0-0-0 | |
| N top dress | 37.5 at 28 DAT 37.5 at 53 DAT |
37.5 at 28 DAT 37.5 at 53 DAT |
37.5 at 28 DAT 37.5 at 53 DAT |
37.5 at 32 DAT 37.5 at 63 DAT |
|
| K top dress | 25 at 53 DAT | 25 at 53 DAT | 25 at 53 DAT | 37.5 at 63 DAT | |
| Weed control Pre-emergence herbicide application(0.99 a.i. l ha-1) |
Butachlor | None | Butachlor | Atrazine | |
| Hand weeding(no.) | 15, 30, and 60 DAT | 14 and 25 DAT cono weeder operation was given. 60 DAT hand weeding was done. | If needed hand weeding according to the weed growth. Glyphosate spray was applied after the crop harvest. | 40-45 DAS | |
| Insect and disease control Pesticide application 2009-10 |
Pseudomonas fluorescens @ 600g/l and Butachlor @ 1 kg/ha and Chlorpyriphos @ 500 ml/ha | Pseudomonas fluorescens @ 600g/l and Chlorpyriphos @ 500 ml/ha | Pseudomonas fluorescens @ 600 g/l and Butachlor @ 1 kg/ha and Chlorpyriphos @ 500 ml/ha | Pseudomonas fluorescens @ 200g/l and Butachlor @ 1 kg/ha | |
| 2010-11 | Pseudomonas fluorescens @ 600g/l and Butachlor @ 1 kg/ha and Chlorpyriphos @ 500 ml/ha | Pseudomonas fluorescens @ 600g/l and Chlorpyriphos @ 500 ml/ha | Pseudomonas fluorescens @ 600g/l and Butachlor @ 1 kg/ha and Chlorpyriphos @ 500 ml/ha | Pseudomonas fluorescens @ 200g/l and Butachlor @ 1 kg/ha | |
| Water management | A thin film of water was maintained at the time of planting. For the next 8-10 days, irrigation and drainage of water were alternated to facilitate and adequate moisture for establishment of seedlings. Thereafter the crop was irrigated at 5cm depth at required intervals. Irrigation was withheld 10 days prior to harvest. | A thin film of water was maintained at the time of planting. Alternate wetting and drying was maintained. Irrigation was withheld 10 days prior to harvest. | A thin film of water was maintained at the time of sowing. The crop was at required intervals. Irrigation was withheld 10 days prior to harvest. | Maize irrigation was applied after every fertilizer application and as required . Optimum moistire availability during the most critical phase (45 to 65 days after sowing) was ensured. | |
Table 3: Field activities and crop management practices for (a) rice and maize in dry season, (b) rice in wet season rice, (c) legue and maize in summer season in different scenarios during 2009-2010, 2010-2011 and 2011-2012.
The best management practices: The BMPs used in this study were (a) improved crop cultivar/variety to fit a given scenario, (b) certified seeds and seed treatment with Pseudomonas fluorescens 10 g/kg of seeds to prevent seed borne diseases, (c) improved raised bed or mat nursery for rice to produce robust, healthy young seedlings, (d) applying adequate nutrients in a nursery to enrich seedlings with nutrients and to minimize transplanting shock, (e ) optimum seedling age for rice (15-20 days both for wet and dry seasons), (f) planting two to three seedlings per hill at 22.5 × 22.5 cm spacing, (g) efficient water management by maintaining a thin film of water at the time of planting and followed by alternate wetting and drying method of water management, (h) cono weeder operation was done at 14 and 25 DAT and hand weeding at 60 DAT both in wet and dry seasons, (i) applying adequate nutrients at the right time and following generic principles of site-specific nutrient management (SSNM), and (j) need based pest management to control pests and diseases. A detailed account of crop management including land preparation, variety, seed rate, sowing time, seed treatment, fertilizer management, water management, and pest management of crops in four scenarios are provided in Table 3.
Soil sampling and analysis
Before imposing the experimental treatments, baseline soil samples were collected from three locations in each of the four grids measuring 20.5 m × 17.5 m in each plot at 0-15 cm and15-30 cm soil depths using an augur of 5 cm diameter. The depth-wise soil samples from each grid cell of a plot were composited, air-dried, ground to pass through a 2 mm sieve and stored in a plastic jar until analysis. The soil samples were analysed for pH, electrical conductivity EC), total carbon (TOC; SSM Analyzer Shimadzu), total N (TN Analyzer Shimadzu), Bray P [36] and 1N neutral NH4OAC-extractable K (by flame emission spec-trophotometer). Particle size distribution was determined by thehydrometer method [37]. The textural class was determined by the United States Department of Agriculture (USDA) System. The soil analysis was conducted at R S Ziegler soil and plant analysis lab at Sardar Vallabhbhai Patel University of Agriculture and Technology, Modipuram.
Data measurement and calculation
The amount of all inputs (seed, herbicides, etc.)and outputs (grain, straw), electrical energy used for irrigation, human labour used in all operations and management practices, input costs and output prices, wage rate for labour and machinery rent were recorded for each plot.
Crop yield estimation
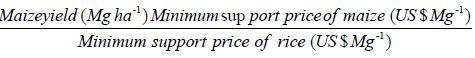
Grain and straw yields of rice, grain and stover yield of maize, grain and shoot yield of blackgram were determined by manually harvesting four areas in each plot at physiological maturity. Each harvest area was 25 m2 for rice and blackgram while 30 m2 for maize. Grain yield of rice, maize and blackgram were adjusted to 14%, 14% and 12% moisture content, respectively. The amount of crop residues retained and incorporated in each season was recorded and reported. All the biomass measured was reported in Mg ha−1. For comparing the productivity of different crops and system productivity of the different scenarios, yield of non-rice crop (legume and maize) was converted into rice equivalent yield (Mg ha−1) using the following equation with maize as an example:
Rice equivalent of maize yield (Mg ha−1) =
Total and specific energy use for crop production
The energy equivalent (MJ unit 1) of each input was used for calculating total energy input. Fuel consumption was recorded during each field operation (tillage, seeding, inter- cultural operations, and harvesting) to calculate the energy consumption [38]. The energy used during irrigation was calculated from the volume of irrigation water applied, depth of irrigation water, and electricity/diesel consumed. The use of other inputs viz., seed, fertilizer, chemicals, human labour, was recorded and energy input was calculated for each operation, including sowing/ transplanting, bund/channel making, irrigation, spraying of herbicides, weeding, top-dressing of fertilizer, harvesting, threshing, and transportation, using the energy equivalents tabulation [38,39]. The specific energy used during each field operation was calculated using the following formula:

Economic analysis
The economic analysis for each scenario used both variable and fixed costs. The variable costs included human labour, tractor use for tillage, and cost of inputs such as seed, fertilizer, pesticide, and irrigation. Fixed costs included land rent, depreciation of machinery, and interest on working capital. The cost of human labour was based on person day’s ha-1. For this purpose, the time used for each activity was recorded in hours and the total person-days (8 h being equivalent to 1 person-day) in the season were calculated. The cost of labour was calculated using the minimum wage rate for the study years as per the Labor Law of the Government of India (minimum wage rate). Similarly, the time (h) required by a tractor-drawn implement to complete the various field operations was recorded, and expressed as h ha-1. The cost of pumping for irrigation was obtained from the Electricity Board of Tamil Nadu, which is a fixed charge per pump per horsepower. Gross returns (GR) for rice, maize, and blackgram were calculated by multiplying the grain yield of crops by the minimum support price offered by the government of India [40-42]. Net returns (NR) were calculated as the difference between gross returns and the total cost of cultivation (NR = GR -TCC). The benefit-cost ratio (BCR) was calculated as the ratio of gross returns (GR) to the total cost of cultivation (TCC) (B:C = GR/TCC). System net returns (SNR) were calculated by adding the net returns of all crops within the 12- month cycle.
Data Analysis
Data were subjected to analysis of variance (ANOVA) using the general linear model (GLM) procedures of the Statistical Analysis System (SAS Institute, 2001). The Tukey protected least significant difference test at P<0.05 level was used to test the differences between the scenario means.
Results and Discussion
Weather
The total amount of rainfall received during the study period (Oct- Sep) was 1367 mm in 2009-10, 1483 mm in 2010-11 and 827 mm in 2011-12 (Figure 1). The rainfall during wet season rice (Oct-Jan) was 893 mm, 917 mm and 586 mm in first, second and third year, respectively. Cauvery Delta Zone receives substantial rainfall during North East Monsoon which is coinciding with key growth stages of wet season rice (October- November). Dry season rice (June-Sep) received rainfall of 372 mm, 426 mm and 205 mm, respectively, in first, second and third year. The rainfall during both wet and dry seasons was not sufficient to grow rice hence the crops largely depended on irrigation from bore wells and or Mettur Dam. Summer (Feb- May) received rainfall of 101 mm, 138 mm and 35 mm in first, second and third year, respectively and hence growing of maize was feasible with supplemental irrigation. The trends of monthly mean minimum and maximum temperature were similar in all three years of experiment.
Crop residue retention
The amount of above ground crop residues retained varied greatly among the four scenarios in all three years of study (Table 4). At the start of study in the first season (wet season, 2009-10), the entire crop residues were removed hence no data are shown. But in subsequent seasons, crop residues were either removed or retained. In S1, all residues were removed at ground level at the harvest of each crop. In S2-S4, where crop residues were retained, either incorporated into the soil (S2) or applied on soil surface as mulch (S3-S4), varied significantly among the scenarios. On a system basis, the total amount of crop residues retained in three years were 13.7, 25.9 and 20.9 Mg ha−1 in S2, S3 and S4, respectively. Overall, the amounts of residues retained in the summer season were higher than in wet and dry seasons which were due to higher residues produced by wet season rice. The amounts of residues retained were higher in S3 than S2 in all three years while residues retained in S4 were on par with S3 in two years. This was because of 70 of machine harvested rice straw were mulched in S3 and S4 against 30 cm of rice straw from ground level were mulched in S2.
| Scenario* | Rice(Wet Season) | Legume/ Maize (summer season) | Rice/ Maize ( dry season) |
System |
|---|---|---|---|---|
| 2009-10 | ||||
| 1 | 0.0 | - | - | - |
| 2 | 0.0 | 1.4 ca | 1.6b aa | 3.0 ca |
| 3 | 0.0 | 3.6 a | 1.2b b | 4.9 a |
| 4 | 0.0 | 3.0 b | 0.6cc | 3.6 b |
| 2010- 11 | ||||
| 1 | - | - | - | - |
| 2 | 1.8 ba | 1.8 b | 2.3b a | 5.9 b |
| 3 | 4.0 a | 4.6 a | 2.0b a | 10.5 a |
| 4 | 1.7c b | 6.1 a | 1.3c a | 9.1 a |
| 2011- 12 | ||||
| 1 | - | - | - | - |
| 2 | 2.3 b | 1.4 b | 1.2b b | 4.8 c |
| 3 | 5.6 a | 4.1 a | 0.8b b | 10.5 a |
| 4 | 2.1 b | 3.8 a | 2.3ca | 8.2 b |
| P (scenario X year) | <.0001 | <.0001 | <.0001 | <.0001 |
* Refer to Tables 2 and 3 for description and details of the treatments.
a For each year, means within a column followed by the same letter are not different at the 0.05% level using Tukey’s t-test.
b Residue retained of legume.
c Residue retained of maize.
Table 4: Scenario wise Residue (Mg ha-1) retained during 2009-10, 2010-11, 2011-12.
Crop and system yield
The rice yields or rice equivalent yields of maize/legume during different seasons are presented in Table 5. The yields of wet season rice were not different in years 1 and 3 except S4 which had lower yield in year 1 and higher yield in year 2 compared to S1 (Table 5). During summer, rice equivalent yield of legume/maize were not different in years 2 and 3 except lower yield in S3 in year 3. In year 1, rice equivalent yield of legume was higher in S2 followed by S3 and S4. Though actual yields of legume were lower than those of maize, rice equivalent legume yields were higher/similar to rice equivalent maize yields [40]. These differences resulted from the differences in economic values of different crops: legumes had higher economic returns ($ 0.64/kg of blackgram in year 1 and 2 and $1.55/kg of blackgram in year 3) then those of maize $ 0.22-0.24/kg ). Also, the maize suffered because of untimely rain in year 1 resulting in lower yield The legume yield in S2 was higher (by 30-69%) than S3 in two out of three years which was due to early sowing and utilization of residual moisture more effectively than S3 [41].
| Scenario* | Rice (Wet Season) Mg ha-1 |
Legume/ Maize (summer season) Mg ha-1 |
Rice/ Maize ( dry season) Mg ha-1 |
System Mg ha-1 |
|---|---|---|---|---|
| 2009-10 | ||||
| 1 | 3.7 aa | - | 3.5 ba | 7.2 aa |
| 2 | 3.5 a | 1.20 (0.4)b a | 4.4 a | 9.2 a |
| 3 | 3.0 ab | 0.90 (0.3)b b | 3.3 b | 7.3 a |
| 4 | 2.5 b | 0.53 (0.5)c c | 1.2 (1.4)c c | 4.3 b |
| 2010- 11 | ||||
| 1 | 2.8 b | - | 4.7 a | 7.5 b |
| 2 | 4.5 ab | 1.6 (0.6)b a | 5.7 a | 11.8 a |
| 3 | 3.8 ab | 1.3 (0.5)b a | 4.7 a | 9.8 a |
| 4 | 5.1 a | 1.0 (1.1)c a | 1.6 (1.8)c b | 7.7 b |
| 2011-12 | ||||
| 1 | 3.0 a | - | 6.4 a | 9.4 b |
| 2 | 3.4 a | 1.4 (0.3)b a | 6.7 a | 11.5 a |
| 3 | 3.4 a | 0.9 (0.2)b b | 5.3 ab | 9.7 ab |
| 4 | 3.1 a | 1.4 (1.9)c a | 4.3 b | 8.9 b |
| P (scenario X year) | 0.0002 | <.0001 | <.0001 | <.0001 |
*Refer to Tables 2 and 3 for description and details of the treatments.
aFor each year, means within a column followed by the same letter are not different at the 0.05% level using Tukey’s t-test.
bActual yield of legume.
cActual yield of maize.
Table 5: Rice equivalent yield under different scenarios for different seasons and on-system basis during 2009-10, 2010-11, 2011-12.
The rice yield or rice equivalent yield of maize in dry season varied significantly among the scenarios in year 1 while it was not significant in year 2 and 3 except S4 which had lower yield than other scenarios. Compared to S1, the rice equivalent maize yield in S4 was lower by 192% and 194% in years 1 and 2, respectively. As indicated earlier the large yield loss of of maize resulted from untimely rain causing continuous soil flooding for an extended period [42]. Whereas in other CSISA platforms, maize performed better in place of rice in rice-wheat cropping systems of north-western Indo-Gangetic plains of India [22] and maize + potato in place of wheat in Eastern Indo-Gangetic Plains of India [43]. This highlights a need of environmental site characterization to achieve full potential of inclusion of non-traditional crops in a crop rotation.
System productivity varied widely among the scenarios from 4.3- 9.2 Mg ha−1, 7.5-11.8 Mg ha−1, and 8.9-11.5 Mg ha−1 in first, second and third year, respectively. S2 had higher system productivity which was on similar with that of S3 in all three years and S1 in year 1. However, system productivity of S1 was lower by 57% and 22% in years 2 and 3, respectively, than S2. Similarly, S1 had 31 % lower system productivity than S3 in year 2. The highest system productivity in S2 (9.2-11.8 Mg ha-1), which was at par with S3 was due to use of BMPs along with partial crop residue retention. Similar finding were reported from Eastern IGP, North western IGP and Central IGP [15,22,43] that integration of BMPs in farmers’ portfolio increased rice yields and system productivity. Replacement of rice with maize in S4 resulted in decrease in system productivity (by 8-53% over S2 and S3), emphasising the importance of environmental and edaphic factors on deciding the crop and cropping rotation.
Labour use
The labour use and labour productivity for different seasons are presented in Table 6. The labour use across the years was higher in S1>S2>S3=S4 in wet season, S4>S2=S3 in summer, and S1>S2>S3>S4 in dry season. At system level, labour use was higher in S2>S1>S3>S4 in years 1 and 2, and S3 had significantly lower labour use in year 3. In wet season, the labour use was lower by 6-11 % in S2, 20-25% in S3 and S4 compared to S1 across the years. Similarly in dry season, labour use was lower by 2-10% in S2, 14-19% in S3 and 23-53% in S4 compared to S1 across the years. The BMPs and CA practices reduced labour use in wet and dry seasons compared to farmers practice. There was no crop in summer in S1 which reduces the labour use at system level; still it was higher than S3 in all three years and S4 in year 1 and 2.
| Labour (md ha-1) | Labour Productivity (kg-1 ha-1 md -1) | ||||||||
|---|---|---|---|---|---|---|---|---|---|
| Scenario* | Rice(Wet Season) md ha-1 |
Legume/ Maize (summer season) md ha-1 |
Rice/ Maize ( dry season) md ha-1 | System md ha-1 |
Rice(Wet Season) (kg-1 ha-1 md -1) |
Legume/ Maize (summer season) (kg-1 ha-1 md -1) |
Rice/ Maize ( dry season)(kg-1 ha-1 md -1) | System (kg-1 ha-1 md -1) |
|
| 2009-10 | |||||||||
| 1 | 221 aa | - | 210 aa | 431 ba | 17 aa | - | 17 bca | 17 aa | |
| 2 | 196 b | 48bb | 205 b | 449 a | 18 a | 8.6b a | 22 a | 19 a | |
| 3 | 165 c | 46b b | 180 c | 391 c | 18 a | 7.0b ab | 18 b | 17 a | |
| 4 | 173 c | 100c a | 100�? d | 373 d | 14 a | 5.0c b | 14c c | 12 b | |
| 2010- 11 | |||||||||
| 1 | 225 a | - | 214 a | 439 a | 12 b | - | 22 ab | 17 b | |
| 2 | 202 b | 44b b | 196 b | 442 a | 22 a | 13b a | 29 a | 25 a | |
| 3 | 171 c | 44b b | 180 c | 395 b | 22 a | 11b a | 26 ab | 23 ab | |
| 4 | 169 c | 98ca | 100c d | 367 c | 30 a | 11c a | 18c b | 22 ab | |
| 2011- 12 | |||||||||
| 1 | 213 a | - | 220 a | 433 b | 14 b | - | 29 a | 22 a | |
| 2 | 201 b | 33b b | 200 b | 434 ab | 17 ab | 9b b | 33 a | 24 a | |
| 3 | 170 c | 31b b | 178 c | 379 c | 20 a | 6b b | 30 a | 24 a | |
| 4 | 167 c | 100c a | 170 d | 437 a | 19 a | 19ca | 25 a | 21 a | |
| P (scenario X year) | <.0001 | <.0001 | <.0001 | <.0001 | |||||
* Refer to Tables 2 and 3 for description and details of the treatments.
aRefers to a column for each year followed by the same letter are not different at 0.05% level using Tukey’s t-test test.
bValue is for legume
cValue is for maize
Table 6: Scenario wise labor use (md ha-1) and Labor productivity (kg-1 ha-1 md -1) for each crop and cropping system during 2009-2010, 2010-2011 and 2011-2012.
The labour productivity was not significant among the scenarios in wet season in all three years except S1 in years 2 and 3. The labour productivity of S1 was lower by 83% than S2-S3 and 150% than S4 in year 2. In year 3, S1 had 43% and 36% lower labour productivity than S3 and S4, respectively. In summer, labour productivity was not significant among the scenarios except higher labour productivity in S3 in year 3. In dry season, S2 had higher labour productivity compared to other scenarios in year 1 while it was not significant in year 2 and 3, except with S4 in year 2. At system level, there was no significant difference on labour productivity among the scenarios across the years except S4 in year 1. S1 had lower system labour productivity by 47% than S2 in year 2.
Energy inputs and efficiency
Total energy inputs varied greatly among the scenarios in all the seasons and system level (Table 7). Total energy consumption was higher in S1>S2>S3=S4 in years 1 and 2, and S1=S2>S3=S4 in year 3 both in dry and wet seasons. Whereas in summer, S4 had higher energy consumption (maize) compared to S2 and S3 (legumes) across the years. During wet season, the total energy consumption was lower by 5-8% in S2, 21-33% in S3 and 21-38% in S4 compared to S1 across the years. Similarly, in dry season, the total energy consumption was lower by 8-15% in S2, 25-45% in S3 and 25-46% in S4 than S1. At system level, total energy used was higher in S1 followed by S2>S4>S3 in year 1 and 2. Whereas in year 3, S4 had higher energy consumption followed by S1=S2>S3. Farmers practice consumed higher energy in two out of three years though there was no crop during summer. The results indicate that S3 had lower total energy consumption in all the seasons and system level because of adoption of conservation agricultural practices such as reduced tillage.
| Scenario* | Wet Season | Summer Season | Dry Season | System | ||||
|---|---|---|---|---|---|---|---|---|
| 2009-10 | ||||||||
| Total energy | Specific energy | Total energy | Specific energy | Total energy | Specific energy | Total energy | Specific energy | |
| 1 | 24 aa | 6.4 aa | - | - | 26 aa | 7.5 ba | 49 aa | 6.9 ba |
| 2 | 22 b | 6.2 a | 0.7bc | 1.8b b | 22 b | 5.1 c | 45 b | 5.4 c |
| 3 | 16 c | 5.2 a | 1.0bb | 3.0b b | 15 c | 4.4 c | 31 d | 4.7 c |
| 4 | 15 c | 6.2 a | 13c a | 25.6ca | 14c c | 9.7c a | 42 c | 9.5 a |
| 2010- 11 | ||||||||
| 1 | 21 a | 7.8 a | - | - | 24 a | 5.1 ab | 45 a | 6.1 a |
| 2 | 20 b | 4.6 ab | 0.7bc | 1.2bb | 22 b | 4.0 b | 43 b | 4.0 c |
| 3 | 14 c | 3.9 b | 1.0b b | 1.9bb | 13 c | 2.9 b | 29 c | 3.2 d |
| 4 | 15 c | 3.0 b | 14c a | 29.9ca | 13cc | 7.9ca | 43 b | 5.4 b |
| 2011- 12 | ||||||||
| 1 | 19 a | 6.6 a | - | - | 20 a | 3.1 a | 39 b | 4.2 ab |
| 2 | 20 a | 5.7 ab | 0.7b b | 2.2bb | 20 a | 3.0 a | 40 b | 3.9 b |
| 3 | 15 b | 4.5 b | 0.7b b | 3.3bb | 15 b | 2.8 a | 31 c | 3.5 b |
| 4 | 15 b | 4.9 b | 17ca | 9.2c a | 15 b | 3.5 a | 47 a | 5.1 a |
| P (scenario X year) | <.0001 | <.0001 | <.0001 | 0.0175 | <.0001 | <.0001 | <.0001 | 0.0033 |
*Refer to Tables 2 and 3 for description and details of the treatments.
aMeans within a column followed by the same letter are not different at the 0.05% level using Tukey’s t-test.
bValue is for legume
cValue is for maize
Table 7: Total energy input (GJ ha-1) and the Specific energy (MJ kg grain-1) in different scenarios during 2009-10, 2010-11 and 2011-12.
With respect to specific energy use in wet season, there was no significant difference among the scenarios across the years except S1 which had higher energy use than S3 & S4 in years 2 and 3. In contrast, the specific energy usage was higher in S4 (maize) compared to S2- S3 (legumes) in summer. Similarly, in dry season, specific energy use was higher in S4 (maize) compared to rice in S1-S3 in years 1 and 2 while there was no significant difference among the scenarios in year 3. Maize in dry season had lower total energy but higher specific energy compared to rice in the same season. At system level, either S4 or S1 had higher specific energy consumption while S3 had lower specific energy across the years. The reason for higher specific energy use was conventional farmer’s practices in S1 and growing of maize during summer in S4. In contrast, BMP in S2 led to less use of specific energy and BMP along with CA practices in S3 led to further reduction in use of specific energy compared to farmers practice (S1) which was due to conventional method of land preparation and crop establishment. Higher specific energy was recorded in farmer’s practice of growing rice in Bangladesh [35]. Our results indicate that the integration of BMPs and CA practices had potential to save input energy by making rice production environmental friendly.
Economic analysis
The total variable costs varied significantly among the scenarios across the years in all the seasons (Table 8). In wet season, farmers practice (S1) had higher variable costs than other scenarios, and the costs trend were S1>S3>S4>S2. Reducing the production costs is as much as important as increasing the net profits for small farmers because of increased costs of production and crop failure due to climate change which may push them into vicious cycle of poverty. Tillage and crop establishment are major part (15-16%) of total production costs [44]. The result from our experiment shows that BMP and CA reduced the total variable costs by 11-33% in dry season and 3-15% in wet season compared to farmers practice. Further costs reduction (19-33%) was recorded when maize were grown in S4. Total variable costs at system level were higher in S4>S3>S1>S2 in year 1 and 2, and S4>S1>S3>S2 in year 3. Since S1 had no crop during summer, it resulted into lower costs at system level than S4 and S3. BMP and CA practices reduced costs of production in IGP of India [22]. Direct seeding under zero tillage reduced the costs by 40-50% in Eastern IGP of India [43], ZT in wheat reduced costs, labour and fuel [27,45].
Gross economic returns during wet season rice did not vary among the scenarios in years 2 and 3, and only S4 had significant difference with S1 and S2 in year 1. Similarly, net economic returns did not vary except S4 in year 1 and S1 in year 3. BCR follows the similar trend and did not vary greatly among the scenario except lower BCR in S4 in year 1. The lower gross and net returns in S4 was due to lower yield compared to other scenarios despite it had lower total variable cost. The adoption of BMPs and CA in wet season did not increase the net profit except reducing the total variable costs, unlike in other platforms where increased net profit were recorded due to increased yield [22,35,43].
Gross returns in summer were higher in S4 in year 1, but it was similar with S2 in year 3 and scenarios remained unchanged in year 2. Net returns were similar between S2 and S3 (legumes) in years 1 and 2 but S2 had higher returns in year 3. The low yield of maize due to water logging and higher variable costs were the reasons for lower net returns and BCR in addition to lower economic value of maize compared to legumes.
Gross returns in dry season were significantly higher in S2 in all three years but it was similar with S1 in year 1 and those with S1 and S3 in year 3. In dry season, S4 had lower returns in years 1 and 2 mainly due to the poor performance of maize but rice in year 3 produced comparable net returns with S1 and S3. Only S2 had higher net returns (71-100%) in two out of three years compared to farmers practice (S1) in dry season. BCR followed trend similar to that of net returns in dry season. The lower yield in S4 was the reason for lower returns and yield has to be increased to harness the benefits of CA in S3 and S4. Whereas in other platforms, net returns were higher in S3 and S4 due to combined effect of increased yield and reduced costs [22,43].
At system level, gross returns in S1 were not significant with other scenarios in years 1 and 3. However, in year 2, S2 and S3 had higher gross returns by 54% and 27%, respectively, than S1. Similarly, net returns in S1 were not significant with other scenarios across the years except S2 in year 2 and 3. S2 had higher net returns by 166% in year 2 and 86% in year 3 compared to S1. However, CA practices were able to achieve the similar net returns of farmer’s practices with less energy, labour and costs. Similar results from Bangladesh that integration of BMP and CA practices increased the economic returns of the rice–rice system by 1.8–3.0 times [35] and BMP practices increased economics in other rice growing areas as well [22,26,43].
Conclusion
Tamil Nadu is the 7th largest rice producing states in India. Green revolution transformed the irrigated areas into intensive rice based with double or triple rice crops in a year which contributes substantial share in state food grain production. However, rice based cropping systems are threatened by yield stagnation, scarcities of water and labour, increased costs of cultivation, soil fertility degradation, and uncertainty in availability of water through canal. Hence, integrating the best management practices (BMP) along with conservation agricultural technologies is needed for improving the system productivity and resource use efficiency of rice based system. This study investigated four scenarios involving farmer’s practices, best management and conservation agricultural practices with diversified cropping patterns for three years. The key parameters tested were individual crop yields, system productivity, labour and energy use efficiency, and economics. Scenario 1 (S1), farmer’s practices, was used as the baseline to compare S2-S4 comprising BMP and suitable conservation agricultural practices. On an annual system basis, best management practices produces 22-57% higher rice equivalent yield with less use of labour, energy and inputs than farmers practice. Similarly, adoption of BMP with CA reduced labour, inputs and energy with marginal increase in yield and net returns compared to farmers practice. On the other hand, introducing maize in place of rice in the diversified scenario had not increased either system yields or economic returns due to low yield of maize in dry season. This study concluded that productivity and economic returns of rice based cropping systems can be increased by adopting best management and conservation agricultural practices in Cauvery Delta Zone of Tamil Nadu. However, selection of alternative crops/management practices is crucial and thus need more medium to long-term adaptive system research to identify compatible alternative crops/management practices to diversify the food production and increase the systems productivity while conserving the natural resources.
Acknowledgments
We acknowledge the Bill and Melinda Gates Foundation (BMGF) and United States Agency for International Development (USAID) for their funding this research through a project titled “Cereal Systems Initiative for South Asia” (CSISA). We are grateful to Tamil Nadu Rice Research Institute, Tamil Nadu Agricultural University, for providing experimental land and other key inputs for conducting the Experiment.
References
- Alexandratos N, Bruinsma J (2012) World agriculture towards 2030/2050: The 2012 revision. ESA Working paper.
- Idso CD (2011) Estimates of global food production in the year 2050,will we produce enough to adequately feed the world?Center for the Study of CarbonDioxide and Global Change.
- Cassman KG, Dobbermann A (2001) Evolving rice production systems to meet global demand. Rice Research and Production in the 21st century: Proceedings of a symposium.
- Dawe D, Dobbermann A (1999) Defining productivity and yield. IRRI Discussion Papers Series No. 33.International Rice Research Institute, Makati City, Philippines.
- Ladha JK, Dawe D, Pathak H, Padre AT, Yadav R, et al. (2003) How extensive are yield declines in long-term rice-wheat experiments in Asia. Field Crops Res 81: 159-180.
- http://eands.dacnet.nic.in/PDF/Agricultural-Statistics-At-Glance2014.pdf
- Senthilkumar K, Ramasamy S, Thiyagarajan TM (2007) Effect of younger seedlings/direct wet seeding over conventional transplanting in lowland hybrid rice. Madras Agric J 94: 212-217.
- Crop report (2011) Season and crop report for Tamil Nadu.
- Anonymous (2015) Cauvery delta zone-status paper.
- Balasubramanian V, Adhya TK, Ladha JK (2012) Enhancing eco-efficiency in the intensive cereal-based systems of the Indo-Gangetic Plains. Issues in Tropical agriculture eco-efficiency: from vision to reality. CIAT Publication, Cali, CO.
- Laborte AG, deBie KC, Smaling EM, Moya PF, Boling A, et al. (2012) Rice yields and yield gaps in Southeast Asia: Past trends and future outlook.European Journal of Agronomy 36: 9-20.
- Dawe D, Dobermann A, Moya P, Abdulrachman S, Singh B, et al. (2000) How widespread are yield declines in long-term rice experiments in Asia? Field Crops Res 66:175-193.
- Pathak H, Ladha JK, Aggarwal PK, Peng S, Das S, et al.(2003) Trends of climatic potential and on-farm yields of rice and wheat in the Indo-Gangetic Plains. Field Crops Res 80: 223-234.
- Tirol�?�Padre A, Rai M, Gathala M, Sharma S, Kumar V, et al. (2014) Assessing the performance of the photo�?�acoustic infrared gas monitor for measuring CO2, N2O, and CH4 fluxes in two major cereal rotations. Glob Chang Biol20: 287-299.
- Ladha JK, Kumar V, Amal MM, Sharma S, Gathala M, et al. (2009) Integrating crop and resource management technologies for enhanced productivity, profitability and sustainability of the rice-wheat system in South Asia. In: Ladha JK, Singh Y, Erenstein O, Hardy B (eds.) Integrated Crop and Resource Management in the Rice-What system of South Asia, International Rice Research institute, Los Banos, Philippines. pp: 69-108.
- Gujja B, Thiyagarajan TM (2009) Newhope for Indian food security? The System of Rice Intensification.International Institute for Environment and Development, London, UK.
- CassmanKG (1999) Ecological intensification of cereal production systems: yield potential, soil quantity, and precision agriculture. ProcNatlAcadSciUSA96: 5952-5959.
- Chaudhary RC (2000) Strategies for bridging the yield gap in rice: A regional perspective. In: Papademetriou MK, Dent FJ, Herath EM (eds.) Bridging the Rice Yield Gap in the Asia-Pacific Region. UN FAO, Bangkok. pp: 201-214.
- Sanchez PA (1973) Puddling tropical rice soils: 2. Effects of water losses.Soil Science115: 303-308.
- Sharma PK, Ladha JK, Bhushan L (2003) Soil physical effects of puddling in rice–wheat cropping systems. In: LadhaJK, Hill JE, Duxbury JM, Gupta RK, Buresh RJ (eds.) Improving the Productivity and Sustainability of Rice–Wheat Systems: Issues and Impacts. ASA CSSA and SSA, Madison, WI.pp: 97-113.
- Kumar V, Ladha JK (2011) Direct seeding of rice: recent developments and future research needs. AdvAgron111: 297-313.
- Gathala MK, Kumar V, Sharma PC, Saharawat YS, Jat HS, et al. (2013) Optimizing intensive cereal based cropping system addressing current and future drivers of agricultural change in the north western Indo-Gangetic Plains of India. AgricEcosystEnviron177: 85-97.
- Alberto MCR, Wassmann R, Hirano T, Miyata A, Kumar A, et al. (2009) CO2/heat fluxes in rice fields: comparative assessment of flooded and non-flooded fields in the Philippines. Agr Forest Meteorol149:1737-1750.
- Mosier A, Kroeze C, Nevison C, Oenema O, Seitzinger S, et al. (1998) Closing the global N2O budget: nitrous oxide emissions through the agricultural nitrogen cycle. NutrCyclAgroecosys52: 225-248.
- Jat ML, Gathala MK, Ladha JK, Saharawat YS, Jat AS, et al. (2009) Evaluation of precision land leveling and double zero-till systems in the rice–wheat rotation: water use, productivity, profitability and soil physical properties. Soil Tillage Res105: 112-121.
- Saharawat YS, Singh B, Malik RK, Ladha JK, Gathala M, et al. (2010) Evaluation of alternative tillage and crop establishment methods in a rice–wheat rotation in North Western IGP. Field Crop Res 116:260-267.
- Bhushan L, Ladha JK, Gupta RK, Singh S, Tirol-Padre A, et al. (2007) Saving of water and labor in a rice–wheat system with no-tillage and direct seeding technologies. Agron J 99:1288-1296.
- Liu H, Hussain S, Zheng M, Peng S, Huang J, et al. (2015)Dry direct-seeded rice as an alternative totransplanted-flooded rice in Central China. Agron Sustainable Dev35:285-294.
- Singh Y, Singh G, Johnson D, Mortimer M (2005) Changing from transplanted rice to direct seeding in the rice–wheat cropping system in India. Rice is Life: Scientific Perspectives for the 21st Century.Proceedings of the World Rice Research Conference, Tsukuba, Japan.pp: 198-201.
- Farooq M, Basra SMA, Ahmad N, Murtaza G (2009) Enhancing the performance of transplanted coarse rice by seed priming. Paddy Water Environ 7: 55-63.
- Humphreys E, Roth CH (2008) Permanent beds and riceresidue management for rice–wheat systems in the IndoGangetic Plain. Proceedings of a workshop held in Ludhiana, India, 7–9 September 2006. ACIAR Proceedings No. 127.pp: 192.
- Shan YH, Johnson-Beebout SE, Buresh RJ (2008) Crop residue management for lowland rice-based cropping systems in Asia. AdvAgron98: 117-199.
- Bijay-Singh SYH, Johnson-Beebout SE, Yadvinder-Singh BRJ (2008) Crop residue management for lowland rice-based cropping systems in Asia. AdvAgron 98:117-199.
- Timsina J, Jat ML, Majumdar K (2010) Rice-maize systems of South Asia: current status, future prospects and research priorities for nutrient management. Plant Soil 335: 65-82.
- Alam MM, Ladha JK, Faisal MW, Sharma S, Saha A, et al. (2015) Improvement of cereal-based cropping systems following the principles of conservation agriculture under changing agricultural scenarios in Bangladesh. Field Crop Res 175: 1-15.
- Bray HR, Kurtz LT (1945) Determination of total, organic, and available forms of phosphorus in soils. Soil Sci 59:39-45.
- Bouyoucos GJ (1962) Hydrometer method improved for making particle size analysis of soils. Agron J 54: 464-465.
- Shahin S, Jafari A, Mobli H, Rafiee S, Karini M (2008) Effect of farm size on energy ratio on wheat production: a case study from Ardabil province of Iran. AmEurasian JAgricEnvironSci3: 604-608.
- Kumar V, Saharawat YS, Gathala MK, Jat AS, Singh SK, et al. (2013) Effect of different tillage and seeding methods on energy use efficiency and productivity of wheat in the Indo-Gangetic Plains. Field Crop Res 142: 1-8.
- Economic Survey of India (2009) Union Budget and Economic Survey. Ministry of Finance, Government of India, New Delhi.
- Economic Survey of India (2010) Union Budget and Economic Survey. Ministry of Finance, Government of India, New Delhi.
- Economic Survey of India (2011) Union Budget and Economic Survey. Ministry of Finance, Government of India, New Delhi.
- . Laik R, Sharma S, Idris M, Singh AK, Singh SS, et al. (2014) Integration of conservation agriculture with best management practices for improving system performance of the rice–wheat rotation in the Eastern Indo-Gangetic Plains of India. AgricEcosyst Environ 195:68-82.
- Erenstein O, Laxmi V (2008) Zero tillage impacts in India’s rice–wheat systems: a review. Soil Tillage Res 100: 1-14.
- Gathala MK, Timsina J, Islam MS, Rahman MM, Hossain MI, et al. (2015) Conservation agriculture based tillage and crop establishment options can maintain farmers’ yields and increase profits in South Asia's rice–maize systems: Evidence from Bangladesh. Field Crop Res 172: 85-98.
Relevant Topics
- Aquatic Ecosystems
- Biodiversity
- Conservation Biology
- Coral Reef Ecology
- Distribution Aggregation
- Ecology and Migration of Animal
- Ecosystem Service
- Ecosystem-Level Measuring
- Endangered Species
- Environmental Tourism
- Forest Biome
- Lake Circulation
- Leaf Morphology
- Marine Conservation
- Marine Ecosystems
- Phytoplankton Abundance
- Population Dyanamics
- Semiarid Ecosystem Soil Properties
- Spatial Distribution
- Species Composition
- Species Rarity
- Sustainability Dynamics
- Sustainable Forest Management
- Tropical Aquaculture
- Tropical Ecosystems
Recommended Journals
Article Tools
Article Usage
- Total views: 11779
- [From(publication date):
December-2016 - Mar 31, 2025] - Breakdown by view type
- HTML page views : 10800
- PDF downloads : 979