Research Article Open Access
Impact of Menu Labeling on Food Choices of Southern Undergraduate Students
| Amber Prins, Dana Gonzales, Tina Crook and Reza Hakkak* | |
| Department of Dietetics and Nutrition, University of Arkansas for Medical Sciences, 4301 West Markham Street, Arkansas, USA | |
| Corresponding Author : | Dr. Reza Hakkak Department of Dietetics and Nutrition 4301 West Markham St. Slot #627 Little Rock, Arkansas, USA E-mail: hakkakreza@uams.edu |
| Received October 19, 2012; Accepted November 19, 2012; Published November 21, 2012 | |
| Citation: Prins A, Gonzales D, Crook T, Hakkak R (2012) Impact of Menu Labeling on Food Choices of Southern Undergraduate Students. J Obes Wt Loss Ther S4:001. doi:10.4172/2165-7904.S4-001 | |
| Copyright: © 2012 Prins A, et al. This is an open-access article distributed under the terms of the Creative Commons Attribution License, which permits unrestricted use, distribution, and reproduction in any medium, provided the original author and source are credited. | |
Visit for more related articles at Journal of Obesity & Weight Loss Therapy
Abstract
Americans consume more meals away from home at fast-food and dine-in restaurants. The restaurant foods are notorious for their energy density and large portion sizes. The objective of our study was to determine whether or not the addition of calorie information to a restaurant menu affects the calorie content of meals ordered by college students. Study participants were selected from a random sample of 1,025 undergraduate students (≥ 18 years old). Data analyses included descriptive statistics and both paired-samples and independent-samples t-tests. Our data analysis found a significant difference between the number of calories chosen from the first menu (without calorie labels) versus the second menu (with calorie labels) (p=0.001, 2-tailed). Analysis also showed that there was no significant difference in calories ordered from the first menu versus the second menu for those who had taken a college-level nutrition class and those who had not (p=0.051, 2-tailed). Our findings suggest that menu calorie labels can positively affect college students’ meal selections making them lower in calories; however, no particular group of students was more likely than any other to change their menu selections after seeing the calorie labels. Further research is needed to determine if use of calorie labels will decrease the number of calories ordered at fast-food and dine-in restaurants among other populations.
| Keywords |
| Menu labeling; Nutrition information; Calorie labeling; Fast-food; Restaurant; College students |
| Abbreviations |
| CDC: Centers for Disease Control and Prevention; BMI: Body Mass Index; NLEA: Nutrition Labeling and Education Act; IRB: Institutional Review Board; UAMS: University of Arkansas for Medical Sciences; SPSS: Statistical Package for the Social Sciences |
| Introduction |
| The rate of overweight and obesity has drastically increased over the past two decades. Recent obesity statistics from the National Health and Nutrition Examination Survey (NHANES) captured by the Centers for Disease Control and Prevention (CDC) in 2009-2010 indicate that approximately 68.8% of American adults are either overweight or obese, with 35.7% of them being obese [1]. As the rate of overweight and obesity continues to rise steadily with no end in sight, the government is charged with the task of devising strategies to hamper the epidemic. With the passage of the Nutrition Labeling and Education Act (NLEA) in 1990, all foods purchased in stores were required to list nutrition information on the packages in a standard format-a law implemented for the purpose of creating informed consumers who make healthier choices based on their knowledge of the nutritional content of the foods on store shelves [2]. This law, however, did not have the anticipated impact on overweight and obesity rates-partially because Americans are consuming more and more meals away from home at fast-food and dine-in restaurants [3]. |
| The term “menu labeling” refers to the listing of nutrition information next to each food item on restaurant menus, menu boards, and drive-through menu boards so it can be viewed and considered by customers when making their food selections [4]. According to the Patient Protection and Affordable Care Act of 2010, Section 4205, restaurant chains with 20 or more establishments of the same name will be required to disclose nutrition information for their menu items on the menu or menu board [5]. This nutrition information, at minimum, must include calories [5] but can list further information including, but not limited to, total fat, saturated fat, carbohydrates, sodium, protein, and fiber. If not disclosed on the menu, the additional nutrition information beyond calories must be made available to customers in written form upon request [6]. In addition to the calorie labels, menus must also contain a statement specifying the recommended daily caloric intake for one day for the average American-2000 caloriesenabling customers to put the calorie labels of individual food items into context of a total daily caloric intake [5]. |
| Restaurant foods are notorious for their energy density and large portion sizes-undoubtedly contributing to the undesirable weight status of a majority of Americans. Studies show that on average, foods prepared and eaten outside the home consist of large portion sizes and have high energy density with little nutritional value and low satiating power [7,8]. |
| Some chain restaurants currently offer nutrition information in the form of tray liners, pamphlets, posters, charts, on-site computers [9,10] or on food containers or napkins, depending on the restaurant. Most restaurants offer the information online, but not necessarily at the point-of-service [11]. |
| Research has shown the difficulty of estimating the number of calories and other determinants of nutritional quality in restaurant foods based on seeing the food alone. Studies demonstrate that the lay consumer significantly underestimates calories, fat, and saturated fat in restaurant meals [12-17]. Only 15% of consumers in New York City were correctly able to estimate (within 100 calories) the number of calories in their fast-food meal. Results from Burton et al. revealed an average of 900 extra calories per week were being unintentionally consumed by participants who continually underestimated the calories in their restaurant meals-an amount likely capable of causing weight gain over time [13]. One study pointed out that the result of a consumer underestimating a meal by 600 calories only once per week leads to an added intake of approximately 30,000 calories in one year, which equals approximately 9 pounds of body fat if all other factors (i.e. physical activity) remain the same [16]. |
| Several studies have investigated the effectiveness of the law in states and localities where menu labeling is already in place as well as the anticipated effects of the menu calorie labels that will soon be required nationally. Various methods have been utilized to collect the data with results spread across the board. Studies have shown that the majority of consumers support the menu labels [18-21]; however, whether or not they will actually use them to decrease the caloric content of their restaurant meals is more controversial. |
| Studies conducted in college dining halls have had generally consistent results-a moderate number of college students want nutrition information available and/or use posted nutrition information to make lower-calorie meal selections [22-26]. One study reported two-thirds of the freshman respondents were aware of the food labels in the dining hall, while one-third actually used them to make meal selections (actual change in calories purchased was not measured) [23]. This study, like others [27,28], demonstrated a greater female than male use of food labels. Another study in a Mid-western college dining hall tested the implementation of fat labels rather than calorie labels, with a resulting reduction of 16.4% in the amount of fat purchased [24]. In another Mid-western college dining hall, 80% reported “sometimes” changing their ordering habits and 12% reported “nearly always” changing their ordering habits based on “Nutrition Bytes” food labels displayed in the dining hall [25]. However, a two-week study of British college students who dined in a campus cafeteria demonstrated that the food labels displayed in week two of the study had no positive effect on menu ordering when compared to week one (no food labels), and actually had a negative effect on both males and unrestrained eaters who actually consumed more calories in week two [29]. |
| Few studies on menu calorie labeling have been done using college students in the southern region; therefore, the objective of this study was to measure the potential effectiveness of calorie labeling among college students. |
| Materials and Methods |
| Experimental design |
| Study participants were undergraduate college students. Inclusion criteria included age ≥ 18 years and current enrollment status. A link to a web-based survey on Survey Monkey (an online survey program; Menlo Park, California) was send with a brief informational email regarding the study to a random sample of 1,025 students. This study was approved by the Institutional Review Boards (IRB) at both the University of Arkansas for Medical Sciences (UAMS) and the college from which students were recruited. The investigator had no access to names or other individual identifiers; all participants remained completely anonymous. The survey remained open for two weeks. Informed consent was obtained electronically at the beginning of the survey. |
| The survey contained two fast-food sandwich restaurant menus along with two sets of instructions-one set immediately before viewing the first menu and a second set before viewing the second menu. The first menu viewed by the participants was a regular menu containing sandwich, side dish, and beverage selections from which students were instructed to make selections as if they were actually dining at that restaurant. After each sandwich name, a description was included (e.g. Turkey Breast: wheat bread, turkey, vegetables of choice). Each sandwich was offered in either 6-inch or 12-inch size, with two or three additional options for each size (e.g. plain, with cheese, and/or with cheese and mayo). After making selections from the first menu, students were instructed to make selections from a second menu that was identical to the first with the addition of calorie information next to each menu option. The second menu also contained a calorie claim stating, “The recommended daily caloric intake for an average adult is 2,000 calories; individual needs may vary.” Nutrition information and sandwich descriptions for sandwiches, side dishes, and beverages were based on the nutrition information provided on Subway’s corporate website [30]. |
| Following meal selections from both menus, students were instructed to complete a survey pertaining to the menus and the selections they made. Survey questions were developed independently after reviewing current research. The survey consisted of 18 questions-nine yes/no, one ranking, one Likert scale [31,32], three multiple choice, and four demographic questions. |
| Content validity for both survey and accompanying menus was established using face validity field testing. After development of the online survey, the link to the survey was emailed to the field test participants along with instructions for completing the field test. Field test participants provided feedback on the menus, survey questions, and clarity of the instructions for completion of the survey. Feedback from the field test was used for survey revision. The field test participants where not be eligible for the actual study. |
| Statistical analysis |
| A paired-samples t-test was conducted to evaluate the calorie content of the meal choices from the first menu versus the second menu. Further analysis using independent-samples t-tests was conducted to measure difference in calories ordered versus both age group and college major. Another independen t-samples t-test was used to evaluate the difference in calories ordered from the first menu versus the second menu and whether or not the respondent had taken a college-level nutrition class. Descriptive statistics were used to quantify the frequency of fast-food consumption, whether respondents would use the calorie information for meal selection if it were available on restaurant menus, the change(s) made by those who chose differently on the second menu, as well as age, gender, race/ethnicity, college major, etc. Means were compared to determine the order of importance of four factors involved in making food selections at restaurants. The software used to analyze the data was Statistical Package for the Social Sciences (SPSS) Student Version 20 (SPSS Inc., Chicago, Illinois). A significance level of P<0.05 was used to determine whether to accept or reject the null hypotheses. |
| Results |
| Descriptive statistics included age, race/ethnicity, gender, college major, and whether or not the student had taken a college-level nutrition class. Of the 1,025 students who received the invitational e-mail, 70 responded and 91% of those students completed the entire survey (n=64). The responses from the six students who did not complete the entire survey were excluded from the analysis. The mean age (n=64) was 28.65 (range=18-61 years old), with 56% falling in the 18-24 and 44% in the ≥ 25 year old age groups. Two age groups were formed in order to compare traditional (18-24 year old) versus non-traditional (≥ 25 year old) college students’ attitudes toward menu labeling. Female respondents made up 80% (n=51) while the male response rate was 20% (n=13). Health and behavioral sciences majors totaled 45% (n=29) followed by 19% business, 11% undecided/other, 8% science/mathematics, 8% education, 6% liberal arts, and 3% fine arts/communication. This demographic information is presented in table 1. |
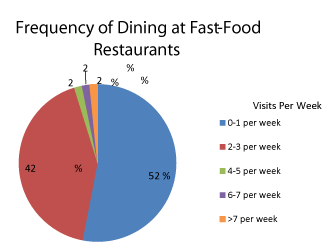
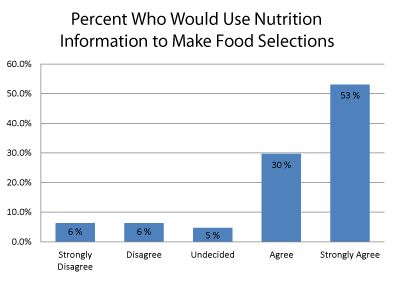
| The majority of respondents, 53% (n=34), ate at fast-food restaurants 0-1 time per week, 42% (n=27) 2-3 times per week, and 2% (n=1) in each of the remaining categories of 4-5, 6-7, and > 7 times per week (Table 1) (Chart 1). Fifty-three percent (n=34) strongly agreed that they would use nutrition information to make menu selections if it was provided on restaurant menus; thirty percent (n=19) agreed, 6% (n=4) disagreed, 6% (n=4) strongly disagreed, and 5% (n=3) were undecided on this question (Table 2; Chart 2). |
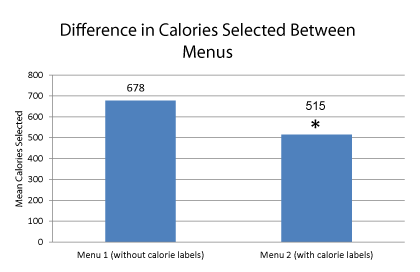
| A paired-samples t-test was used to compare calories chosen from the first menu (without calorie labels) versus calories chosen from the second menu (with calorie labels). Of those who completed the survey, 44% (n=28) correctly completed the menu selection portion of the survey. The remaining respondents (n=36) did not correctly complete the menu selection portion of the survey and were excluded from this portion of the data analysis. There was a statistically significant difference (p<0.001) in calories chosen from the first menu (M ± SD, 678.39 ± 303.35) that did not contain calorie information versus the second menu (515.00 ± 203.47) that did contain calorie information resulting in less calories chosen when the calorie information was present (Table 3; Chart 3). |
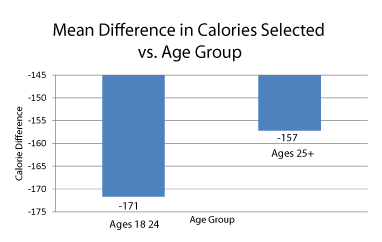
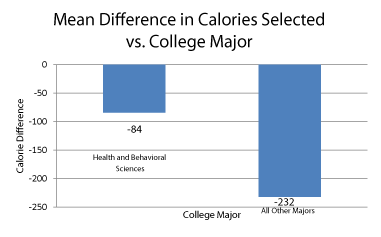
| An independent samples t-test was performed to compare calories chosen between the two age groups. There was no significant difference in calorie chosen for students 18-24 years (M ± SD, -171.67 ± 277.58) and students >25 years (M ± SD, -157.19 ± 211.98) t (26)=-157, p=0.877. A second independent-samples t-test was performed to evaluate the difference in calories chosen versus college major. Similarly, no significant difference in calories was chosen by health and behavioral sciences majors (M ± SD, -84.23 ± 137.38) and all other majors (M ± SD, -232 ± 285.91), t(20.74)=1.779, p=0.09. The results of these t-tests are summarized in table 4 and charts 4 and 5. |
| Discussion |
| In this study, 83% of respondents either agreed or strongly agreed that they would use nutrition information to make food selections if it was provided on restaurant menus (Table 2; Chart 2). In support of our study, other investigators have reported similar findings backing menu labeling [22-24,27,33-35]; one of those studies reported findings similar to those in this study with 90% of the respondents reporting they would use nutrition information if it was available on restaurant menus [33]. |
| Our results show a significant difference (p<0.001) between calories selected for one full meal from a menu without calories versus a menu with calories; less calories were chosen when the menu labels were present on the menu (Table 3; Chart 3). Additionally, our results show that 57% (n=16) of respondents changed the number of calories ordered after seeing the menu that contained calorie labels, which is consistent with the main intent of the menu labeling legislation. Although three of these respondents stated they made no changes after viewing the calorie labels, they actually did make changes to their menu selections (two decreased while one increased the caloric content of their second meal selections); these respondents were included in the data analysis. Our significant results are similar to those from eight other studies [24,25,36-39] including Yamamoto et al., which showed 29% of the study sample changed their order after viewing the calorie-labeled menus [39]; however, only 46% of those meals resulted in a decreased caloric content whereas, in this study, 93.8% (n=15) of the meals that were changed (n=16) resulted in a decreased caloric content. |
| In a similar study, students in a college dining hall decreased the caloric content of their meal selections when calorie labels were displayed and began increasing the caloric content soon after calorie labels were removed [26]. Previous studies where 9% and 14.5% of participants used calorie labels to make ordering decisions showed no significant overall difference in calories purchased after viewing menu labels [40,41]. Studies conducted in localities where menu labeling has already taken effect also demonstrated no change in calories ordered as a result of the calorie labels [42,43]. The calorie-labeled menu in this study also contained a calorie claim at the top stating, “The recommended daily caloric intake for an average adult is 2,000 calories; individual needs may vary.” Roberto et al. specifically reports a positive impact of including a similar claim on menus used in that study [37]. This claim will be included on chain restaurant menus as part of the menu labeling legislation soon to take effect. |
| One interesting finding of our study is that 64% of respondents stated that they automatically assumed sandwich restaurants were healthier than other types of fast-food restaurants (Table 5), a phenomenon that has been termed the “health halos” of restaurant foods. Additionally, 75% of respondents stated they were surprised by how many calories at least one of the menu options contained (Table 5). Our results are analogous to results from studies designed around “health halos” that report consumers underestimate calories more if they are from restaurants deemed “healthy” (e.g. sandwich restaurants similar to the one used for menu selections in this study) or foods containing a “healthy” or “low-fat” label [17,44,45]. |
| Conclusion |
| Based on our review of the literature, this is the first study on menu labeling that has targeted college students in this region of the country. Our significant results demonstrating the effectiveness of menu labeling by encouraging students to order a lower-calorie meal are promising for the overall success of the legislation. One limitation of this study was the small initial response rate (n=70) and eligible sample size of those who completed the entire survey (n=64). Further, 56% of respondents had to be excluded for a portion of the data analysis due to incorrect completion of the menu selection portion of the survey. This likely occurred from misunderstanding or overlooking the directions that appeared prior to selection of meals from both the first and second menus. Although a field test was conducted to validate the survey utilized in this study, the method proved somewhat ineffective in this case and resulted in a decreased sample size for some of the analysis. |
| Further research is needed to compare whether different populations in the southern region would use the calorie labels to decrease the number of calories ordered in fast-food and other types of restaurant meals. The target population in this study was college students; however, it is likely that different populations (high school students, city residents, rural area residents, etc.) would have different attitudes and knowledge about calories and their health and would make their menu selections accordingly. After menu labeling is implemented nationwide, research will need to be conducted to determine whether or not patrons are actually using the labels to choose and consume lower-calorie meals. |
References
- http://frac.org/ initiatives/hunger-and-obesity/obesity-in-the-us/
- http://thomas.loc.gov/cgi-bin/bdquery/z?d101:H.R.3562
- http://www.amsreview.org/ articles/drichoutis09-2006.pdf
- Rudd Report (2008) Menu Labeling in Chain Restaurants: Opportunities for Public Policy. Rudd Center for Food Policy and Obesity. Yale University 1-11.
- Office of the Legislative Counsel (2010) Compilation of Patient Protection and Affordable Care Act: Nutrition Labeling of Standard Menu Items at Chain Restaurants. Section 4205. 518-522.
- Karen Stein (2010) Topics of Professional Interest: A National Approach to Restaurant Menu Labeling: The Patient Protection and Affordable Health Care Act, Section 4205. J Am Diet Assoc 110: 1280-1289.
- Drewnowski A, Darmon N (2005) Food Choices and Diet Costs: An Economic Analysis. J Nutr 135: 900-904.
- Hill JO, Peters JC (1998) Environmental Contributions to the Obesity Epidemic. Science 280: 1371-1374.
- Wootan M, Osborn M, Malloy C (2006) Availability of Point-of-Purchase Nutrition Information at a Fast-Food Restaurant. Preventive Medicine 43: 458-459.
- Roberto C, Agnew H, Brownell K (2009) An Observational Study of Consumers’ Accessing of Nutrition Information in Chain Restaurants.Am J Public Health 99: 820-821.
- Wootan M, Osborn M (2006) Availability of Nutrition Information from Chain Restaurants in the United States. Am J Prev Med 30: 266-268.
- Wansink B, Chandon P (2006) Meal Size, Not Body Size, Explains Errors in Estimating the Calorie Content of Meals. Ann Intern Med145: 326-332.
- Burton S, Howlett E, Tangari A (2009) Food for Thought: How Will the Nutrition Labeling of Quick Service Restaurant Menu Items Influence Consumers’ Product Evaluations, Purchase Intentions, and Choices? J Retailing 85: 258-273.
- Elbel B (2011) Consumer Estimation of Recommended and Actual Calories at Fast Food Restaurants. Obesity 19: 1971-1978.
- Chandon P, Wansink B (2007) Is Obesity Caused by Calorie Underestimation? A Psychophysical Model of Meal Size Estimation. J Marketing Res 44: 84-89.
- Burton S, Creyer E, Kees J, Huggins K (2006) Attacking the Obesity Epidemic: The Potential Health Benefits of Providing Nutrition Information in Restaurants. Am J Public Health 96: 1669-1675.
- Tangari A, Burton S, Howlett E, Cho Y, Thyroff A (2010) Weighing in on Fast Food Consumption: The Effects of Meal and Calorie Disclosures on Consumer Fast Food Evaluations. J Consum Aff 44: 431-462.
- de Castro JM (2004) Dietary Energy Density Is Associated with Increased Intake in Free-Living Humans. J Nutr 134: 335-341.
- Guthrie J, Lin B, Frazao E (2002) Role of Food Prepared Away from Home in the American Diet, 1977-78 versus 1994-96: Changes and Consequences. J Nutr Educ Behav 24: 140-150.
- Paeratakul S, Ferdinand D, Champagne C, Ryan D, Bray G (2003) Fast-Food Consumption Among US Adults and Children: Dietary and Nutrient Intake Profile. J Am Diet Assoc 103: 1332-1338.
- French SA, Harnack L, Jeffrey RW (2000) Fast Food Restaurant use among Women in the Pound of Prevention Study: Dietary, Behavioral and Demographic Correlates. Int J Obesity 24: 1353-1359.
- Kolodinsky J, Green J, Michahelles M, Harvey-Berino J (2008) The Use of Nutritional Labels by College Students in a Food-Court Setting. J Am Coll Health 57: 297-301.
- Conklin M, Cranage D, Lambert C (2005) College Students’ Use of Point of Selection Nutrition Information. Top Clin Nutr 20: 97-108.
- Buck LN, Golden DJ (1993) Facing the Fats: Implementation of a Fat-Labeling Program in a University Food Service. J Am Diet Assoc 93(9S): A55.
- Driskell J, Schake M, Detter H (2008) Using Nutrition Labeling as a Potential Tool for Changing Eating Habits of University Dining Hall Patrons. J Am Diet Assoc 108: 2071-2076.
- Chu YH, Frongillo EA, Jones SJ, Kaye GL (2009) Improving Patrons’ Meal Selections Through the Use of Point-of-Selection Nutrition Labels. Am J Public Health 99: 2001-2005.
- Bleich S, Pollack K (2010) The Publics’ Understanding of Daily Caloric Recommendations and their Perceptions of Calorie Posting in Chain Restaurants. BMC Public Health 10: 121-130.
- Gerend M (2009) Does Calorie Information Promote Lower Calorie Fast Food Choices Among College Students? J Adolesc Health 44: 84-86.
- Aaron J, Evans R, Mela D (1995) Paradoxical Effect of a Nutrition Labeling Scheme in a Student Cafeteria. Nutr Res 15: 1251-1261.
- http://www.subway.com/nutrition/nutritionlist.aspx
- Likert R (1932) A Technique for the Measurement of Attitudes. Archives of Psychology 140: 5-55.
- http://www.simplypsychology.org
- Hwang J, Lorenzen C (2008) Effective Nutrition Labeling of Restaurant Menu and Pricing of a Healthy Menu. J Foodservice 19: 270-276.
- Lando A, Labiner-Wolfe J (2007) Helping Consumers Make More Healthful Food Choices: Consumer Views on Modifying Food Labels and Providing Point-of-Purchase Nutrition Information at Quick-Service Restaurants. J Nutr Educ Behav 39: 157-163.
- Tandon P, Wright J, Zhou C, Rogers C, Christakis D (2010) Nutrition Menu Labeling May Lead to Lower-Calorie Restaurant Meal Choices for Children. Pediatrics 125: 244-248.
- Bassett M, Dumanovsky T, Huang C, Silver L, Young C, et al. (2008) Purchasing Behavior and Calorie Information at Fast-Food Chains in New York City, 2007. Am J Public Health 98: 1457-1459.
- Roberto C, Larsen P, Agnew H, Balk J, Brownell K (2010) Evaluating the Impact of Menu Labeling on Food Choices and Intake. Am J Public Health 100: 312-318.
- Temple J, Johnson K, Recupero K, Suders H (2010) Nutrition Labels Decrease Energy Intake in Adults Consuming Lunch in the Laboratory. J Am Diet Assoc 110: 1094-1097.
- Yamamoto JA, Yamamoto JB, Yamamoto BE, Yamamoto LG (2005) Adolescent Fast Food and Restaurant Ordering Behavior With and Without Calorie and Fast Food Content Information. J Adolescent Health 37: 397-402.
- Elbel B, Gyamfi J, Kersh R (2011) Child and Adolescent Fast-Food Choice and the Influence of Calorie Labeling: A Natural Experiment. Int J Obesity 35: 493-500.
- Vadiveloo M, Dixon B, Elbel B (2011) Consumer Purchasing Patterns in Response to Calorie Labeling Legislation in New York City. Int J Behav Nutr Phy 8: 51-59.
- Elbel B, Kersh R, Brescoll V, Dixon B (2009) Calorie Labeling and Food Choices: A First Look at the Effects on Low-Income People in New York City. Health Affairs 28: 1110-1121.
- Finkelstein EA, Strombotne KL, Chan NL, Krieger J (2011) Mandatory Menu Labeling in One Fast-Food Chain in King County, Washington. Am J Prev Med 40: 122-127.
- Chandon P, Wansink B (2007) The Biasing Health Halos of Fast-Food Restaurant Health Claims: Lower Calorie Estimates and Higher Side-Dish Consumption Intentions. J Consum Res 34: 301-314.
- Wansink B, Chandon P (2006) Can “Low-Fat” Nutrition Labels Lead to Obesity? J Marketing Res 43: 605-617.
Tables and Figures at a glance
| Table 1 | Table 2 | Table 3 | Table 4 | Table 5 |
Figures at a glance
 |
 |
 |
 |
 |
| Chart 1 | Chart 2 | Chart 3 | Chart 4 | Chart 5 |
Relevant Topics
- Android Obesity
- Anti Obesity Medication
- Bariatric Surgery
- Best Ways to Lose Weight
- Body Mass Index (BMI)
- Child Obesity Statistics
- Comorbidities of Obesity
- Diabetes and Obesity
- Diabetic Diet
- Diet
- Etiology of Obesity
- Exogenous Obesity
- Fat Burning Foods
- Gastric By-pass Surgery
- Genetics of Obesity
- Global Obesity Statistics
- Gynoid Obesity
- Junk Food and Childhood Obesity
- Obesity
- Obesity and Cancer
- Obesity and Nutrition
- Obesity and Sleep Apnea
- Obesity Complications
- Obesity in Pregnancy
- Obesity in United States
- Visceral Obesity
- Weight Loss
- Weight Loss Clinics
- Weight Loss Supplements
- Weight Management Programs
Recommended Journals
Article Tools
Article Usage
- Total views: 14613
- [From(publication date):
specialissue-2014 - Apr 05, 2025] - Breakdown by view type
- HTML page views : 10051
- PDF downloads : 4562
