Research Article Open Access
Impact of Climatological Parameters on Crop Water Use of Maize and Sorghum: A Case of Adami-Tulu Jido-Kombolcha woreda, Central Rift Valley of Ethiopia
Gemechu T*
Department of Natural Resources Management, College of Agriculture and Environmental Science, Debre Tabor University, Ethiopia
- *Corresponding Author:
- Gemechu T
Department of Natural Resources Management
College of Agriculture and Environmental Science
Debre Tabor University, Debre Tabor, Ethiopia
Tel: +251 058 778 06 77
Fax: +251 058 771 17 64
E-mail: tsegayeccd@gmail.com
Received Date: August 16, 2016; Accepted Date: November 05, 2016; Published Date: November 10, 2016
Citation: Gemechu T (2016) Impact of Climatological Parameters on Crop Water Use of Maize and Sorghum: A Case of Adami-Tulu Jido-Kombolcha woreda, Central Rift Valley of Ethiopia. J Earth Sci Clim Change 7:370. doi: 10.4172/2157- 7617.1000370
Copyright: © 2016 Gemechu T. This is an open-access article distributed under the terms of the Creative Commons Attribution License, which permits unrestricted use, distribution, and reproduction in any medium, provided the original author and source are credited.
Visit for more related articles at Journal of Earth Science & Climatic Change
Abstract
In Ethiopia agriculture is the backbone of the country's economy, with most the population involved in this sector. However, a wide range of climatic and topographical diversities influences it. Climate variables like temperature and precipitation are the important determinants of crop productions. Therefore, this study investigates the potential impact of climatological parameters on the crop water use of main crops, Maize and Sorghum at Adami Tulu Jido Kombolcha Woreda which is situated in 38°25'E and 38 45'E and 7°35'N and 8°05'N, in the central rift valley part of Ethiopia. Penman-Monteith and Hargreaves method were used to estimate current and future crop evapotranspiration of Maize and Sorghum. The regression and correlation analyses were used to examine the impacts of some climate variables on crop water use of Maize and Sorghum using XLSTAT software. It is clearly seen that maximum temperature, minimum temperature and sunshine hours has positive correlation with ETc of both Maize and Sorghum. The regression analysis computed for the climate variables and ETc of Sorghum and Maize have coefficient of determination 0.637 and 0.840, respectively. The results show that in future crop water use of both selected crops will increase in the study area. So, minimizing water loss (evaporation reduction by mulching or rapid crop cover, wind shields, minimum tillage, weeding etc. must be taken over the study area.
Keywords
Correlation; Climatological parameters; Penman- Monteith; Crop water use; Regression
Introduction
Agriculture is the main source of livelihood for about 85% of Ethiopia’s population, contributing 50% of the GDP and generates more than 80% of the foreign exchange earnings [1]. It is dominated by small scale crop-livestock mixed farming systems and cereals are the most important food crops occupying about 77% of the total cultivated area. Production technologies are predominantly characterized by low agricultural inputs (fertilizer, improved seeds, pesticides) using traditional farming techniques [2].
Maize and sorghum are the major crops grown in the dry land areas of Ethiopia and the production is undertaken under waterstressed conditions. The crop water use of maize and sorghum in some other dryland areas is not being satisfied. The large part of sorghum production areas in Ethiopia fall under the arid and semi-arid regions of the country that are characterized by high rainfall variability and low soil water storage capacity. The crop is widely grown in low moisture areas due to its high capacity to tolerate soil water deficit and wide range of ecological diversity [3].
Central Rift Valley is one of the environmentally vulnerable regions in Ethiopia, where rainfed crop production has expanded rapidly over recent decades. The warming trend imposes its impact on crop production with raising the evaporative demand, particularly in regions like the Central Rift Valley where rainfall is already scarce. Declined growing season rainfall with high evaporative demand will increase the risks of low yields in rainfed crop production [4].
Therefore, it’s essential to assess the climatic parameters in terms of their relationship and influence on crop water use to quantify their effects on crop yields. Hence the study is designed to assess the current and future crop water use of maize and sorghum under climate change scenarios and, as well as to examine the degree of association between some selected climatic parameters and crop evapotranspiration of maize and sorghum which can be used to improve rainfed crop productions and prepare adaptation options in Adami Tulu Jido Kombolcha Woreda, Central Rift Valley of Ethiopia.
Materials and Methods
The study area
Adami Tulu Jido kombolcha is one of the woredas found in East Shewa Zone of Oromia Regional State, Ethiopia. It extends from 38°25’E and 38° 55’E to 7°35’N and 8°05’N (Figure 1). Based on the current border delineation, the land area of woreda is estimated at 1487.6 km2 which is divided into 38 administrative rural kebeles and five towns. Batu town is the administrative center of the woreda [5]. It is located on the Addis Ababa to Ziway road, and 160 km away from Addis Ababa. The woreda shares boundaries with Southern Nation and Nationalities People Regional State (SNNPRS) in west and North West, Dugda Bora woreda in the north, Arsi zone in the east and Arsi Negele woreda in the south.

Figure 1: Location of the study area.
The study area is covered by black brown and sandy soils which are classified into vertic sand soils. Other soils that are found in the district include luvic phalozems and lithosols. Andosol soils originate from volcanic lacustrine deposits with volcanic ashes, ciders and pumic. Fluvisols are derived from alluvium on the lakes shore. Geleyic mollic fluvisols are derived from lacusrine deposited along the shores of Lake Zeway [6]. Adami Tulu Jido Kombolcha has a mixed crop-livestock farming system. The major crops grown include maize, sorghum, pepper, finger millet, teff, wheat, barley, field peas, beans, sweet potatoes. The main types of livestock kept include cattle, sheep, goats, equines, and chickens.
The data set
Available meteorological data including precipitation, minimum and maximum temperature, relative humidity, sunshine duration, and wind speed were collected from National Meteorological Agency. These data were obtained for four meteorological stations Adami Tulu, Ziway, Bulbula and Alemtena at daily time step in and around Adami Tulu Jido Kombolcha woreda (ATJKW). The data covers duration of about 30-years (1984-2013) for maximum and minimum temperature, precipitation, and wind speed whereas, for the remaining meteorological variables it is limited to 20-years data. Major crops grown in this area have been collected from woreda Agricultural Bureau.
The Statistical Downscaling Models predictor data files, HadCM3 are downloaded from the Canadian Climate Change Scenarios Network website http://www.cccsn.ec.gc.ca/scenarios/sdsm/select.cgi.
To perform meteorological analysis and simulation using data of long time series, filling in missing data is very essential. The spatial interpolation techniques are used to complete short and long period breaks in data series for a given meteorological stations.
A double-mass curve is a graph of the cumulative intercept of the rain gauge of interest versus the cumulative intercept of one or more gauges in the station that has been subjected to similar hydrometeorological occurrences and is known to be consistent. If a rainfall record is a consistent estimator of the hydrometeorological occurrences over the period of record, the double-mass curve will have a constant slope. If significant change in the regime of the curve is observed, it should be corrected.
 (1)
(1)
Where: P’x = corrected precipitation x
PX = original recorded precipitation at station x
M’ = corrected slope of double mass curve
M = original slope of double mass curve
The method can easily identify which of the neighboring meteorological stations, if any, around the stations, that which are to be filled best corresponds to fill the missing records. This method has not been applied for most cases due to lack of neighboring stations for the station in question. However, in filling and checking records of stations this has been used. This method helped in determining the best realistic correlation out of different stations located near the area. Per the double mass curves in Figure 2 show that, all the stations were found to be consistent for the period of 1984 to 2013 and the correlation coefficient of annual commutative rainfall of each station with four stations’ average annual commutative rainfall value is respected.

Figure 2: Double mass curve meteorological stations.
Climate change scenarios
General Circulation Models (GCMs) indicate that rising concentrations of greenhouse gases will have significant implications for climate at global and regional scales. For this study the future time scales from the year 2014 until 2099 were divided into three climate periods of 30 years and their respective changes were determined for temperature and for precipitation from the base period values.
A climate scenario is a plausible representation of future climate that has been constructed for explicit use in investigating the potential impacts of anthropogenic climate change [7]. Scenarios use to make decisions that involve high stakes and poorly characterized uncertainty, which may thwart other, conventional forms of analysis or decision support [8]. A2 (Medium-High Emissions) and B2 (Medium-Low Emission) are selected Scenarios model output of HadCM3 for this study by using Statistical Downscaling Models. The atmospheric part of HadCM3 has a horizontal resolution of 2.5º latitude × 3.75º longitude, with 19 vertical levels and, it has good representation of the African monsoon and a good record for Africa [9].
Statistical Downscaling Models used to obtain downscaled local information for future period by driving the relationships with GCM derived predictors. As described by Palmer et al. [10], this method is advantageous as it is easy to implement, and generation of the downscaled values involves observed historic daily data. The model facilitates the rapid development of multiple, low cost, single site scenarios of daily surface weather variables under present and future climate forcing [11]. SDSM calculates statistical relationships, based on multiple linear regression techniques, between large-scale (predictors) and local (predictand) climate and, it was assumed that these relationships remain valid in the future.
Crop water use estimation
The most common procedure for estimating crop water use or crop evapotranspiration (ETc) is the crop coefficient (Kc) approach. The FAO Penman-Monteith method is the standard recommended method for the definition and computation of ETo, which represents the evaporative demand of the atmosphere, independent of the crop type, crop development and crop management practices. This method consists of a combination of three equations (the original Penman- Monteith, the aerodynamic and surface resistance equations) [12].
According to Allen et al. [12], Penman-Monteith combination method is one of the most accurate methods to evaluate ETo at different time steps. A standardization of this method has been proposed by the Food and Agriculture Organization (FAO). It is known as FAO-56 Penman-Monteith application, and it can be considered as a worldwide standard. The daily average reference evapotranspiration (ETo) is given in (mm/day) according this equation as,
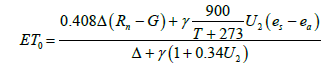 (2)
(2)
Where,
ETo reference evapotranspiration [mm day-1],
Rn net radiation at the crop surface [MJ m-2 day-1],
G soil heat flux density [MJ m-2 day-1],
T mean daily air temperature at 2 m height [°C],
u2 wind speed at 2 m height [m s-1],
es saturation vapour pressure [kPa],
ea actual vapour pressure [kPa],
es - ea saturation vapour pressure deficit [kPa],
Δ - slope vapour pressure curve [kPa °C-1],
γ- psychrometric constant [kPa °C-1].
Due to the difficulty in obtaining accurate field measurements, the estimation of crop water use were derived from estimating reference evapotranspiration and crop coefficient according to standardized crop and climatic conditions. A range of empirical methods have been developed to estimate crop evapotranspiration (ETc) from readily available climatic parameters. Crop evapotranspiration or crop water use can be assessed by multiplying the reference evapotranspiration (ETo) by the crop coefficient, based on the following relationship:
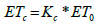 (3)
(3)
Where, Kc is crop coefficient,
Crop evapotranspiration is estimated through Kc and ETo over the growing season. The effect of both crop transpiration and soil evaporation are integrated into a single crop coefficient (Kc) incorporating crop characteristics and average effects of evaporation from the soil [13].
All calculation procedures used in CROPWAT 8.0 are based on the FAO publications No. 56 and 33 (FAO, 2009). The advantage of using the CROPWAT model as a tool for assessing crop water use is that it is simple and easy to use, and linked to less intense data requirements than other dynamic models such as ARCU, WOFORST and DSSAT. CROPWAT requires only monthly inputs of climate and rain data, coupled with crop parameters and soils data, to calculate water and irrigation requirements [14].
Hargreaves and Samani [15] developed a simplified equation requiring only temperature, day of year and latitude for calculating future potential evapotranspiration to estimate the crop evapotranspiration of Maize and Sorghum over the study area.
 (4)
(4)
Where, Ra is the extraterrestrial radiation in mm day-1
Correlation and regression
Correlation and regression were used to examine relationships between monthly and seasonal climatic variables and crop water use. For comparison of two-time series, the linear correlation R is a commonly used statistical value, which states if two quantities are related, i.e. it is a measure of the strength of their relationship. The value of R lies between -1 and 1, with 1 for perfect positive correlation, so the correlated time series increase and decrease together, 0 for no correlation and -1 for perfect negative correlation. The developed regression equations were applied to test the effect of change in value of climate parameters has on Crop evapotranspiration.
Results and Discussion
Estimation of evapotranspiration for maize and sorghum
For calculation of crop evapotranspiration, the crop coefficient (Kc) value of specific crops are needed. The Kc value is different for different plants even in different stages of a single plant. The Kc values of Maize and Sorghum were given depending on their stages of development (FAO [16]. The Kc values of Maize at initial stage are 0.50, at development stage 0.74, at mid-season stage 1.12 and at late season stage 1.02. Similarly, for Sorghum Kc values are 0.30, 0.63, 1.05 and 0.79 at initial, development, mid-season and late season stages, respectively as cited in [16]. The lengths of days for the growth stages of the crops were also taken from the and by considering the information from Woreda’s Agricultural office.
The Lengths of crop development stages for Maize are taken from [16] as 26, 45, 51 and 38 during initial, development, mid-season and late season stages, while the similar values for Sorghum are 30, 45, 55 and 48 respectively. Similarly, the maximum crop height (2.0 and (1.0- 2.0) meters), root depth (1.0-1.7 and 1.0-2.0), critical depletion (0.48 and 0.55) and yield response function (1.25 and 0.9) for both Maize and Sorghum, receptively are taken from [16].
All the crop physiology data and climate data of the study area are used the CROPWAT software to estimate the water loss through evaporation and transpiration which is known as crop water use of each crop at each stage. The results computed by the CROPWAT show that the crop evapotranspiration (ETc) of Maize and Sorghum crops were high during development mid-season and late stages as depicted in Table 1.
| Stages | Maize | Sorghum | ||
|---|---|---|---|---|
| Lengths of growth stages (days) | ETc in mm /growth stage | Lengths of growth stages (days) | ETc in mm/growth stage | |
| Initial | 26 | 36 | 30 | 33.8 |
| Development | 45 | 139.3 | 45 | 87 |
| Mid-season | 51 | 210.2 | 55 | 231 |
| Late | 38 | 171.8 | 45 | 146 |
| Total | 160 | 557.2 | 175 | 498.4 |
Table 1: Growth stage wise crop evapotranspiration of selected crops for the period 1984-2013.
The total seasonal crop evapotranspiration of Maize and Sorghum varies depending on their plantation time and it was high during short rainy season and low during rainy season. The total seasonal ETc of Maize is found to be 557.2 mm/season and for Sorghum it is 498.4 mm/ season over the study area. It was also recognized that Maize water requirements were higher than that of Sorghum in the study area.
Correlation and Regression analysis for ETc with climate variables
Results from correlation of climate variables with ETc (Table 2) of Maize and Sorghum (for the period of growth of crops under study) shows that relative humidity (for Sorghum) and Wind Speed (for both the crops) have smaller negative correlation coefficients, which are weak to acceptable degree of association Rainfall has the lowest negative correlation coefficients with ETc of Sorghum. However, it is clearly seen that maximum temperature, minimum temperature and sunshine hours has positive correlation with ETc of both Maize and Sorghum.
| Crops ETc | Rainfall | Maximum Temperature | Minimum Temperature | Relative Humidity | Wind Speed | Sunshine hour |
|---|---|---|---|---|---|---|
| Maize | 0.027 | 0.767 | 0.318 | 0.125 | -0.423 | 0.423 |
| Sorghum | -0.158 | 0.645 | 0.167 | -0.348 | -0.464 | 0.526 |
Table 2: Correlation coefficient for climatic variables with ETc of maize and sorghum.
Here, it is easily noticeable that maximum temperature has the highest coefficient of correlation with ETc. The value of maximum temperature is affecting ETc more for both crops as compared to the sunshine hours, relative humidity and wind speed. Rainfall and minimum temperature do not perform significant association with ETc. The implication of this result is that; the higher maximum temperature affects the ETc of Maize than Sorghum. It was true according to CEEPA [17] that Sorghum appears to be the most water efficient crop grown and performs especially well in the dry conditions with very low actual evapotranspiration. Whereas, Maize is a more water demanding and stress sensitive crop. So, maize should be grown only where good availability of water can be guaranteed.
In spite of some of the lesser pairwise correlations of the climate parameters with the crop water use of Sorghum and Maize, the climate parameters maximum and minimum temperature, sunshine and wind speed have been considered for regression analysis and the resultant equations for the two crops have been given below.
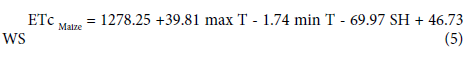
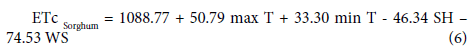
Where, SH = sunshine hour and WS = wind speed.
The regression analysis computed for the above climate variables and ETc of Sorghum and Maize have coefficient of determination 0.637 and 0.840 (Table 3), respectively. This indicates that 64 and 84% of the variance in Sorghum and Maize water use can be respectively, explained by the climatic parameters under study. The implication is that 36 and 16% of the variance in sorghum and maize water use can be respectively, explained by other factors not included in the study.
| Crops ETc | R | R2 | Standard error | F | P-value |
|---|---|---|---|---|---|
| Maize | 0.913 | 0.840 | 2.169 | 2.199 | 0.099 |
| Sorghum | 0.798 | 0.637 | 0.469 | 1.791 | 0.046 |
Table 3: Regression analysis of maize and sorghum water use with climatic variables.
From the R value, it can be said that the crops evapotranspiration is laying in the linear relationship and showing a very good level of association with climatic variables for both selected crops.
The average error in predicting the ETc of Maize is greater than the ETc of Sorghum by means of the regression equation as clearly seen from the Table 3 above.
The result of P value revealed that, between crop water use of Maize and Sorghum there is a significant linear relationship between the dependent and independent variables as the p value is less than 0.10. In the context of climate change, changes of temperature, wind speed, rainfall, solar radiation and other factors will lead to the change of ETc for both Maize and Sorghum production, thus affecting the plan of crop water demand and agricultural water usage. Generally, climatic variables have impact on selected crop water use over the study area except for some climate parameters which have less degree of association as discussed above. The study has actually revealed that other factors, such as crop variety, type of soil, soil fertility and farm methods may also be responsible for crop water use which affects crops production.
Future ETc of maize and sorghum under climate change scenarios
By using Hargreaves method, the future ETc of Maize and Sorghum have been calculated for three periods, 2020, 2050 and 2080. The results indicate that both the selected crops (Maize and Sorghum) shown rise in crop evapotranspiration in all future periods (2020, 2050 and 2080) when compared to base period 1984-2013 as shown in Figures 3 and 4 below. In the period 2020, Maize shows increment in crop evapotranspiration by 15% and 14% for future HadCM3 simulated climate for A2 and B2 scenarios, respectively. Similarly, the crop evapotranspiration of Maize may increase by 31% and 34% in 2050 and 54% and 52% in 2080 for the future HadCM3 simulated climate for the two A2 and B2 scenarios, respectively.

Figure 3: Percentage variation in ETc of maize for future HadCM3 simulated results A2 and B2 scenarios.

Figure 4: Percentage variation in ETc of sorghum for future HadCM3 simulated results A2 and B2 scenarios.
In case of Sorghum, in the period 2020, it shows negligible increment in crop evapotranspiration for future HadCM3 simulated climate for both A2 and B2 scenarios, whereas considerable rise in water use of both crops has been seen in other future periods (2050 and 2080). However, the increments will be less for HadCM3-B2 scenario for both crop water uses relative to HadCM3-A2 scenario. This is due to the fact that HadCM3-A2 represents medium high scenario which produces more CO2 as compared to HadCM3-B2 scenario which is medium low scenario.
Generally, the results show that in future years the crop water use of both the selected crops will increase in the study area. The reason for this may be due to increase in air temperature and decrease in relative humidity in future years. Also, average rainfall of the study area is showing decreasing trend until end of 2090 [18]. It is true according to [12] that, the power of the atmosphere to evaporate water is the driving force for soil evaporation and crop transpiration. Weather factors that have major impact on this evaporative power include: air temperature, humidity, solar radiation, wind. High air temperatures, low humidity, clear skies and high winds cause a large evaporative demand by the atmosphere.
Conclusions
The main findings of the study are summarized below.
The results computed by the CROPWAT show that the crop evapotranspiration (ETc) of Maize and Sorghum crops were high during development, mid-season and late stages. It was also recognized that Maize water requirements were higher than that of Sorghum in the study area.
The regression analysis using the four climate parameters maximum and minimum temperature, sunshine hour and wind speed with the crop water use of Sorghum and Maize show that they have coefficients of determination of 0.637 and 0.840, respectively. This indicates that 64% and 84% of the variance in Sorghum and Maize can be, respectively explained by the above climatic parameters. However, the study has actually revealed that other factors, such as crop variety, type of soil and farm methods may also be responsible for crop water use which affects crops production. Both selected crops (Maize and Sorghum) show rise in crop evapotranspiration in all future periods as compared to base period.
The increase of temperature will increase the rate of crop water use adding to the currently frequent water stress of crops. In response to this situation, some adaptive measures are essential to reduce the vulnerability of rainfed crop production due to increase of crop evapotranspiration by minimizing water loss (evaporation reduction by mulching or rapid crop cover, wind shields, minimum tillage, weeding etc.); and providing new varieties of Maize and Sorghum which could resist high evapotranspiration under changing climatic condition.
References
- DeressaTT, Hassan RM (2009) Economic impact of climate change on crop production inEthiopia: Evidence from cross-section measures. J Afr Econ.
- Arndt C, Robinson S, Willenbockel D(2011) Ethiopia's growth prospects in a changing climate: A stochastic general equilibrium approach. Global Environ Chang.
- MoARD (Ministry of Agriculture and Rural Development)(2007) Ministry of agriculture and rural development crop development crop variety register. Addis Ababa Ethiopia 7: 104.
- Kassie BT (2014) Climate variability and change in Ethiopia: Exploring impacts and adaptation options for cereal production.
- OESPO (2003)Adami Tulu Jidoworeda Based Development Progarm: Oromia Economic Study Project officeFinfinne.
- ESFEDD (2000) Physical and socio-economic profile of Oromia Regional State. East Showa Zone Finance and Economic Development department.
- Houghton JT, Ding Y, Griggs DJ (2001) Climate change 2001. Contribution of Working Group I to the Third Assessment Report of the Intergovernmental Panel on Climate Change.
- Bishaw Y (2012) Evaluation of climate change impact on Omo Gibe Basin (Case Study of Gilgel Gibe III Reservior).
- Xue Y, W FS, Lau K, Boone A, Dirmeyer J (2010) Inter comparison and analyses of the climatology of the West African Monsoon in the West African Monsoon Modeling and Evaluation project (WAMME) first model intercomparison experiment. ClimDynam.
- Palmer R, Clancy N, Rheenen E,Van NT,Wiley MW (2004) The impacts of climate change on the Tualatin river basin water supply: An investigation into projected hydrologic and management impacts.
- Wilby R, Christian L, Dawson W(2004) Using SDSM Version 4.1-A decision support tool for the assessment of regional climate change impacts.
- Allen RG, Pereira LS, Raes D, Smith M (1998) Crop evapotranspiration -Guidelines for computing crop water requirements - FAO Irrigation and drainage paper 56.
- Kassam A, Smith M (2001) FAO Methodologies on crop water use and crop water productivity.
- Smith M,Kivumbi D, Heng LK (2002) Use of the FAO CROPWAT model in deficit irrigation studies.
- Hargreaves GH, Samani ZA (1985) Reference crop evapotranspiration from temperature. Appl Engine Agric.
- Food and Agriculture Organization of the United Nations (FAO) (2015) The State of Food Insecurity in the World.
- Centre for Environmental Economics and Policy in Africa (CEEPA)(2006) Climate change and African Agriculture, University of Pretoria, Agricultural Annex, Pretoria, South Africa.
- Gemechu T, Wakbulcho G, Rao GN,Adamu T (2015) The current and future trend of rainfall and its variability in Adami Tulu JidoKombolchaworeda, Central Rift Valley of Ethiopia. J Env& Ear Sci 5: 22.
Relevant Topics
- Atmosphere
- Atmospheric Chemistry
- Atmospheric inversions
- Biosphere
- Chemical Oceanography
- Climate Modeling
- Crystallography
- Disaster Science
- Earth Science
- Ecology
- Environmental Degradation
- Gemology
- Geochemistry
- Geochronology
- Geomicrobiology
- Geomorphology
- Geosciences
- Geostatistics
- Glaciology
- Microplastic Pollution
- Mineralogy
- Soil Erosion and Land Degradation
Recommended Journals
Article Tools
Article Usage
- Total views: 12282
- [From(publication date):
October-2016 - Jul 09, 2025] - Breakdown by view type
- HTML page views : 11178
- PDF downloads : 1104