Identification and Analysis of Alzheimer’s Candidate Genes by an Amplitude Deviation Algorithm
Received: 24-Jan-2019 / Accepted Date: 27-Jan-2019 / Published Date: 02-Feb-2019 DOI: 10.4172/2161-0460.1000460
Abstract
Background: Alzheimer’s disease (AD) is the most common form of senile dementia. However, its pathological mechanisms are not fully understood. In order to comprehend AD pathological mechanisms, researchers employed AD-related DNA microarray data and diverse computational algorithms. More efficient computational algorithms are needed to process DNA microarray data for identifying AD-related candidate genes.
Methods: Herein, we propose a specific algorithm that is based on the following observation: When an acrobat walks along a steel-wire, his/her body must have some swing; if the swing can be controlled, then the acrobat can maintain the body balance. Otherwise, the acrobat will fall. Based on this simple idea, we have designed a simple, yet practical, algorithm termed as the Amplitude Deviation Algorithm (ADA). Deviation, overall deviation, deviation amplitude, and 3δ are introduced to characterize ADA.
Results: 52 candidate genes for AD have been identified via ADA. The implications for some of the AD candidate genes in AD pathogenesis have been discussed.
Conclusions: Through the analysis of these AD candidate genes, we believe that AD pathogenesis may be related to the abnormality of signal transduction (AGTR1 and PTAFR), the decrease in protein transport capacity (COL5A2 (221729_at), COL5A2 (221730_at), COL4A1), the impairment of axon repair (CNR1), and the intracellular calcium dyshomeostasis (CACNB2, CACNA1E). However, their potential implication for AD pathology should be further validated by wet lab experiments as they were only identified by computation using ADA.
Keywords: Alzheimer’s disease; Amplitude deviation algorithm; DNA microarray
Background
Introduction of Alzheimer’s disease and AD genes
Alzheimer’s disease (AD), the most common form of senile dementia, is a progressive neurodegenerative disorder characterized by global cognitive decline involving memory, orientation, judgment, and reasoning [1]. The disease itself was named after Alois Alzheimer [2], a Bavarian psychiatrist with expertise in neuropathology. According to statistics, AD is approaching epidemic proportions, with no cure or preventative therapy available [1]. By the year 2050, it is predicted that AD will affect 115.4 million people globally [3].
The AD pathogenesis is not yet well understood. In last 30 years, there have been many hypotheses trying to explain the cause of AD [1,2,4]. It is of common opinion that AD is related to amyloid plaques (Aβ) and neurofibrillary tangles (NFT) in the brain [1,2]. This hypothesis is supported by the location of the AD causative gene called the amyloid precursor protein (APP) on chromosome 21 [5,6]. In 2009, this theory was updated, suggesting that a close relative of the beta-amyloid protein, and not necessarily the beta-amyloid itself, may be the major culprit of the disease [7].
Three main genes associated with early onset AD are APP, PSEN1, and PSEN2 [8]. One main gene associated with late onset AD is APOE [8]. In 2009, evidence that attempted to prove ADAM10 as a candidate AD susceptibility gene was first provided [9]. Between 2009 and 2010, the genes PICALM, CL-U, CR1, and BIN1 were also put forward as potential AD candidate genes [10,11]. Other AD-related genes of interest such as CD33 and ATXN1 have also been identified [12-14].
Introduction of DNA microarray and its application on AD genes
With little known about the cause of AD, it is necessary to identify more AD-related candidate genes. Prior to the year 2000, identifying AD candidate genes involved a large amount of time and money and yielded limited results. However, with the development of DNA microarray technology, researchers began to apply this technology in order to better identify potential AD genes [15].
DNA microarrays (also called gene chips) are a complex technology in molecular biology. A DNA microarray is typically a glass slide onto which DNA molecules are fixed in an orderly manner at specific locations called spots (or features). The DNA in a spot may either be genomic DNA or short stretches of oligonucleotide strands that correspond to a specific gene. The spots are printed onto the glass slide by a robot or are synthesized by the process of photolithography [16].
Researchers use DNA microarrays to measure the expression levels of thousands of genes simultaneously. Since DNA microarrays contain many spots, we can obtain many gene expression levels from a single experiment, compared to only being able to measure expression of one gene with a Northern Blot [17].
In order to analyze the DNA microarray data and identify AD candidate genes, researchers began designing computation methods (algorithms) in order to process the data. Currently, the most commonly used algorithms are the K-means Clustering algorithm [18], the Principal Component Analysis (PCA) algorithm [19], and the Ant Colony algorithm (ACO) [20].
Organization of gene expression levels
In this manuscript, the original DNA microarray data were downloaded from the GEO Dataset within NCBI [21], which includes 22,283 genes. The data were obtained from control, incipient, moderate, and severe AD patients. All of these data are organized in a matrix format (Table 1). Table 1 consists of 22,283 rows and 9 columns, where the 22,283 rows correspond to the expression levels of the 22,283 genes, and the 9 columns represent the 9 samples (experiments). The matrix element in Table 1 comes from male controls, denoted by in this paper. The other three matrices, incipient, moderate, and severe, are denoted by, and, with 7, 8, and 7 columns, respectively.
| 1st col. | 2nd col. | … | 9th col. | ||
|---|---|---|---|---|---|
| Gene No. | AFFX -NAME | GSM 21215 | GSM 21217 | … | GSM 21232 |
| 1 | BioB-5_at | 8.937 | 9.941 | … | 9.386 |
| 2 | BioB-M_at | 9.278 | 10.56 | … | 10.37 |
| 3 | BioB-3_at | 7.9 | 9.033 | … | 9.299 |
| 4 | BioC-5_at | 10.18 | 11.46 | … | 10.91 |
| … | … | … | … | … | … |
| 22283 | 222384_at | 5.092 | 6.463 | … | 6.6 |
Note 1: In Table 1, each data (gene expression level) has been log-transformed but not normalized along the column.
Table 1: The organization of gene expression levels.
Methods
The simple idea behind the amplitude deviation algorithm (ADA)
In order to identify AD candidate genes, we are proposing a new model based around the following principal: when an acrobat walks along a steel-wire, his/her body must have some swing; if the swing can be controlled by the individual then the acrobat can keep the body balance; otherwise, the acrobat will fall. Correspondingly, each gene can be seen as an acrobat and the change of expression level of each gene can be compared to the swing of an acrobat’s body on the tightrope. In the controlled stage (i.e., acrobats maintaining balance on the tightrope), since all genes have the ability of self-regulation, the gene expression levels are maintained within a certain range. However, when AD pathology develops in the brain, the expression levels of certain genes goes beyond the controlled range, analogous to the acrobats losing their balance. These are the genes that may be associated with AD.
Data pre-processing
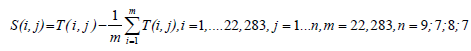
The data in the four different stages are organized as the matrices Tctrol (22,283 * 9), Tircip (22,283*7), Tmoder (22,283*8), and Tsevere (22,283*7), respectively. Since the data of every column in each matrix is from one sample, the data in different columns are incomparable. In order to solve this problem, four data matrices are processed. In this paper, we process these matrices using the fact that the data in every column is equal to the value in the corresponding column minus that column’s average value. This column of differences then defines the difference as deviation:
 (1)
(1)
Where s(I,j) is defined as deviation matrix.
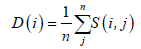
In the process of obtaining data, different experimental conditions (such as samples, equipment, temperatures, etc.) may generate errors. In order to reduce the potential errors, we calculated the average deviations for the different samples of the same stage, and this is how the overall deviation is calculated. The format of is presented as follows:
 (2)
(2)
i=1,2,…,22283;
n=9,7,8,7.
Mathematical representation of the ADA
In this paper, each gene is compared to an acrobat as aforementioned. When an acrobat walks along a tightrope, his body must have some swing. Correspondingly, there must be certain changes of expression levels of each gene. More specifically, for each gene there must be differences between the controlled stage and the incipient, moderate, and severe stages. We use these differences to characterize the changes. Then the deviation amplitude is introduced (here, deviation amplitude can be interpreted as the difference). The format of deviation amplitude is presented as follow:
Aincip (i)=Dincip (i)-Dctrol(i) (3)
Amoder (i)=Dmoder(i)-Dctrol(i) (4)
Asevere (i)=Dsevere(i)-Dctrol(i) (5)
Where Dcotrl(i),Dinvip(i),Dmoeder(i),Dsevere(i), are denoted by the overall deviation in four stages and Aincip(i),Amoder(i),Asevere(i) represents the deviation amplitude in the incipient, moderate and severe stage, respectively.
Here, we find that Aircip(i) satisfies the normal distribution via the corresponding statistical histogram, shown in Figure 1A. Similarly, both Amoder(i) and Asevere(i) satisfy normal distribution (their corresponding averages are almost equal to 0, their variances are equal to 0.417 and 0.536, respectively).

Figure 1A: The statistical histogram of Aincip(i) and shows that the deviation amplitude Aincip(i) obeys the normal distribution (the average value of Aincip(i) is approximately 0 and the variance is equal to 0.3609).
The normal distribution follows the 3σ principle, which asserts that 99.7% of the data falls within a range of 3σ. Any sample that does not follow this principle is abnormal. We use the 3σ principle as the criterion for characterizing how big of a range our “acrobats” can have while maintaining stability. That is to say, when the change of expression level of a gene is greater than 3σ or less than -3σ (i.e., At (t) −  |> 3σ , t represents the different stages) and its overall deviation is consistently and significantly upregulated or downregulated, the gene is a candidate for AD.
The computation was performed, and 12 genes were identified as AD candidate genes (Table 2). Among them are 7 genes whose average deviations are significantly and consistently upregulated (listed in the right column of Table 2), and 5 genes whose average deviations are significantly and consistently downregulated (listed in the left column of Table 2).
| Affymetrix Probe Set Name | Symbol | Affymetrix Probe Set Name | Symbol |
|---|---|---|---|
| 202018_s_at | LTF | 206232_s_at | B4GALT6 |
| 206278_at | PTAFR | 206552_s_at | TAC1 |
| 209728_at | HLA-DRB4 | 206624_at | USP9Y |
| 211579_at | ITGB3 | 212702_s_at | BICD2 |
| 214188_at | HEXIM1 | 221730_at | COL5A2 |
| 214623_at | FBXW4P1 | ||
| 216752_at | PIK3R4 | ||
Table 2: The candidate genes identified by 3σ principle.
This result is not ideal. In addition to the small number of AD candidate genes, the data collected was affected by noise during the experimental process. If we can keep the original basis of the result and relax the conditions appropriately, the effects should improve. Therefore, the specific ADA is formulated:
Below, deviation amplitude is defined as the forms of eqns. (6), (7) and (8):
Below, deviation amplitude is defined as the forms of eqns. (6), (7) and (8):
Aincip(i)=|Dincip(i)-Dctrol(i)| i=1,…22283 (6)
Amoder(i)=|Dmoder(i)-Dctrol(i)| i=1,…22283 (7)
Asevere(i)=Dsevere(i)-Dctrol(i)| i=1,…22283 (8)
The statistical histogram of Aincip(i) is shown in Figure 1B. Here, Aincip(i) does not obey the normal distribution. Both Amoder(i) and Asevere(i) also do not satisfy normal distribution.

Figure 1B: The statistical histogram of Aincip(i) and indicates that Aincip(i) doesn’t obey normal distribution.
In statistics, σ has a common formula as follows:
σ= D(x)=E(x-x)2=E(x2)=E(x2)-[E(x)]2
Where E(x), D(x) is the expectation and variance of x respectively.
When the deviation amplitude is defined as eqn. (3), the value of E(x) is almost equal to zero. However, when the deviation amplitude is defined as eqn. (6), the value of E(x) is greater than zero, which leads to a decreased value of D(x). Correspondingly, 3σ gets smaller as well. via  represents the variance which are from eqns . (6), (7) and (8)), 3σ* is selected to be the biggest threshold of range that allows acrobats to keep their balance. Since At(i)(t represents the different stages) does not obey the normal distribution, we propose the following two criterions to identify AD candidate genes:
Criterion 1:
Aincip(i)> 3σ*incip>3σ*moder>3σ*severe (9)
Dctrl(i)<Dincip(i)<Dmoder(i)<Dsevere(i) (10)
Criterion2:
 (11)
(11)
Dctrl(i)>Dincip(i)>Dmoder(i)>Dsevere(i) (12)
Implementation of the ADA to identify AD candidate genes
Step 1: Use eqn. (1) to calculate deviation matrices in four different stages
Step 2: Use eqn. (2) to calculate the overall deviation of each gene in four stages
Step 3: Use eqns. (3), (4) and (5) to calculate three deviation amplitudes of each gene (incipient, moderate and severe stages).
Step 4: Use eqns. (6), (7) and (8) to calculate three deviation amplitudes of each gene (incipient, moderate and severe stages).
Step 5: Use eqns. (9), (10), (11) and (12) to identify AD candidate genes.
Results
Here, we identify 52 candidate genes. Out of these genes, 27 have deviation amplitudes with consistent rises (Figure 2A), and 25 genes have deviation amplitudes with consistent declines (Figure 2B). It is worth noting that the 52 genes discovered with the ADA also contain formerly identified AD candidate genes. Thus, the results of the second set of equations not only retain the original results, but also achieve the conditions of relaxation; therefore, the second set should be better at reflecting the actual number of AD-related gene expressions. Tables 3 and 4 contain candidate genes selected by the first and second criterion.

Figure 2A: AD candidate genes with consistent rises in deviation amplitude.
Figure 2A shows that 27 genes out of 52 AD candidate genes have deviation amplitudes with consistent rises.

Figure 2B: AD candidate genes with consistent declines in deviate amplitude and shows that 25 genes out of 52 AD candidate genes have deviation amplitudes with consistent declines.
| Gene ID | Abbreviation | Gene ID | Abbreviation | Gene ID | Abbreviation |
|---|---|---|---|---|---|
| 202018_s_at | LTF | 216059_at | PAX3 | 209728_at | HLA-DRB4 |
| 208016_s_at | AGTR1 | 216417_x_at | HOXB9 | 210511_s_at | INHBA |
| 208432_s_at | CACNA1E | 216752_at | PIK3R4 | 211579_at | ITGB3 |
| 215191_at | THOP1 | 217268_at | RAB7A | 214188_at | HEXIM1 |
| 207218_at | F9 | 217380_s_at | XPNPEP1 | 214509_at | HIST1H3I |
| 207672_at | RFX4 | 217953_at | PHF3 | 222332_at | HG-U133A |
| 207924_x_at | PAX8 | 219327_s_at | GPRC5C | 214623_at | FBXW4P1 |
| 208111_at | AVPR2 | 219864_s_at | RCAN3 | 206278_at | PTAFR |
| 202705_at | CCNB2 | 220317_at | LRAT | 215339_at | NKTR |
Table 3: The AD candidate genes selected by the first criterion.
| Gene ID | Abbreviation | Gene ID | Abbreviation | Gene ID | Abbreviation |
|---|---|---|---|---|---|
| 202188_at | NUP93 | 208427_s_at | ELAVL2 | 206089_at | NELL1 |
| 202971_s_at | DYRK2 | 210292_s_at | PCDH11Y | 206232_s_at | B4GALT6 |
| 203030_s_at | PTPRN2 | 211980_at | COL4A1 | 206552_s_at | TAC1 |
| 203841_x_at | MAPRE3 | 212702_s_at | BICD2 | 206624_at | USP9Y |
| 203998_s_at | SYT1 | 212743_at | RCHY1 | 221729_at | COL5A2 |
| 204726_at | CDH13 | 213436_at | CNR1 | 221730_at | COL5A2 |
| 205278_at | GAD1 | 213458_at | FAM149B1 | 211496_s_at | PDC |
| 205391_x_at | ANK1 | 213714_at | CACNB2 | ||
| 205924_at | RAB3B | 220188_at | JPH3 |
Table 4: The AD candidate genes selected by the second criterion.
Discussion
Analysis of AD candidate genes
The healthy human body maintains physiological homeostasis in countless aspects, and this balance depends on coordination among proteins in the human body. Proteins are subject to the regulation of gene expression, so the coordination among proteins depends on the coordination of gene expression levels. Once the coordination of gene expression levels is destroyed, the body will enter pathophysiological status, resulting in disease. Since AD is a chronic neurodegenerative disorder that is characterized by memory impairment, cognitive dysfunction, and behavioral disturbances, this paper claims that AD revolves around a nervous system imbalance, which is associated with an imbalance of gene expression levels. Therefore, these genes whose expression levels are out of balance are AD candidate genes.
The ADA proposed in this paper attempts to find those genes with dramatic changes in gene expression levels, which then leads to an imbalance. It is possible that this imbalance may either be the cause or outcome of AD.
After analyzing the locations and functions of the proteins encoded by the identified genes, the following features were discovered and certain new pathological factors of AD were conjectured. First, most of the proteins encoded by these identified genes are located in the membrane and the cytoplasm (the distributions of proteins are shown in Figure 3A).

Figure 3A: Distribution of proteins encoded by these identified genes and 34% of proteins are located in the membrane, 15% at the cytoplasm, 12% at the nucleus, 7% at an extracellular region, 5% at the collagen, 3% at the cytoskeleton, 2% at the microtubule, and 22% at other areas. The results suggest that potential causative factors of AD pathology may be associated with the proteins located at the membranes of neurons, cytoplasms, and nuclei and extracellular regions (particularly at the membrane and cytoplasm).
The functions of most proteins encoded by these identified genes correlate with signal transduction, metabolism, regulation of transcription, protein transport, immune response, and protein degradation (especially regarding signal transduction, metabolism, regulation of transcription, and transport (Figure 3B). The location and functions of these proteins suggests that analyzing the proteins at the membrane and the cytoplasm is helpful for exploring the AD pathology.

Figure 3B: Distribution ratios of protein functions and shows that the percentages of proteins involved in signal transduction, metabolism, regulation of transcription, and protein transport, are 25%, 22%, 17%, and 17%, respectively, which are greater than the percentages of proteins associated with immune response and protein degradation.
Moreover, proteins located specifically on membranes are mainly involved in signal transduction and protein transport (Figure 3C), and the proteins located specifically at the cytoplasm mainly correlate with protein transport and degradation (Figure 3D). Based on these findings, we can infer that the factors causing AD are significantly associated with signal transduction, metabolism, regulation of transcription, and protein transport and degradation. Loss of proper signal transduction and signaling pathway function [22,23], loss of regulation of transcription, [24] and dysregulation of metabolism [25] have all been correlated with AD progression in previous studies.

Figure 3C: Percentages of functions of membrane proteins and shows that the membrane proteins associated with signal transduction, protein transport, metabolism, immune response, and regulation/ control of transcription are respectively 55%, 20%, 15%, 5% and 5%.

Figure 3D: The functions of proteins in the cytoplasm and shows the percentages of proteins involved in protein transport and degradation, metabolism, signal transduction, and regulation/control of transcription are 34%, 22%, 22%, 11% and 11%, respectively.
In regard to particular genes studied, the abnormal expression levels of genes (AGTR1 and PTAFR) are associated with increasing protein kinase C (PKC), which can promote the accumulation of amyloid Aβ, potentially leading to AD. The protein AGTR1 (angiotensin II receptor 1), encoded by gene AGTR1, allows for binding of angiotensin II, which generates diacylglycerol, and in turn activates PKC [26] which markedly decreases Aβ release from cells [27]. Since the expression level of gene AGTR1 consistently increases with AD progression (Figure 4), the excessive cellular accumulation of Aβ will be promoted, which may lead to AD [7]. There is evidence to suggest that angiotensin II receptor blockers may be a viable option for AD treatment [28], and this may be because these blockers prevent PKC from decreasing amyloid Aβ release.

Figure 4: The expression levels of genes (AGTR1, PTAFR, CNR1) with the deterioration of AD. Genes AGTR1 and PTAFR are associated with signal transduction. With the AD progression, their expression levels are significantly upregulated. Inversely, the expression level of gene CNR1 is downregulated.
The increase of the protein PTAFR (platelet-activating factor, PAF), a phospholipid signaling molecule, causes increased binding to its corresponding receptor (RAF-R) in the membrane surface which can activate phosphatidylinositol and phospholipase C [7]. In the phosphatidylinositol pathway, extracellular signaling molecules which bind G protein-coupled receptors on the cell surfaces cause the hydrolysis of phosphatidylinositol diphosphate into two products: inositol triphosphate (IP3e) and diacylglycerol (DG). DG can activate protein kinase c [29]. Protein kinase c markedly decreased the Aβ release from cells, [27] and increases the accumulation of Aβ that may lead to AD [7]. A recent study suggests that aberrant lipid signaling is correlated with AD [30].
Furthermore, the abnormal expression of gene CNR1 correlates with the absence of LTD (long-term depression), which may lead to the impairment of LTP (long-term potentiation) and then may induce AD. The protein CNR1 (Cannabinoid receptor 1), which is mainly distributed in the central nervous system (CNS), is involved in preventing neurotransmitter release. Since the protein CNR1 is significantly downregulated in the presence of AD, (Figure 4), LTD is not activated [31,32]. The absence of LTD may contribute to abnormalities of learning and memory-related behavior [33], which are AD symptoms.
Additionally, the abnormal expressions of genes (COL5A2 (221729_at), COL5A2 (221730_at), COL4A1) are associated with a decrease in energy supply, which then can lead to neuronal apoptosis, an AD neuropathological feature [34]. All of the proteins encoded by genes COL5A2 (221729_at), COL5A2 (221730_at), and COL4A1 are involved in phosphate transport in an organism’s activities. Phosphorus is one of the main elements that make up the human body; it is largely involved in the body’s energy metabolism and it is also an important component of adenosine triphosphate (ATP) [35]. A recent study revealed that higher levels of serum phosphorus are correlated with increased risk for dementia [36]. More research is needed to find out more information about the connection between phosphorus and AD.
Figure 5 explains that the expression of proteins encoded by these genes (COL5A2 (221729_at), COL5A2 (221730_at), COL4A1) is consistently downregulated, which may contribute to energy metabolism disorders and then affect a series of activities such as signal transduction, transcription, protein degradation and transport, which, as mentioned previously, are related to AD. Neuronal apoptosis, another AD pathological feature mentioned previously, may be the result of this downregulation.

Figure 5: The expression levels of genes (COL5A2 (221729_at), COL5A2 (221730_at), COL4A1). Genes (COL5A2 (221729_at), COL5A2 (221730_at), COL4A1) are related to transport. With the AD progression, their expression levels are all downregulated.
Analysis of candidate genes associated with metal ions
In the 52 identified genes, 14 genes (about one-third of the total) are associated with metal ions. After analyzing these metal ion genes, the following characteristics are observed. First, most of the genes associated with metal ions are related to calcium ions (Figure 6A). As shown in Figure 6A, 14 genes are mainly related to calcium ions. Numerous studies have shown there is a close relationship between calcium dyshomeostasis and AD [37-39]; therefore, it is necessary to study these genes associated with calcium ions. In fact, a recent study that added new evidence for the Calcium Hypothesis of Alzheimer’s and Brain Aging details how changes in calcium signaling can affect neurons and, in some cases, promote death and disease [40]. Clearly, the connection between AD and calcium has been an active area of research for decades; since calcium plays such a significant role in neuronal function, it is no surprise that dysregulation of calcium may promote AD.

Figure 6A: The proportions of genes associated with various metal ions and the percentages of genes associated with calcium ions, manganese ions, magnesium ions, zinc ions, and ferric ions are 53%, 17%, 12%, 12%, and 6%, respectively.
After analyzing the genes associated with calcium ions, we saw that most of the proteins encoded by these genes are distributed in the membrane and extracellular regions. The percentage of protein distributions are shown in Figure 6B. In addition, we found that proteins encoded by the genes associated with calcium ions are mainly involved in signal transduction and metabolism. The percentages of protein functions are shown in Figure 6C.

Figure 6B: The distributions of proteins encoded by the calcium-related genes. The percentages of proteins located at the membrane, the extracellular region, and unknown are, 78%, 11%, and 11%, respectively.

Figure 6C: The percentages for functions of proteins encoded by the genes associated with calcium ions. 56% are involved in signal transduction, 44% are related to metabolism.
We also investigated the CACNB2 and CACNA1E proteins, which are the β2 subunit and α1E subunit, respectively, of a voltage-dependent calcium channel. The protein voltage-dependent calcium channel (voltage-dependent calcium channels, VDCC), which is located in the cell membrane, controls the intake of calcium ions into the cell. VDCC activity is determined by the α1 subunit whose functions are regulated by a β subunit (β1-β4) [41]. Since the expression level of gene (CACNB2) is significantly downregulated with the deterioration of AD (Figure 7), the ability of a β2 subunit to regulate an α1subunit may weaken, which may cause the expression of the gene CACNA1Ecacna1e to consistently increase with AD progression (Figure 7). The increasing proteins encoded by the gene cacn1e may induce VDCC activity changes. Moreover, VDCC activity changes may cause a change in calcium influx, which may lead to intracellular calcium dyshomeostasis and induce AD. This conclusion coincides with the idea that AD is correlative with the intracellular calcium dyshomeostasis [39].

Figure 7: The expression levels of genes (CACNB2, CACNA1E). Genes (CACNB2, CACNA1E) are associated with calcium ions. As the severity of AD increases, the expression levels change sharply.
Potential implications for the AD candidate genes
In this paper, we studied eight genes selected from a list of identified AD candidate genes and discussed their potential implications in AD. Although we believe that these AD candidate genes are interesting for many reasons, including the dramatic change of gene expressions and its proven role in AD pathogenesis by other references (Figure 8), the potential implication should be used only as a reference.

Figure 8: Summary of possible pathogenetic roles for AD candidate genes identified in this paper. Part A, B, and C are added to be four possible pathogenetic roles and are highlighted with a dashed line. Part D is from Figure 1 in reference [2].
Conclusions
Even though AD is the most common form of dementia, its pathological mechanisms are not fully revealed. However, three earlyonset familial AD genes (APP, PSEN1, and PSEN2) and one genetic risk factor for late-onset AD (APOE) have been identified. With the applications of DNA microarray technology, identifying more AD candidate genes by computation appears particularly promising.
By using ADA, we were able to identify 52 genes that showed dramatic changes in gene expression, and thus can be identified as potential AD candidate genes. With regards to these candidate genes, 27 genes showed average amplitudes with unanimous rises (Figure 2A) and 25 genes showed average amplitudes that consistently downregulated with the deterioration of AD (Figure 2B).
By studying these AD candidate genes, the following four pathogenetic roles are determined: (1) the abnormal expression levels of genes (AGTR1 and PTAFR) are associated with an increase in the activity of protein kinase c, which promotes the accumulation of Aβ, in turn leading to AD; (2) The abnormal expression of gene CNR1 correlates with the absence of LTD, which may lead to the impairment of LTP, and subsequently may induce AD; (3) The abnormal expressions of genes (COL5A2 (221729_at), COL5A2 (221730_at), COL4A1) are associated with decreases in energy supply, which may lead to neuronal apoptosis, a pathological feature of AD; (4) The abnormal expressions of genes (CACNB2, CACNA1E) correlate with the intracellular calcium dyshomeostasis, which is related to AD.
Based upon this study, we propose that AD pathogenesis may be related to abnormality of signal transduction (AGTR1 and PTAFR), decrease in protein transport capacity (COL5A2 (221729_at), COL5A2 (221730_at), COL4A1), impairment of axon repair (CNR1), and intracellular calcium dyshomeostasis (CACNB2, CACNA1E).
Finally, since these AD candidate genes were only identified by computation using ADA their potential implication for AD pathology should be further validated by wet lab experiments.
Acknowledgment
The authors appreciate the long-term support from the members of gene computation group: H. Ding, T-Z. Dong, WYi, Wang YY. Chen. HSC would like to thank the MIT externship program for allowing her to be a student intern at MGH. XH is supported by an NIH grant R01AG056614.
References
- Tanzi RE, Bertram L (2005) Twenty years of the Alzheimer's disease amyloid hypothesis: A genetic perspective. Cell 120: 545-555.
- Bertram L, Tanzi RE (2008) Thirty years of Alzheimer's disease genetics: The implications of systematic meta-analyses. Nat Rev Neurosci 9: 768-778.
- Prince M, Bryce R, Albanese E, Wimo A, Ribeiro W, et al. (2013) The global prevalence of dementia: A systematic review and metaanalysis. Alzheimers Dement 9: 63-75 e62.
- Tiraboschi P, Hansen LA, Thal LJ, Corey-Bloom J (2004) The importance of neuritic plaques and tangles to the development and evolution of AD. Neurology 62: 1984-1989.
- Nistor M, Don M, Parekh M, Sarsoza F, Goodus M, et al. (2007) Alpha- and beta-secretase activity as a function of age and beta-amyloid in Down syndrome and normal brain. Neurobiol Aging 28: 1493-1506.
- Lott IT, Head E (2005) Alzheimer disease and Down syndrome: Factors in pathogenesis. Neurobiol Aging 26: 383-389.
- Nikolaev A, McLaughlin T, O'Leary DD, Tessier-Lavigne M (2009) APP binds DR6 to trigger axon pruning and neuron death via distinct caspases. Nature 457: 981-989.
- Bagyinszky E, Youn YC, An SS, Kim S (2014) The genetics of Alzheimer's disease. Clin Interv Aging 9: 535-551.
- Kim M, Suh J, Romano D, Truong MH, Mullin K, et al. (2009) Potential late-onset Alzheimer's disease-associated mutations in the ADAM10 gene attenuate {alpha}-secretase activity. Hum Mol Genet 18: 3987-3996.
- Harold D, Abraham R, Hollingworth P, Sims R, Gerrish A, et al. (2009) Genome-wide association study identifies variants at CLU and PICALM associated with Alzheimer's disease. Nat Genet 41: 1088-1093.
- Lambert JC, Heath S, Even G, Campion D, Sleegers K, et al. (2009) Genome-wide association study identifies variants at CLU and CR1 associated with Alzheimer's disease. Nat Genet 41: 1094-1099.
- Bertram L, Lange C, Mullin K, Parkinson M, Hsiao M, et al. (2008) Genome-wide association analysis reveals putative Alzheimer's disease susceptibility loci in addition to APOE. Am J Hum Genet 83: 623-632.
- Griciuc A, Serrano-Pozo A, Parrado AR, Lesinski AN, Asselin CN, et al. (2013) Alzheimer's disease risk gene CD33 inhibits microglial uptake of amyloid beta. Neuron 78: 631-643.
- Zhang C, Browne A, Child D, Divito JR, Stevenson JA, et al. (2010) Loss of function of ATXN1 increases amyloid beta-protein levels by potentiating beta-secretase processing of beta-amyloid precursor protein. J Biol Chem 285: 8515-8526.
- Gabig M, Wegrzyn G (2001) An introduction to DNA chips: Principles, technology, applications and analysis. Acta Biochim Pol 48: 615-622.
- Babu MM (2004) An introduction to microarray data analysis. In computational genomics: Theory and application. Edited by Grant RP. Cambridge: Horizon Bioscience 2004: 225-249.
- Taniguchi M, Miura K, Iwao H, Yamanaka S (2001) Quantitative assessment of DNA microarrays--comparison with Northern blot analyses. Genomics 71: 34-39.
- Wu ML, Chang CH, Liu RZ, Fan TK (2012) Aggregate two-way co-clustering of ads and user data for online advertisements. Journal of Information Science and Engineering 28: 83-97.
- Podtelezhnikov AA, Tanis KQ, Nebozhyn M, Ray WJ, Stone DJ, et al. (2011) Molecular insights into the pathogenesis of Alzheimer's disease and its relationship to normal aging. PLoS One 6: e29610.
- Hu B, Jiang G, Pang C, Wang S, Liu Q, et al. (2013) Assessment of gene order computing methods for Alzheimer's disease. BMC Med Genomics 6 Suppl 1: S8.
- Blalock EM, Geddes JW, Chen KC, Porter NM, Markesbery WR, et al. (2004) Incipient Alzheimer's disease: Microarray correlation analyses reveal major transcriptional and tumor suppressor responses. Proc Natl Acad Sci 101: 2173-2178.
- Godoy JA, Rios JA, Zolezzi JM, Braidy N, Inestrosa NC (2014) Signaling pathway cross talk in Alzheimer's disease. Cell Commun Signal 12: 23.
- Tarawneh R, D'Angelo G, Crimmins D, Herries E, Griest T, et al. (2016) Diagnostic and prognostic utility of the synaptic marker neurogranin in Alzheimer disease. JAMA Neurol 73: 561-571.
- Chen J, Qi Y, Liu CF, Lu JM, Shi J, et al. (2018) MicroRNA expression data analysis to identify key miRNAs associated with Alzheimer's disease. J Gene Med 2018: e3014.
- Harris RA, Tindale L, Cumming RC (2014) Age-dependent metabolic dysregulation in cancer and Alzheimer's disease. Biogerontology 15: 559-577.
- Hong K, Zhao G, Hong Z, Sun Z, Yang Y, et al. (2016) Mechanical activation of angiotensin II type 1 receptors causes actin remodelling and myogenic responsiveness in skeletal muscle arterioles. J Physiol 594: 7027-7047.
- Hung AY, Haass C, Nitsch RM, Qiu WQ, Citron M, et al. (1993) Activation of protein kinase C inhibits cellular production of the amyloid beta-protein. J Biol Chem 268: 22959-22962.
- Saavedra JM (2016) Evidence to consider angiotensin II receptor blockers for the treatment of early Alzheimer's disease. Cell Mol Neurobiol 36: 259-279.
- Zeng L, Webster SV, Newton PM (2012) The biology of protein kinase C. Adv Exp Med Biol 740: 639-661.
- Kennedy MA, Moffat TC, Gable K, Ganesan S, Niewola-Staszkowska K, et al. (2016) A Signaling Lipid Associated with Alzheimer's Disease Promotes Mitochondrial Dysfunction. Sci Rep 6: 19332.
- Zhang X, Feng ZJ, Chergui K (2015) Induction of cannabinoid- and N-methyl-D-aspartate receptor-mediated long-term depression in the nucleus accumbens and dorsolateral striatum is region and age dependent. Int J Neuropsychopharmacol 18.
- Kellogg R, Mackie K, Straiker A (2009) Cannabinoid CB1 receptor-dependent long-term depression in autaptic excitatory neurons. J Neurophysiol 102: 1160-1171.
- Dong Z, Bai Y, Wu X, Li H, Gong B, et al. (2013) Hippocampal long-term depression mediates spatial reversal learning in the Morris water maze. Neuropharmacology 64: 65-73.
- Bertoni-Freddari C, Fattoretti P, Casoli T, Di Stefano G, Balietti M, et al. (2009) Neuronal apoptosis in Alzheimer's disease: The role of age-related mitochondrial metabolic competence. Ann N Y Acad Sci 1171: 18-24.
- Obeid OA (2013) Low phosphorus status might contribute to the onset of obesity. Obes Rev 14: 659-664.
- Li T, Xie Y, Bowe B, Xian H, Al-Aly Z (2017) Serum phosphorus levels and risk of incident dementia. PLoS One 12: e0171377.
- LaFerla FM (2002) Calcium dyshomeostasis and intracellular signalling in Alzheimer's disease. Nat Rev Neurosci 3: 862-872.
- Arbel-Ornath M, Hudry E, Boivin JR, Hashimoto T, Takeda S, et al. (2017) Soluble oligomeric amyloid-beta induces calcium dyshomeostasis that precedes synapse loss in the living mouse brain. Mol Neurodegener 12: 27.
- Magi S, Castaldo P, Macri ML, Maiolino M, Matteucci A, et al. (2016) Intracellular calcium dysregulation: Implications for Alzheimer's disease. Biomed Res Int 2016: 6701324.
- Alzheimer's Association Calcium Hypothesis W (2017) Calcium Hypothesis of Alzheimer's disease and brain aging: A framework for integrating new evidence into a comprehensive theory of pathogenesis. Alzheimers Dement 13:178-182 e117.
- Birnbaumer L, Qin N, Olcese R, Tareilus E, Platano D, et al. (1998) Structures and functions of calcium channel beta subunits. J Bioenerg Biomembr 30: 357-375.
Citation: Pang C, Yang H, Hu B, Wang S, Chen M, et al. (2019) Identification and Analysis of Alzheimer’s Candidate Genes by an Amplitude Deviation Algorithm. J Alzheimers Dis Parkinsonism 9: 460. DOI: 10.4172/2161-0460.1000460
Copyright: © 2019 Pang C, et al. This is an open-access article distributed under the terms of the Creative Commons Attribution License, which permits unrestricted use, distribution, and reproduction in any medium, provided the original author and source are credited.
Select your language of interest to view the total content in your interested language
Share This Article
Recommended Journals
Open Access Journals
Article Tools
Article Usage
- Total views: 5903
- [From(publication date): 0-2019 - Nov 15, 2025]
- Breakdown by view type
- HTML page views: 4934
- PDF downloads: 969