Research Article Open Access
Household Energy Consumption Patterns in Tanzania
Lusambo LP*Department of Forest Economics, Faculty of Forestry and Nature Conservation, Sokoine University of Agriculture, Morogoro, Tanzania
- *Corresponding Author:
- Lusambo LP
Department of Forest Economics
Faculty of Forestry and Nature Conservation
Sokoine University of Agriculture
Morogoro, Tanzania
Tel: +255 23 260 3511
E-mail: lusambo_2000@yahoo.com
Received date: October 13, 2015; Accepted date: March 31, 2016; Published date: April 07, 2016
Citation: Lusambo LP (2016) Household Energy Consumption Patterns in Tanzania. J Ecosys Ecograph S5:007. doi:10.4172/2157-7625.S5-007
Copyright: © 2016 Lusambo LP. This is an open-access article distributed under the terms of the Creative Commons Attribution License, which permits unrestricted use, distribution, and reproduction in any medium, provided the original author and source are credited.
Visit for more related articles at Journal of Ecosystem & Ecography
Abstract
Tanzanian households depend primarily on wood fuel as a source of energy. However, the consumption patterns and intensities remain poorly understood. The aim of the present study was therefore to provide a better understanding of households’ fuel consumption. Stratified random sampling design was used in order to capture fuel consumption patterns between rural, peri-urban and urban populations and across household wealth categories. Households in each randomly selected site were stratified into low, medium and high wealth categories. Data was collected using pre-tested and pilot-tested questionnaires, direct measurements, direct observations, interviews and focus group discussions. A total of 568 households were sampled: rural (258); peri-urban (177) and urban (133). This sample was drawn from across all wealth categories: low-198 households (34.9%); medium-255 households (44.9%) and high-115 households (20.2%). Several hypotheses were found to be true: (1) Socio-economic and demographic factors have effects on household fuel choice; (2) There is significant household preference to miombo woodlands as source of wood fuel. Factors which were found to be important in influencing choice of fuel are: location of household, residence ownership, dwelling category, household income, and education level of household head; (3) Household survey revealed a sizeable preference towards miombo woodlands as a source of wood fuel. Household dependency on wood fuel is overwhelming and is likely to remain so for the foreseeable future. Promotion of improved wood fuel stoves and improved charcoal making kilns, electrification, and promotion of alternative sources of fuel are shown to alleviate the problem.
Keywords
Household; Energy; Consumption
Introduction
An overview of energy (fuel) consumption
Global energy consumption: The pivotal role played by energy in economic growth and improving livelihood has been highlighted by many authors (e.g. Alabe [1]; Jamal [2]; Leach and Gowman [3]; TaTEDO [4]; Thomas [5]; UN [6,7]; Panayotou [8]; Attigah and Mayer- Tasch [9]; OECD [10]; World Economic Forum [11]). Similarly, the importance of forests to human life has been unequivocally pointed out (e.g. Zhao et al. [12]; G8 [13]; Malhi and Grace [14]). The most pervasive challenge associated with energy consumption is how to access energy on terms that facilitate economic growth while respecting environmental integrity [15]. Biomass fuel deserves a special focus in the global energy consumption equation as it (biomass) accounts for a significant proportion of total energy consumption: 14% globally [16,17], 3% in developed countries, 35% in developing countries [18,19], 60-95% in the poorest developing countries, 25-60% in middle-income countries, and <5% in high-income industrialised countries [20]. The percentage of total wood used for fuel is variable across the globe [21,22]: Africa and Latin America 90%, Asia 65%, Europe 25% and North America 10%. Per-capita energy consumption for 2001 globally was 1,146 kgoe (equivalent to 48,132 MJ) compared to 476.06 kgoe (Kilogramme of Oil Equivalent) (equivalent to 19,995 MJ) in Africa [23]. According to IEA [24] and Timmons [25], biomass accounts for 10% of world primary energy supply and is the world’s largest single renewable energy source, since much of the world’s population uses wood, charcoal, straw, or animal dung as cooking fuel. In most SSA countries, the wood-based biomass energy sector employs a significant workforce, providing regular income to tens-if not hundreds-of thousands of people [26].
Statistics for people relying on biomass fuels are variable: According to IEA [27] nearly 2.5 billion people rely on biomass for cooking and heating, and the figure is anticipated to increase to 2.6 billion people by year 2030. Kandpal and Maheshwari [28] reported that biomass fuels are used by 50% of the global population as a major, and sometimes, the only source of domestic energy for cooking and heating. World Bank [29] estimated the number of poor people depending on forest resources to be 1.6 billion. The hitherto great dependence on biomass fuel can arguably be partially attributed to poor access to electrictrity. According to IEA [27] there is a significant inequality with regard to electrification status. Globally, 72.8% of overall population have access to electricity; in urban areas, 91.2% of population have access to electricity; and in rural areas 56.9% of the population have access to electricity. For Africa, overall is 34.36%; for urban areas 63.1%; and rural areas 16.9%. For Sub-Saharan Africa overall it is 22.6%; for urban 51.3%; and rural 7.5% (Figure 11).

Figure 11: Households’ wood fuel preference in the study area.
Energy consumption is linked to environmental and health problems. The literature [2,4,30-32] suggest that the current energy consumption pattern which relies chiefly on fossil fuels (for developed countries) and on biomass (for developing countries), significantly erodes environmental sustainability at the local, national and global levels. According to Toman [15] serious discussion about climate change invariably involves serious discussion about energy consumption. Hernoe [33] highlights the main pollutants associated with energy consumption: CO2, CH4 and N2O which have direct greenhouse effect; CO, NOX and NMVOC which are indirect greenhouse gases; SOX and particulate matters. The author points out that NOX and SOX cause acidic rain, while CO and particulates have negative health effects. Toman [15] emphasizes that any attempt to curb CO2 emission which fails to consider the need for change in energy production and consumption is likely to be futile.
According to overwhelmingly available scientific evidence, devastating impacts of climate change on the world’s economy and people’s lives are unequivocal [12,34-36]. It is also reported that while burning of solid fuels for warmth, security and cooking is as old as humanity, recent work on the epidemiology of respiratory infections reveals that burning solid fuels in poorly ventilated indoor spaces causes serious health problems [37]. According to a report by WHO [38], nearly 1.6 million people, mostly from developing countries, die annually as a result of indoor air pollution from cooking with solid fuels. Jack [39] further elaborates: adult women suffer disproportionately because they do most of the cooking and thus inhale more smoke than men. Children tend to be near their mothers, so are more likely to develop diseases in response to a given exposure.
According to Ozer [40], the current and reliable data on wood fuel consumption and its impact on environment are lacking because of poor forest cover inventories. Global forests are disappearing faster than they are being replaced [34,41]. Price [42] categorises the causes of deforestation into two main groups: non-economic causes - volcanoes, earthquakes, storms, fire, natural climate change; and economic causes - market failure, pollution, agricultural activities, anthropogenic climate change, corruption and common property resources. Globally, deforestation has become one of the most serious threats to biodiversity conservation, livelihood systems, ecosystem functions, peoples’ welfare and sustainable development [43-45].
Mugo and Ong [46] estimated that about 3.5 billion metric tonnes of carbon accumulate in the atmosphere annually. Woomer indicated the importance of forests for carbon sequestration: one hectare of forest can offset between 160-200 metric tonnes of carbon a year. Deforestation contributes to global warming albeit the reported actual contribution varies considerably: IPCC [24,46,47] reports that deforestation accounts for 20-25% of global CO2 emission; UK (2006) reports contribution of 20% of total global CO2 emission; Houghton et al. [48] estimates global contribution to total CO2 of 22% while Nepstad et al. [49] asserts that figures of CO2 emission due to tropical deforestation are underestimated by 50%. Varying statistics are also noted in the annual global rates of deforestation: FAO [50] estimates a global deforestation rate at 13.5 million ha/year. Matthews estimates the rate to be 16 million ha/year. FAO [51] estimates global deforestation rate at 9.4 million ha/year, while UN [35] asserts that between 1990- 2005, the world has lost 3% of its forest, which is an average decrease of 0.2% per year. FAO [51] estimated that 11.3 million ha were annually lost due to inter alia, wood fuel consumption; and 90% of the cleared land was never replanted. Globally, South America has still the highest percent of forests and woodlands, but also the highest of real decrease of 4% of its forest over a span of 17 years [21].
Energy consumption in developing countries: In developing countries, household energy sector has become the focus of increasing concerns and attention [2,52-54]. In the field of energy, developing countries are faced with a two-edged sword [53,55-58]: escalating prices for fossil fuels, and deforestation due to overexploitation of wood fuels. Arnold et al. [55] argued that while in industrialised countries wood-based fuels have long been replaced by more efficient and convenient sorces of fuel, in developing regions, less able to afford and access alternative sources of fuel, wood has remained the dominant fuel. Heavy dependence on biomass fuel in developing countries is causing serious deforestation [59,60], constrains the delivery of social services, limits opportunities for women, and hampers the achievement of Millennium Development Goals (MDGs) [4,61]. Wood fuel is the second major cause of deforestation throughout the developing world, and is exacerbated by the hitherto increasing population pressure [62]. Nearly two million metric tonnes of wood fuel (firewood and charcoal) are consumed daily in developing countries [40]. It is estimated that 1.8 billion rural people in developing countries use straws as their domestic fuel source [63]. It is further reported that 2.5 billion people in developing countries depend on biomass to meet their energy needs; and that, in absence of appropriate policies, the number will increase to over 2.6 billion by 2015 and to 2.7 billion by 2030 because of population growth [64]. In tropical Africa, deforestation is a widespread phenomenon and occurs at a rate of between 1.3-3.7 million ha/year [65]. Resource consumption in developing countries has been the focus of a considerable number of researches, but the feedback effect of the resource consumption on the resource availability to both households and community has been understudied [66].
Energy consumption in Sub-Saharan Africa: In Sub-Saharan Africa (SSA), land degradation due to inter alia, agricultural activities, firewood extraction and charcoal production, mining, human settlement, infrastructural and industrial development is one of the biggest problems threatening the lives of many people [67]. Chamshama and Nduwayezu [68] assert that in SSA there is a continued population-poverty-environmental degradation vicious cycle. While Blay et al. [69] estimate that >90% of moist forests in SSA has been lost or become degraded, and estimate the deforestation rate in the region to be between 0.1-10%, [70] claims that patterns of wood fuel production and consumption in SSA and their consequent economic and environmental impacts are site specific. According to UN [35], deforestation, unemployment of youth and gender inequalities are some of the pervasive obstacles for achieving the MDGs in SSA and Asia. Malimbwi et al. [71] revealed that in the Southern Africa Development Community SADC region, households consume 97% of wood energy, mostly for cooking and heating. Schlag and Zuzarte [72] reported that 76% of SSA population depend on traditional biomass as their primary energy source. Reddy [73] and Ramachandra et al. [74] have argued that in SSA, the percent of households using wood fuel varies from 86% to 99% in rural areas; and from 26% to 96% in urban areas. Overall, according to Reddy [73] and Ramachandra et al. [74] (ibid), 94% of African rural population and 73% of urban population use wood fuel as their primary source of energy, mainly in the form of firewood in rural areas and charcoal in urban areas-noting further that the disparity in energy uses exists between rural and urban and also between high- and low-income groups.
Forests and energy consumption in Tanzania: Tanzania is endowed with forest and woodlands resources. Forest resource statistics in Tanzania have been reported by various sources: FAO [75] and URT [34] indicated that forest resources amount to 33.5 million ha. FAO [76] give estimates of 38.5 million ha; Malimbwi [71] estimate forest resources to be 34 million ha; while FAO [77,78] estimate forest resources in year 2005 to be 35.257 million ha. According to Monela and Abdalla [79] conservative estimates indicate that Tanzania has forests and woodlands occupying a total of 33.5 million hectares of the land area. NAFORMA field inventory has determined the area of forest and woodlands of Tanzania mainland to be 48.1 million ha. This is 42 % larger than earlier projections. NAFORMA is the first ever ground based national forest inventory in Tanzania mainland and the differences with earlier estimates shows that ground measurements are essential for accurate forest inventories. Basing on the 2012 census, the population of Tanzania mainland is 43.6 million therefore; the per capita area of forest and woodland is 1.1 ha [80,81]. The author has reported a deforestation rate (1995-2010) of 372, 816 ha/year translating to wood deficit of 19.5 million m3. Morgan-Brown [82] has estimated deforestation rate between 2008 – 2010 at a rate of 2.4%.
As summarised in Table 1, they comprise of high closed forests, closed and open miombo woodlands, and coastal mangroves. Out of 33.5 million ha, 12.5 million ha are set aside and gazetted as production and protection forests and woodlands reserves, of which, 11.9 million ha are under the central government’s Forestry and Beekeeping Division and 0.6 million ha are under village council (local governments). This implies that about 21 million ha of forests and woodlands are unreserved forest lands under private management by farmers, which have become to be known as forests on general land. Extensive miombo woodlands are unique forest ecosystem are available in this huge forest resource endowment, and are potentially a very useful frontier for economic development [79].
| Forest land type, use and legal status | Area (1000 ha) |
|---|---|
| Type | |
| Closed forest | 1.1 |
| Miombo woodlands | 32.3 |
| Mangrove | 0.1 |
| Total | 33.5 |
| Use | |
| Production forests and woodlands | 23.8 |
| Protection forests and woodlands | 9.7 |
| Total | 33.5 |
| Legal status | |
| Forest and woodland reserve | 12.5 |
| Forest and woodland reserve within the national park, etc. | 2.0 |
| Unreserved forest and woodland | 19.0 |
| Total | 33.5 |
Source:Monela and Abdalla[79]
Table 1: Tanzanian forests and woodlands.
As for the aspect of forest resources management, Saucer and Abdalla [83] reported that miombo woodlands in Tanzania are managed as general land forests, family forests, forest reserve under government management, and local authority reserves which are under local district authority. Zahabu et al. [84] further explained that 47% of Tanzanian forests are under reserve forests, 6% are in National parks and 47% are unprotected forests in general land. Many people perceive general land (common pool resource) as an “open access”— the concept which, according to Quinn et al. [85] is not necessarily true all the time: “it is now recognised that common pool resources are not always open access. Instead, common property regimes exist where there is shared ownership and rules that dictate each resource user’s access and use of resources”.
Tanzanian energy balance is dominated by biomass-based fuels, particularly wood fuel (firewood and charcoal) which account for >90% of primary energy supply, estimated at 1 m3 of round wood capita-1year-1. Petroleum energy account for 8%, electricity for 1.2%, while solar and wind account for <1% [30,52,71,86-91]. Approximately 50% of all Tanzanians live in a poor condition while 36% live in abject poverty; nearly 60% of rural population is poor compared with 39% of urban population [35]. More than 90% of population have very low purchasing power, a situation which exacerbates their heavy dependency on wood fuel [30,71,86,89]. According to Schlag and Zuzarte [72], 77.8% of Tanzanians depends on traditional biomass as their primary energy source. Boberg [92] reported that 84% of the Tanzanian urban population use wood fuel. Other literature [30,71,88] underscore that nearly 95% of Tanzanian wood products (mainly from natural forests) are used for energy purposes. Sanga [90] pointed out that 90% to 100% of total household energy in most of the poor households in developing countries is used for cooking and heating.
Tepliz-sembitzky [93] asserts that reliance on traditional biomass is not only the result of poverty, but it may act as a barrier to poverty alleviation or may even be a factor contributing to adverse living conditions. According to Carissa et al. [94], ability of forests to continue providing Tanzanians with energy is highly compromised by unsustainable wood fuel consumption. Poor households in Tanzania spend between 28-34% of their income for cooking and lighting energy [95,96]. Miombo woodlands which constitute 90% of all forested land in Tanzania [97] are the main source of energy [32,71,88,98,99] and constitutes 70% of total urban wood energy requirements [71] and 95-98% of rural energy consumption with consequent adverse environmental impact [4,30,85,86,99].
Problem statement and Justification of the study
Problem statement: Rigorous literature search reveals that in Tanzania, no detailed study has been conducted to establish patterns and intensities of household energy consumption. This is underpinned by a number of studies: Sawe asserts that there is inadequate data on Tanzanian rural energy consumption; little is known about economics of household energy consumption in developing countries [100,101] reported that in most of the developing countries the drivers behind household energy consumption patterns are poorly understood. Understanding household energy consumption intensities is paramount in assessing energy efficiency development [100,102,103]. The perceived government apathy in addressing household energy issues may be attributed to quality and amount of available data on household energy consumption, because poor quality and unavailability of baseline data on energy consumption seriously impedes energy planning and policy-related work [5,86] and environmental protection [34] insisted that in order to accomplish the MDGs, reliable and timely relevant information is pre-requisite. The aim of the present study was therefore to analyse the patterns and intensities of household energy consumption in miombo woodlands of eastern and southern Tanzania, using Morogoro and Songea regions as study areas.
Justification of the study
Significance of the study findings: The findings of this study will contribute to efforts towards development of efficient and modern energy services and consequently curb environmental problems and foster improved livelihoods of the poor households. Policy and decision makers will make use of the findings from this study to devise shortterm, medium-term and long-term strategies for sustainable natural resource management. The public will also be made more aware of the situation on the ground and thus facilitate positive changes in their energy-related behaviour and way of thinking and attitudes; and for prudent environmental management.
Why focus on the consumption side? : At a conceptual level, both economic and political emphases of any nation are on consumers as the ultimate target. While economics deals with the allocation of scarce resources among consumers’ competing wants [41], people’s welfare is the central concern of the political systems. Thus placing the consumer in the focus of interest sounds non-inconsequential as may contribute to a significant thrust on the side of politicians as far as energy issues are concerned, and may provide the common perspective for experts from various disciplines as well as decision makers and the wider public [100].
Why study the household sector? : The household sector consumes the greatest proportion of total energy across the globe. It accounts for 25-30% of total energy in developed countries, 30-95% of total energy in developing countries, and 50-95% of total energy in Sub-Saharan Africa [3,104,105]. In Tanzania, the household sector accounts for 80- 91% of total energy consumption in the country [30,86,89,106,107]. Statistics further reveal that in sub-Saharan Africa (SSA) household cooking alone takes up to 60-80 per-cent of the total national energy use [108]. In SADC region, households consume 97 per-cent of wood energy for cooking, heating and cottage industries [109].
Why study in Miombo woodland? : The Miombo woodlands that constitute >90% of total forest area in Tanzania are chief sources of firewood (fuel wood) and charcoal. The hardwoods from natural forests produce a heavier and more concentrated fuel than most fast growing softwood species [71,83,99,110]. An extensive body of literature [18,99,111,112] underlines that people prefer using natural forests (hardwood) to plantation forests (which are mainly softwood), as wood fuel for several reasons. Lusambo [99] found that some people prefer natural forests because they collect it free of charge, while others assert that, unlike softwood, hardwood is denser and thus it burns for a longer period. Demirbas [113] puts forward that the salient factors that affect the suitability of wood for fuel include moisture content (the higher the moisture content, the lower the energy value), extractives (the more the extractives, the higher the energy value) and ash content (the energy value increases inversely with ash content). The author (ibid) underlines that in light of the above-mentioned factors, hardwood is preferred as source of fuel to softwood. Nonetheless, he cautions that if one singles out extractive content, then softwood performs better than hardwood. Demirbas [18] explains that the net energy available from biomass when it is converted ranges from about 8 MJ kg-1 for green wood, to 20 MJ kg-1 for air dried, implicitly supporting the concept that energy value of wood increases as moisture content decreases.
According to Kofman, firewood from hardwood has a higher heating value per m3 due to higher density. He further points out that the amount of dry matter per m3 varies with plant species and ranges between 340-590 kg dry matter/m3 solid (for hardwood species) and 350-480 kg dry matter/m3 solid (for softwood species). The findings further revealed that hardwoods generally have natural moisture content of between 40 and 50%, while softwoods have moisture content of between 50 and 60%. The author comments that on a dry-weight-forweight basis, both hardwood and softwood are good fuel sources. Kelly and Tom assert that hardwoods are preferred as sources of fuel, because they have high net energy value attributable to lower moisture content and higher density. According to the authors, the net energy value for hardwood ranges from 10.8 to 12.7 MJ kg-1 while that of soft wood is from 5.7 to 10.4 MJ kg-1. During their study, Mansilla et al. [112] found that if assessed on a volume basis [which is the mostly used criterion by households Lusambo [99], hardwood is a better source of fuel wood than softwood. The study also revealed that even among hardwoods, natural hardwoods have, on average, higher energy value than exotic hardwoods (Table 2). But if assessed on a weight basis, there is no significant difference in terms of the magnitude of their energy values.
| Species | Ash (%) | Extractive (%) | Lignin (%) | Cellulose (%) | Holocellulose (%) | Density (kg/m3) | Energy value (MJ/kg) | Energy value (MJ/m3) |
|---|---|---|---|---|---|---|---|---|
| W1 | 0.46 | 1.8 | 27.5 | 45.6 | 73.8 | 370 | 19.49 | 7,217 |
| W2 | 0.36 | 4.1 | 26.4 | 39.6 | 72.5 | 490 | 20.05 | 9,825 |
| W3 | 0.57 | 3.1 | 22.7 | 38.8 | 76.5 | 440 | 19.66 | 8,650 |
| W4 | 0.34 | 5.1 | 20.0 | 43.3 | 76.5 | 710 | 18.97 | 13,469 |
| W5 | 0.62 | 6.1 | 19.4 | 38.5 | 81.1 | 470 | 19.58 | 9,203 |
| W6 | 0.80 | 3.9 | 26.9 | 48.5 | 76.1 | 590 | 19.83 | 11,700 |
| W7 | 1.18 | 7.9 | 18.8 | 39.6 | 68.1 | 660 | 18.96 | 12,514 |
| W8 | 1.96 | 8.2 | 25.5 | 39.4 | 69.8 | 560 | 18.69 | 10,466 |
| W9 | 1.97 | 8.0 | 21.0 | 39.9 | 69.3 | 580 | 17.46 | 10,127 |
| W10 | 3.64 | 9.8 | 22.9 | 41.1 | 67.9 | 790 | 19.13 | 15,128 |
Key:
W1:Pinusradiata(softwood); W 2: Acacia melanoxylon(exotic hardwood)
W 3: Acacia dealbata(exotichardwood); W4: Eucalyptus globulus(exotic hardwood)
W5 :Nothofagusobliqua(native hardwood);W 6: Nothofagusglauca(native hardwood)
W 7: Lithraeacaustica(native hardwood);W 8: Quillajasaponaria(native hardwood)
W 9: Co~ptocarya alba (native hardwood); W 10:Acacia caven(native hardwood)
Table 2: Comparison of wood energy values.
FAO [114] points out that a study of traditional charcoal-making practices throughout the developing world indicates clearly that the preferred forest type for charcoal-making is dry, well stocked savanna forest rather than dense, humid rainforest. Savanna forests are preferred for a number of reasons: the wood is usually dense, slow-growing and highly lignified, which gives a good charcoal yield when carbonised. The terrain is usually easy, which simplifies harvesting. A short wet season, and a correspondingly long dry season, makes it possible that the charcoal-making operation can continue most of the year and fuelwood dries out quickly with minimum loss through insect attack and fungal decay. According to the author, the classic charcoal production areas of Africa, South America and Asia are nearly all savanna type forests.
On the other hand, in a wet humid climate the fuel-wood is mostly of low to medium density, not highly lignified and commonly prone to rapid decay and attack by insects. The rainy season is longer and more severe and, in some areas, there may be two rainy seasons per year which makes it very difficult to dry the fuel wood before carbonisation. Instead, the firewood usually rots or is destroyed by insects before it dries sufficiently for optimum carbonisation. Therefore, when making charcoal in humid tropical rainforest it is necessary to carbonise the wood at higher initial moisture content than is typical in savanna-type forest. This avoids the wood deterioration as it is left to dry only a few weeks before carbonation. Consequently, the yield is lower because more wood is must be burnt in the kiln to dry out the wood before carbonisation can start.
Why Morogoro and Ruvuma Regions? : It sounds unreasonable to select the study area for research using a random sampling technique; one should make use of the available information that might quite logically guide the choices [115]. In Tanzania, there are seventeen regions with Miombo woodlands [116,117]. Selection of Morogoro and Ruvuma as study regions was guided by Carissa et al. [94] who carried out a deskwork study (based on an extensive literature review) to identify the regions within the country where critical ecosystem services for human well-being are stressed, signalling the need for immediate attention. The ecosystems functions covered were biodiversity, energy resources, water, and food and fibre production. It was envisaged that the findings of the study would inform and guide the selection of potential areas where a more detailed local-scale integrated assessment of the links between ecosystem services and human well-being can be carried out. The study established that Morogoro is a priority region for ecosystems-related researches, because it is stressed in all the four ecosystem services. It also established that Ruvuma Region has serious data gaps in all the above-mentioned ecosystem services. The present study therefore considered these two regions as research-priority areas.
Conceptual framework
Figure 1 shows a conceptual framework showing the salient factors affecting household energy consumption with consequent environmental impacts. This conceptual framework was used to determine the study variables. Thorough literature review from other previous authors, review of various consumption theories and reseacher’s personal Tanzanian experience were used to determine the study variables. Consequently, a total of 63 variables were captured in this study. In order to meticulously address the objectives of this study, the focus of the study was on four key issues: choice of energy options, energy consumption, energy expenditure (cost implications), and environmental impact of household energy consumption. According to Linda [118], the conceptual framework acts as a basis for discussing the relationships between different groups, individuals or issues and can always be progressively revisited as further information becomes available.

Figure 1: Conceptual framework for wood fuel consumption in Tanzania.
The understanding of household energy consumption in developing countries is mainly built on the concept of fuel substitution, commonly known as the energy ladder hypothesis [20,119-124]. The hypothesis postulates that as household socio-economic status rises, the household in question abandons lower-level energy source(s) and switches to modern ones. Another hypothesis that tries to describe the household energy consumption is the “inverted-U hypothesis” [125]. This hypothesis postulates that household energy consumption varies proportionally with per capita income up to a certain level after which it starts decreasing, thereby making an inverted-U shape graph. Energy consumption is also explained by a popularly used poverty– environment hypothesis which claims that poor people rely heavily on biomass fuels and thus causing forest degradation and deforestation; and that addressing poverty issues is the key for sustainable forest resources management [126]. When modelling household energy consumption, distinction should be made between direct energy use and indirect energy use. Direct energy use refers to the consumption of energy carriers purchased by the household itself (fuels and equipment) in order to cater for energy services. Indirect energy use refers to the energy used during various stages of production (and distribution) of commodities, also referred to as `embodied energy’ or ‘grey energy’ [100]. The present study strives to address households’ direct energy use.
Various studies have pointed out factors affecting household energy consumption [3,4,30]: current disposable income, household size, household type, fuel accessibility, fuel affordability, fuel reliability, fuel flexibility, low-pollution, climatic conditions, effective household size, dwelling type and ownership, household power relation; tradition and customs, stock of liquid assets (wealth); future income expectation, urban-rural location differences, and level of consumer indebtedness.
Objectives of the study
The specific objectives of the study were to:
a. Analyse patterns of households’ energy consumption;
b. Analyse factors influencing households’ energy (fuel) choice;
c. Investigate households’ preferences to woodfuel from natural forests.
Hypotheses of the study
This study puts forward the following main hypotheses a priori:
a. Household socio-economic and demographic factors have effect on fuel choice
b. Households have significant preference for miombo woodlands/natural forest wood fuel
Methodology
Study sites
This study was conducted in 2009 with households around and within the eastern and southern miombo woodlands in Tanzania: Morogoro and Songea districts in Morogoro and Ruvuma regions respectively (Figure 2). Each district was sub-divided into three strata: rural, peri-urban and urban areas; and sample households were drawn from each stratum.

Figure 2: Map of Tanzania showing the study sites.
In Morogoro Region, the annual rainfall ranges from 600 mm in lowlands to 1200 mm on the highland plateau. However, there are areas which experience exceptional droughts (with less than 600 mm of rainfall). The mean annual temperatures vary with altitude from the valley bottom to the mountain top: between 18°C on the mountains to 30°C in river valleys. In most parts of the region, the average temperatures are almost uniform at 25°C. The economy of the region is dominated by agriculture (80-90% of the region’s labour force) and allied activities. The major activities include: (i) small scale farming; (ii) cattle production; (iii) plantations and estates (sisal, sugar); (iv) traditional fishing; and (v) some mining activities.
In Ruvuma Region, rainfall starts in December and ends in April. Total average annual rainfall is over 1,200 mm and the amount varies between districts. For instance, Mbinga district has an annual average rainfall of 1,800 mm while Tunduru District receives an average rainfall of 918 mm. The cold period is between June and August with temperatures of approximately 11°C while the average annual temperature is approximately 22°C. The relative humidity ranges between 90% in March and 37% in October. The Ruvuma region is mainly agrarian where 87% of its population reside in rural areas and are actively engaged in land-based production. The major economic activities of the region are agricultural farming, livestock rearing, lumbering, fishing, bee keeping, mining and trading.
Study design
The design of the present study is a descriptive and analytic cross-sectional survey. It is a descriptive study because it sets out to rigorously describe household energy consumption patterns. It is an analytic study because it entailed testing a priori hypotheses related to household energy consumption in the study area. It is a one-time crosssectional study; it cannot therefore gauge the temporal variations or trends in the data collected.
Sample design
The sample design for the present study entailed nine steps (Figure 3). The overall objective was to have a study sample which is sufficient and representative of the target population.

Figure 3: Steps in sample design in the present study (adapted from Shisana et al. [152]).
The target populations for this study were households in Morogoro and Songea districts. The sampling frame was in three types depending on the sampling phase. During sampling of villages in rural areas and wards in peri-urban and urban areas, the sampling frame was the list of villages bordering the selected forests and list of wards in the municipalities respectively. During sampling of hamlets in rural areas and streets in peri-urban and urban areas, the sampling frame was the list of all hamlets in the selected villages and list of all streets in the selected wards respectively. When sampling households for the study, the sampling frames that were used are the updated lists of households registers in the sampled hamlets and streets. All chairpersons and executive officers in the selected study sites were asked to update lists of households in their respective areas by excluding households which no longer existed and/or adding those ones which were missing in their lists.
Stratified random sampling design was used in the present study. Stratification was carried out at two levels: (a) stratification of study sites in the study districts into rural, peri-urban and urban areas, and (b) stratification of respondents into wealth categories: low, medium and high. Figure 4 presents the approach used by the present study to stratify the study sites into rural, peri-urban and urban. Rural areas in the context of the present study refer to communities bordering the forests. Urban areas refer to the community residing fairly in the centre of municipality. Peri-urban areas refer to the areas geographically located within the municipality, but lying on its periphery.

Figure 4: Stratification of study sites in rural, peri-urban and urban.
Rural area sample selection: The first step was to get the list of all forests in each district, from respective District Forest Catchment Offices. The forests were then stratified into miombo woodlands and non-miombo forests. Where applicable, miombo woodlands were further grouped (stratified) into protective and productive miombo woodlands. One forest (miombo woodland) was randomly selected from each miombo woodlands stratum (Tables 3 and 4). Villages bordering the selected forests were operationally designated as rural areas. Out of villages bordering a selected forest, one village was randomly selected. Hamlet(s) were then randomly selected from each selected village. With the aid of village governments (through FGD), households in the selected hamlets were stratified into low-income, medium income and high-income. Finally, respondent households were randomly selected from each stratum using a random number table. Random selection of woodlands (forests), villages, and hamlets was made possible through the use of the playing cards method: the names of forests; villages or hamlets were written on the lower parts of the cards, the cards were then thoroughly mixed together, and the desired sample size randomly selected from the pool of the cards. Table 4 shows the number of respondent households sampled in rural areas of the study area.
| S/N | Forest Name | Area (ha) | Ownership | Vegetation type | Total volume (m3/ha) | |
|---|---|---|---|---|---|---|
| 1 | Miovu/Mwalazi General Land | 8350 | Village government | Low-land rainforest | 93.6 | |
| 2 | Shikurufumi Forest Reserve | 260 | Central government | Sub-montane forest | 750 | |
| 3 | Uluguru North Forest Reserve | 8356 | Central government | Sub-montane forest | 675 | |
| 4 | Uluguru South Forest Reserve | 17292 | Central government | Montane forest | 313.67 | |
| 5 | NguruyaNdege Forest Reserve | 3614 | Local government | Miombo-rainforest | 101.91 | |
| 6 | Ruvu Forest Reserve | 3093 | Central government | Miombo-rainforest | 244.2 | |
| 7 | Vigoregore Forest Reserve | 920.7 | Central government | Miombo-rainforest | 85.8 | |
| 8 | Mkungwe Forest Reserve | 1966.8 | Central government | Miombo-rainforest | 40.1 | |
| 9 | Pangawe East Forest Reserve | 768 | Local government | Miombo woodlands | 116.58 | |
| 10 | Pangawe West Forest Reserve | 184 | Central government | Miombo woodlands | 110.7 | |
| 11 | Dindili Forest Reserve | 1006.9 | Central government | Miombo woodlands | 37.7 | |
| 12 | Mindu Forest Reserve | 2285 | Central government | Miombo woodlands | 14.6 | |
| 13 | Kimboza Forest Reserve | 386 | Central government | Miombo woodlands | 231.6 | |
| 14 | Lubaranzi Forest Reserve | 28500 | Village &Local govt | Miombo woodlands | 53.8 | |
| 15 | Kilengwe Forest Reserve | 995 | Local government | Miombo woodlands | 127 | |
| 16 | Kitulangalo Forest Reserve | 2638 | Central government | Miombo woodlands | 59.6 | |
| 17 | Mkulanzi Forest Reserve | 68627 | Central government | Miombo woodlands | 172 | |
| Stratification of miombo wood lands | ||||||
| Productive miombo woodlands | Protective miombo woodlands | |||||
| 1 | Kilengwe Forest Reserve | Mindu Forest Reserve | ||||
| 2 | Kimboza Forest Reserve | Dindili Forest Reserve | ||||
| 3 | Lubaranzi Forest Reserve | |||||
| 4 | Kitulangalo Forest Reserve | |||||
| 5 | Mkulanzi Forest Reserve | |||||
| 6 | Pangawe East Forest Reserve | |||||
| 7 | Pangawe West Forest Reserve | |||||
| Randomly selected woodland | ||||||
| 1 | Kitulangalo Forest Reserve | Dindili Forest Reserve | ||||
| Surrounding villages | ||||||
| 1 | Gwata | Fulwe | ||||
| 2 | Maseyu | Mikese | ||||
| 3 | Lubungo | |||||
| Randomly selected village | ||||||
| 1 | Maseyu | Fulwe | ||||
| Randomly selected hamlets | ||||||
| 1 | Kitulangalo | Dindili | ||||
| 2 | Ng’ambala | Ulundo | ||||
*Note: Useful information n of the forests was obtained from Malimbwi et al. [150]
Table 3: Stratification of forest and woodlands resources in Morogoro District*.
| S/N | Forest Name | Year | Area (ha) | Ownership | Vegetation type | ||
|---|---|---|---|---|---|---|---|
| 1 | LihanjeFoest Reserve | 15.09.2000 | 10565 | Local government | Miombo woodlands | ||
| 2 | Litenga Forest Reserve | (proposed) | 4795 | Central government | Miombo woodlands | ||
| 3 | Songea Fuel wood Forest Reserve | 27.01.1956 | 5180 | Central government | Miombo woodlands | ||
| 4 | Wino Forest Reserve | 26.05.1989 | 2259 | Central government | Miombo woodlands | ||
| 5 | Igawisenga Forest Reserve | 28.08.1998 | 36 | Central government | Miombo woodlands | ||
| 6 | Chabruma Forest Reserve | 28.08.1998 | 193 | Central government | Miombo woodlands | ||
| 7 | Gumbiro Forest Reserve | 13.03.1959 | 17.4 | Local government | Miombo woodlands | ||
| 8 | Matogoro (E &W ) Forest Reserve | 06.11.1951 | 3723.2 | Central government | Miombo woodlands | ||
| 9 | Maposeni Forest Reserve | 19.12.1958 | 173.6 | Local government | Miombo woodlands | ||
| 10 | Machinjioni Forest Reserve | 28.08.1998 | 236 | Central government | Miombo woodlands | ||
| Randomly selected woodlands | |||||||
| 1 | Songea Fuel wood Forest Reserve | ||||||
| 2 | Matogoro (East &West ) Forest Reserve | ||||||
| Villages surrounding the woodlands | |||||||
| Woodland | Surrounding villages | ||||||
| 1 | Songea Fuel wood Forest Reserve | 1.Luhimba | |||||
| 2. Mtyangimbole | |||||||
| 3.Likalangilo | |||||||
| 2 | Matogoro (E &W ) Forest Reserve | 1.Ndilimalitembo | |||||
| 2.Mpingi | |||||||
| 3.Lipaya | |||||||
| Randomly selected Village | |||||||
| Woodland | Selected Village | ||||||
| 1 | Songea Fuel wood Forest Reserve | Mtyangimbole | |||||
| 2 | Matogoro (E &W ) Forest Reserve | Ndilimalitembo | |||||
| Randomly selected hamlet | |||||||
| Village | Hamlet | ||||||
| 1 | Mtyangimbole | Kanisani | |||||
| 2 | Ndilimalitembo | Ndilimalitembo | |||||
*All the forest reserves in the District are productive
Source:Songea District Catchment Forest Office (21.06. 2007)
Table 4: Stratification of forest resources in Songea District*.
Urban area sample selection: The municipalities in each district were operationally designated as urban areas. The list of all wards in the municipality (urban area) was sought. The wards which are within the municipality, but are located on the periphery (i.e. bordering the municipality), were excluded from the list. One ward was then randomly selected from the remaining list. Subsequently, one street (equivalent to hamlet in rural areas) was randomly selected from the list of the ward’s streets. Households in the selected street were, as in the case of rural areas, stratified into wealth categories: low, medium, and high. Respondent households were then randomly selected from each stratum. A random number table was used to select respondent households. Random selection of wards and streets was made possible through the use of the playing card method. Table 5 presents the respondent households sampled in rural areas.
| Morogoro District | Songea District | |
|---|---|---|
| Number of natural forests | 17 | 10 |
| Number of miombo woodlands | 9 | 7 |
| Randomly selected miombo woodlands | Dindili FR | SongeaFuelwood FR |
| Kitulangalo FR | Matogoro FR | |
| Total villages surrounding selected wood lands | Dindili FR = 2 | SongeaFuelwood FR= 3 |
| Kitulangalo FR = 3 | Matogoro FR= 3 | |
| Randomly selected village | Fulwe (Dindili FR) | Mtyangimbole (Songea FW FR) |
| Maseyu (Kitulangalo FR) | Ndilimalitembo (Matogoro FR) | |
| Total hamlets in selected village | Fulwe = 8 | Mtyangimbole= 4 |
| Maseyu = 5 | Ndilimalitembo= 3 | |
| Randomly selected hamlet | Maseyu : Dindili | Mtyangimbole : Kanisani |
| : Ulundo | ||
| Fulwe : Ng’mbala | Ndilimalitembo : Ndilimalitembo | |
| : Kitulangalo | ||
| Total households in selected hamlet | Dindili = 39 | Kanisani = 45 |
| Ulundo= 68 | Ndilimalitembo= 59 | |
| Ng’mbala= 36 | ||
| Kitulangalo= 45 | ||
| Number of randomly sampled households | Dindil = 35 | Kanisani= 40 |
| Ulund = 58 | Ndilimalitembo= 51 | |
| Ng’mbala= 33 | ||
| Kitulangal = 41 | ||
| Total sampled households | 167 | 91 |
Table 5: Sampled households in rural areas of the study area.
Peri-urban area sample selection: All the wards within the municipalities which are located on the periphery of the municipalities were designated as peri-urban areas. Selection of peri-urban ward was purposeful. The selected peri-urban ward had to be in closest proximity with the selected forest (in relation to other peri-urban wards). The study “street(s)” within the selected peri-urban ward was randomly selected using a playing card technique. The households within the selected street were accordingly stratified into low-wealth category, medium-wealth category, and high-wealth category; and subsequent respondent households were randomly selected from each stratum. Table 6 presents the households sampled in urban areas. While Table 7 presents sampling of households in peri-urban areas of the study area.
| Morogoro District | Songea District | |
|---|---|---|
| Number of wards | 15 | 9 |
| Randomly selected ward | Kihonda | SongeaMjini |
| Number of streets in selected ward | 8 | 5 |
| Randomly Selected street | Kilombero | C.C.M Street |
| Total households in selected street | 104 | 59 |
| Randomly selected households | 82 | 51 |
| Total sampled households | 82 | 51 |
Table 6: Sampled households in urban areas of the study area.
| Aspect | Morogoro District | Songea District |
|---|---|---|
| No. of wards | 4 | 4 |
| Selected ward | Kingoluwira | Mshangano |
| No. of streets in selected ward | 15 | 5 |
| Randomly selected streets | Mahakamani | Mshangano |
| Tambukareli | ||
| No. of households | Mahakamani = 86 | Mshangano = 74 |
| Tambukareli = 51 | ||
| Randomly selected households | Mahakamani = 70 | Mshangano = 62 |
| Tambukareli = 45 | ||
| Total selected households | 115 | 62 |
Table 7: Sampled households in peri-urban areas of the study area.
Development of research instruments
The main research instruments used in the present study are questionnaires (for household surveys) and checklists (for Focus Group Discussion and interview of key informants). Figure 5 presents five sequential steps involved in questionnaire development: background, conceptualization, format and data analysis, establishing validity, and establishing reliability.

Figure 5: Sequential steps in questionnaire development.
Questionnaire construction began by first defining the domain of information in order to obtain the required information. This was achieved through an extensive and rigorous search of pertinent literature. I tried as much as possible, to make the questionnaire: brief (keeping questions short, and asking one question at a time); objective (paying attention to neutrality of the words); simple (using language which is simple in words and phrase); specific (asking precise questions); and informative (covering all necessary information needed). All three types of question formats were used: multiple choice (closed ended) questions, numeric open-ended questions, and text open-ended questions. Attention was also given to issues such as opening questions, question flow, and location of sensitive questions.
Data collection
Sample size determination: The sample size for the present study was computed using formulae 1 and 2 as recommended by Bartlett et al. [127]:
 (1)
(1)
The computation of sample size for categorical data, according to Bartlett et al. [127], follows the same way as in continuous data, except in the computation of n0 , which is:
 (2)
(2)
Where: p is the proportion of respondent that will give you information of interest (the proportion confirming), q viz (1-p) is the proportion not giving you information of interest (proportion defective), and p*q is the estimate of variance (which is maximum when p = 0.50 and q=0.50). The maximum population variance of 0.25 will give the maximum sample size.
Consequently, the formula used to determine sample size (n) from a population (N) is:
 (3)
(3)
After determining the sample size from a respective target population, a stratified random sampling techniques (using a random number table) was used to draw the respondents for the survey. First, the households were stratified into low, medium and high wealth categories and their respective percentages (of the total population) were established. Then, the sampling of respondents across the three wealth categories was affected using the following formula:
 (4)
(4)
Where: n is the required sample size (calculated by equation 3.1), N is the households’ sampling frame, L is the number of households in a low wealth category in the sampling frame, M is the number of households in a medium wealth category in the sampling frame, and H is the number of households in a high wealth category in the sampling frame.
After the household had been selected to take part in the survey, either the husband or wife of the respective household (for a married couple) was responsible for answering the questionnaire. In the event both (husband and wife) were present at the time a visit for interview was made, then a random sampling technique (using playing cards) was used to determine who should be the respondent. Otherwise, for those households whose heads were single or at the time of the visit there was only one of the couple present, the questionnaire was administered to either single household heads or the available couple member (for the latter case).
Data collection and analysis
Data was collected using a number of techniques: household questionnaire survey, focus group discussion, key informant interview, and resercher’s direct observation. Questionnaires were both pre-tested and pilot-tested before actual data collection. Data analysis was carried out using SPSS and Excel statistical computer programmes. Prior to detailed analysis, data were arranged in such a way as to facilitate analyses. For example, some data were re-coded so as to fit a particular analysis (e.g. logistic regression analysis). Household income categories were collapsed from previous eight categories to three categories.
Descriptive statistical analysis was conducted. The general purpose of descriptive statistical method is to summarise, organise and simplify a set of scores [128,129]. In the present study, the central tendency (average or representative score) for numeric data (interval or ratio) was determined by mean. The central tendency determination for discrete variables was a mode. The measure of variability within the numeric (interval or ratio) data was standard deviation. The categorical variables were summarised using bar charts and pie charts; whereas numerical variables were summarised using histograms.
Inferential statistical analysis: Two types of statistical modelling were carried out in the present study.
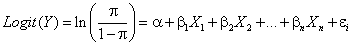
a) Modelling factors influencing household choice for cooking fuels: Binary logistic regression was used to determine the factors which affect the choice (by households) between firewood and charcoal as the cooking fuel. The general logistic regression model equation is given by:
 (5)
(5)
Where: logit = ln  and p is the probability of the study event; α is the Y intercept, βs are regression coefficients, and Xs are a set of predictors.
The non-parametric chi-squared test was used to analyse the households’ preferences to woodfuel from natural forests.
Extensive literature review on factors influencing households’ fuel consumption coupled with personal Tanzanian field experience guided the selection of variables to be included in the present logistic regression model. A vast literature has highlighted factors which affect patterns and levels of household energy consumption. The factors include: age of the household head [130,131], income, fuel price, price of related appliances, opportunity cost for firewood collection [131-133], level of urbanisation, availability of fuel and related appliances, cultural preferences [133], household size [131,134], house type, tenure type, employment status, geographical location, number of children, and car ownership [135] classified the determinants of direct energy consumption by households into six categories: economic factors (disposable income, consumer prices, spending pattern, availability of credit), socio-demographic factors (household size and structure, age, behavioural factors, lifestyle, attitudes), living situation (per-capita floor space, dwelling type, house age, standard of insulation), technology (energy efficiency of household appliance), supplier (efficiency, energy content of energy carrier) and climatic factors. According to Piet and Boonekamp [136], choices made by households are not only affected by income and energy prices, but also by others factors: composition of households, owned versus rented dwellings, and energy use standards for new dwellings or appliances. Jiang [137] asserted that the main drivers of energy use and carbon emissions are demography (population size; composition – age and gender; distribution – spatial, rural/urban), economic growth, technology, policy and lifestyle. Abrahamse [138] categorised salient determinants of energy consumption into two groups: societal factors (technological developments, economical growth, demographic factors, institutional factors and cultural factors) and individual-level factors (awareness, beliefs, values, attitudes and knowledge).
Results
Respondents’ characteristics
The socio-economic characteristics for 568 respondents who took part in the present study are summarised and presented in Table 8. The findings reveal that both household heads and those who are not household heads participated in answering survey questionnaires. It is also evident from the findings (Table 8) that the study sample comprised of both male-headed households and female-headed households, albeit the former constitutes the majority. Female-headed households can further be categorised into two groups: those who are married and those who are not. The study attained a fairly good gender balance: the number of male respondents was comparable to that of female respondents. Household income distribution for the respondents (as recorded in the field) is presented in Table 9. Figure 6 shows the distribution of the collapsed household income categories (which was used during data analysis).
| Characteristic | N | % |
|---|---|---|
| Respondents | ||
| Household head | 307 | 54 |
| Not household head | 261 | 46 |
| Gender of the household head | ||
| Male-headed household | 468 | 82.4 |
| Female-headed household | 100 | 17.6 |
| Marital status of respondent | ||
| Married | 433 | 76.2 |
| Never married | 34 | 6 |
| Widowed | 67 | 11.8 |
| Divorced | 18 | 3.2 |
| Separated | 16 | 2.8 |
| Marital status of female-headed household | ||
| Married | 36 | 36 |
| Not married | 64 | 64 |
| Dwelling categories (status) | ||
| Concrete/burnt bricks/iron roof | 318 | 56 |
| Concrete/burnt bricks/grass roof | 60 | 10.6 |
| Unburnt bricks/iron roof | 18 | 3.2 |
| Unburnt bricks/grass | 9 | 1.6 |
| Mud-house/iron roof | 36 | 6.3 |
| Mud-house/grass roof | 69 | 12.1 |
| Other types | 58 | 10.2 |
| Educational level of household head | ||
| Illiterate | 99 | 17.4 |
| Primary education | 382 | 67.3 |
| Secondary education | 63 | 11.1 |
| Adult education | 3 | 0.5 |
| College education | 9 | 1.6 |
| University education | 6 | 1.1 |
| Others | 6 | 1.1 |
| Main occupation of household head | ||
| Employee | 44 | 7.7 |
| Formerly employed | 24 | 4.2 |
| Causal labourer | 7 | 1.2 |
| Artisan | 9 | 1.6 |
| Herder/cultivator | 231 | 40.7 |
| Trade/shop | 24 | 4.2 |
| Petty business | 96 | 16.9 |
| Firewood/charcoal vending | 3 | 0.5 |
| Housework | 57 | 10 |
| Others | 73 | 12.8 |
| Ownership of dwelling | ||
| Rented | 84 | 14.8 |
| Owned | 484 | 85.2 |
Table 8: Socio-economic characteristics of respondents.
| Income month-1(Tshs) | N | % |
|---|---|---|
| <10,000 | 80 | 14.2 |
| 10,000 – 20,000 | 86 | 15.1 |
| 21,000 – 30,000 | 55 | 9.7 |
| 31,000 – 40,000 | 50 | 8.8 |
| 41,000 – 50,000 | 55 | 9.7 |
| 51,000 – 60,000 | 44 | 7.7 |
| 61,000 – 70,000 | 19 | 3.3 |
| ≥71,000 | 179 | 31.5 |
| Total | 568 | 100 |
Table 9: Distribution of Household monthly income (exchange rate2007: 1US$=1,255 Tshs).

Figure 6: Categories of household monthly income (exchange rate2007: 1US $=1,255 Tshs).
Prior to actual data collection, the respondents were stratified into three wealth categories (based on the criteria developed during pilot study, using focus group discussion): low wealth categories, medium wealth categories, and high wealth categories. Figure 7 indicates that the respondents constituted a fairly good representation across the three wealth category strata. During data collection, household assets were used as proxy for household wealth. Both animate (cattle, goats, sheep, pigs and chickens) and inanimate assets (land, motor cars, bicycles, hand hoes, sickles, machetes, and sprayers) were recorded for each respondent household and converted into monetary value to reflect the wealth status of a respective household. Table 10 shows the type and quantity of asserts owned by the respondents in the study area. Besides, the study sought to determine wealth ownership equity by gender. The results (Figure 8) suggest that there is fairly even household wealth (household assets) ownership.
| Type of Asset | Households owning | Number household-1 | ||
|---|---|---|---|---|
| N | % | Min. | Max. | |
| Animate | ||||
| Cattle | 39 | 6.7 | 1 | 250 |
| Sheep | 8 | 1.4 | 2 | 30 |
| Goats | 84 | 14.8 | 1 | 37 |
| Pigs | 53 | 9.3 | 1 | 18 |
| Chicken | 294 | 51.8 | 1 | 180 |
| Ducks | 19 | 3.3 | 2 | 15 |
| Others (e.g. pigeons) | 20 | 3.5 | 1 | 200 |
| Inanimate | ||||
| Sprayers | 6 | 1 | 1 | 2 |
| Hand hoe | 347 | 61 | 1 | 13 |
| Machete | 190 | 33.5 | 1 | 6 |
| Sickle | 28 | 5 | 1 | 5 |
| Bicycle | 211 | 37 | 1 | 26 |
| Land | 343 | 60.4 | 0.25 acre | 56 acre |
| Cars | 22 | 3.9 | 1 | 3 |
| Motor cycle | 5 | 0.9 | 1 | 2 |
Table 10: Household assets endowment in the study area.

Figure 7: Wealth categories of respondents as defined during FGD.

Figure 8: Household ownership of non-animate assets by gender.
Household fuel consumption patterns in the study area
The fuel types found in the study area and their possible uses in brackets are as follows: firewood (cooking, lighting, heating bath water, and heating space), charcoal (cooking, ironing, heating bath water and heating space), kerosene (lighting and cooking), electricity (lighting and cooking), gas (cooking), solar (lighting), petrol (transport and powering generators for light) and diesel (transport and powering generators for lighting). The respondents’ stated fuels availability suggests that: firewood, charcoal and kerosene are readily available; crop residues and electricity are modestly available; natural gas is very scarcely available; while LPG and coal are virtually unavailable. Overall, the majority of households use kerosene (83%), firewood (81%) and charcoal (58%). Only 14.5% of the households in the study area use electricity. Crop residues, solar and natural gas are only used by 17%, 0.2% and 0.2% of households respectively (Table 11).
| District | Stratum | Households No. of surveyed | Firewood | Charcoal | Electricity | Kerosene | Crop residue | Natural gas | Solar |
|---|---|---|---|---|---|---|---|---|---|
| Morogoro | Rural | 167 | 87 | 44 | 2.4 | 74 | 14 | - | - |
| Peri-urban | 115 | 83 | 71 | 10.4 | 87 | 36 | 0.9 | - | |
| Urban | 82 | 70 | 92 | 34 | 74 | 1.2 | - | - | |
| Overall | 364 | 82 | 64 | 12 | 78 | 18 | 0.3 | - | |
| Songea | Rural | 91 | 97 | 29 | 1.1 | 90 | 21 | - | - |
| Peri-urban | 62 | 95 | 37 | 3.2 | 97 | 21 | - | 1.6 | |
| Urban | 51 | 31 | 98 | 70 | 80 | - | - | - | |
| Overall | 204 | 80 | 49 | 19 | 90 | 16 | - | 0.5 | |
| Pooled | Rural | 258 | 90.3 | 38.8 | 1.9 | 80 | 16 | - | - |
| Peri-urban | 177 | 87 | 59 | 7.9 | 90 | 30.5 | 0.6 | 0.6 | |
| Urban | 133 | 55 | 94 | 48 | 77 | 0.8 | - | - | |
| Overall | 568 | 81 | 58 | 14.6 | 83 | 17 | 0.2 | 0.2 |
Table 11: Percentage of households using various energy sources in the study area.
Approximately fifty one percent (51.4%) of households collect firewood of which 73.6% come from natural forests; 19.5% from plantation forests, 1.4% from own farms and 5.5% from other places). The firewood collection is mainly (45.9%) done by women (Figure 9). This observation is similar to other studies in which women and girls devote much time and labour to gathering fuel and cooking food for the family. On average, firewood collectors have to walk (round trip) relatively long distances in search for firewood: The distant varies from a minimum of 2 km to maximum 20 km and mean 3.3 km. They thus spend a considerable amount of time, ranging from 2 hrs to 12 hrs, and averaging 3 hours.

Figure 9: Members of households responsible for firewood collection.
The time spent in search for firewood depends on the means by which firewood is transported from the forest: 86.6% of households transport firewood by head; 7.7% of households use bicycles for transportation of firewood; and 5.7% use animals as means of transportation. The estimated average load per trip also depends on the means of transport and ranges from 15 kg - 300 kg, with mean of 20 kg. The estimated number of trips per week for each household is as follows: minimum 1, maximum 10, and median 2.
The findings revealed that in the study area, respondents use more than one fuel type (the fuel mix). As far as cooking and lighting fuels are concerned, firewood and kerosene are the only stand-alone fuels (i.e. households can use them without mixing with other fuels), but they are also generally used together with other fuels. Several observations can be deduced from this fuel mix (Figure 10): Electricity, which is the modern energy, is hardly used alone – almost always, electricity is used together with wood fuel (especially charcoal); firewood and kerosene constitute the modal fuel mix in the study area; some households use up to five types of fuels (highly diversified). It was also evident that as household income increases, household fuel mix increases (Figure 10).

Figure 10: Households’ fuel consumption portfolios in the study area.
Confidence interval for wood fuel consumption patterns: As an inferential statistic for wood fuel consumption in the study area, the 95% confidence interval was computed using sample statistics (percentage of households using firewood, charcoal). The standard formula for computing a 95% confidence interval for population proportion is well explained [127,128,139,140]. It is recommended, however, that for a finite population (small population) the finite population correction factor (FPCF) should be incorporated in the standard formula in order to reduce standard error [141-144]. The population is said to be finite if sample size (n) >5% of population (N). The computations of confidence intervals in the present study incorporated the finite population correction factor [145-150]. The computed confidence intervals for wood fuel (fire wood and charcoal) consumption patterns in the study area are presented in Table 12 [151,152].
| ɴ | ɳ |  |
FPCP | Sample statistic | Inferential statistic (95%C.I) | |||
|---|---|---|---|---|---|---|---|---|
| % households using | % households using | |||||||
| Firewood | Charcoal | Firewood | Charcoal | |||||
| 1. Morogoro District | ||||||||
| 1.1 Rural | 189 | 167 | 0.88 | 0.342 | 87 | 44 | 85.3– 88.7 | 41.4–46.6 |
| 1.2 Peri-urban | 137 | 115 | 0.84 | 0.402 | 83 | 71 | 80.0–86.0 | 67.7–74.3 |
| 1.3 Urban | 104 | 82 | 0.79 | 0.462 | 70 | 92 | 65.4–74.6 | 89.3–94.7 |
| 1.4 Overall | 430 | 364 | 0.85 | 0.392 | 82 | 64 | 80.0–84.0 | 61.5–66.5 |
| 2. Songea District | ||||||||
| 2.1Rural | 104 | 91 | 0.87 | 0.355 | 97 | 29 | 95.8–98.2 | 25.7–32.3 |
| 2.2 Peri-urban | 74 | 62 | 0.84 | 0.405 | 95 | 37 | 92.8–97.2 | 32.1–41.9 |
| 2.3 Urban | 59 | 51 | 0.86 | 0.371 | 31 | 98 | 26.3–35.7 | 96.1–99.9 |
| 2.4 Overall | 237 | 204 | 0.86 | 0.374 | 80 | 49 | 78.0–82.0 | 46.4–51.6 |
| 3. Pooled sample | ||||||||
| 3.1 Rural | 293 | 258 | 0.88 | 0.346 | 90.3 | 38.8 | 89.1–91.5 | 36.7–40.9 |
| 3.2 Peri-urban | 211 | 177 | 0.84 | 0.402 | 87 | 59 | 85.0–89.0 | 56.1–61.9 |
| 3.3 Urban | 163 | 133 | 0.82 | 0.430 | 55 | 94 | 51.4–58.6 | 92.3–95.7 |
| 3.4 Overall | 667 | 568 | 0.85 | 0.386 | 81 | 58 | 79.8–83.2 | 56.4–59.6 |
Table 12: Confidence interval for wood fuel consumption patterns.
Factors influencing houseolds’ fuel choice
The first hypothesis which was tested in connection with households’ fuel consumption patterns concerned with the influence of households’ characteristics on choice of cooking fuel. Since firewood and charcoal are the major cooking fuel in Tanzania, they were used to test this hypothesis. Binary Logistic regression analysis was used to test this hypothesis:
 (6)
(6)
Where: π is the probability of the event, α is the Y intercept, βs are regression coefficients, and Xs are a set of predictors.
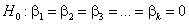 (7)
(7)
(i.e. household socio-economic and demographic factors have no effects on fuel choice)
H1: At least one of the  (8)
(8)
(i.e. some household socio-economic and demographic factors do have effects on fuel choice)
The main household cooking and lighting fuels found in the study area are: firewood, charcoal, kerosene, electricity and crop residues. Of these fuels, crop residues are used, almost exclusively, in rural and peri-urban areas. As explained in the previous section, firewood and charcoal are the principal cooking fuels in the study area. The fuel choice modelling was therefore conducted for these two fuels. The candidate variables used and the regression results are presented in Table 13 and 14 respectively.
| Variable | Description |
|---|---|
| Y | Household cooking fuel choice (1 = charcoal; 0=firewood) |
| X1 | Gender of household head (1 = female; 0 = male) |
| X2 | Household size |
| X3 | Residence ownership (1= owned residence; 0 = rented residence) |
| X4 | Dwelling category (1= modern house; 0 = traditional house) |
| X5 | Education level of household head (1= educated; 0 = illiterate) |
| X6 | Household monthly income category: [1: ≤Tshs 30,000; 2: Tshs. 31,000 – 60,000; 3: ≥Tshs. 61,0000] |
| X7 | Location of the household (1 = urban, 0 = non-urban) |
Table 13: Description of variables used in the Binary Logistic Regression Model.
| Choice of charcoal as cooking fuel | ||||||||
|---|---|---|---|---|---|---|---|---|
| 95% C.I of Exp(β) | ||||||||
| Lower | Upper | |||||||
| Predictor | β | SEβ | Wald’s χ2 |
df | P | Exp(β) | ||
| Constant | -2.738 | 0.879 | 9.714 | 1 | 0.0020** | 0.065 | ||
| X1 | -0.809 | 0.572 | 1.997 | 1 | 0.1580 | 0.445 | 0.145 | 1.367 |
| X2 | -0.107 | 0.073 | 2.133 | 1 | 0.1440 | 0.899 | 0.779 | 1.037 |
| X3 | -1.780 | 0.481 | 13.717 | 1 | 0.0001*** | 0.169 | 0.066 | 0.433 |
| X4 | 1.467 | 0.410 | 12.821 | 1 | 0.0001*** | 4.334 | 1.942 | 9.673 |
| X5 | 1.490 | 0.696 | 4.577 | 1 | 0.0320* | 4.436 | 1.133 | 17.364 |
| X6 | 0.576 | 0.213 | 7.338 | 1 | 0.0070** | 1.779 | 1.173 | 2.698 |
| X7 | 2.892 | 0.479 | 36.413 | 1 | 0.0001*** | 18.034 | 7.049 | 46.140 |
| Tests: | χ2 | df | p | |||||
| Model Evaluation (overall): | ||||||||
| Likelihood ratio test | 195.897 | 7 | 0.0001 | |||||
| Goodness-of-fit test | ||||||||
| H-L statistic | 9.594 | 8 | 0.295 | |||||
*Statistically significant at α = 0.05
**Statistically significant at α = 0.01
***Statistically significant at α = 0.001
Notes: PAC: Null model=68.9; Model with descriptors= 86.2; Cox &Snell R2: 0.437; Negelkerke R2: 0.615; Sample size used in the analysis (n) = 341
Table 14: Binary Logistic Regression Analysis for household cooking fuel choice.
The findings indicate that the model with descriptors (PAC: 86.2) performs better than the null model (PAC: 68.9). The results show further that the model performance is statistically significant (χ 2 (7d.f) = 195.897, p < 0.001). The inferential test for goodness-of-fit, the Hosmer and Lemeshow (H-L) statistic, indicates that the model fits the data well ( χ 2 (8 d.f) = 9.594, p > 0.05). The descriptive measures of goodness-of-fit also supports that the model fits the data well (Cox and Snell R2 = 0.437 and Nagelkerke R2 = 0.615). The descriptors which are statistically significant determinants of fuel choice are: Location (p < 0.001), Residence ownership (p <0.001), Dwelling category (p <0.001), Household income (p < 0.01) and Education level of household head (p < 0.05). The results indicate also that the constant parameter of the model should be included (p < 0.01).
Households’ preferences to woodfuels from natural forests
The second hypothesis to be tested was concerned with the households’ preference for miombo woodlands/natural forest wood fuel. The chi-squared (χ2) test was used to determine whether the households’ preference for natural forests (miombo woodland) as a source of wood fuel is statistically significant.
Respondents were asked to indicate their preferences between wood fuel from the natural forests (miombo woodlands) and that from the plantation forests. Results as presented in Figure 10 indicated that majority of respondents (60% of wood fuel users) prefer wood fuel from miombo woodlands (natural forests) to that from plantation forests. Some of the respondents were able to give reasons for their preference as indicated in Table 15.
| Reasons for households’ preference for miombo woodlands | |||
|---|---|---|---|
| Category label | Code | Count | Percent of responses |
| Catch fire easily | 1 | 25 | 8.8 |
| High calorific value/burns longer | 2 | 191 | 67.5 |
| Easily available | 3 | 29 | 10.2 |
| Produces less smoke | 4 | 32 | 11.3 |
| Households are traditionally used to | 5 | 5 | 1.8 |
| Collection from field is easy | 6 | 1 | 0.4 |
| Total responses | 283 | 100 | |
| 233 valid cases | |||
Table 15: Reasons for preference to wood fuel from miombo woodlands.
In the absence of preference towards any particular source of wood fuel, the expected response would be:
• 33.33% of the wood fuel users would indicate preference to natural forests.
• 33.33% of the wood fuel users would indicate preference to plantation forests.
• 33.33% of the wood fuel users would indicate indifferent preference between natural forests and plantation forests.
Table 16 shows the observed and expected frequencies which were used to for the chi-squared (χ2) test.
| Preference to miombo woodlands | Preference to plantation forests | Indifferent preference | |
|---|---|---|---|
| Observed frequencies | 60% | 34% | 6% |
| Expected frequencies | 33.33% | 33.33% | 33.33% |
Table 16: The observed frequencies and expected frequencies for chi-squared test.
Using the values in Table 5 and 13, the chi-squared statistic was then computed as follows:
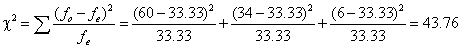 (9)
(9)
The degree of freedom (df) for chi-squared is C-1, where C is the number of columns in the chi-squared frequency table [127]. For df = 2 and α = 0.05, the table of critical value for chi-squared indicate that the critical χ2 has a value of 5.99. Therefore, the respondents in the study area showed statistically significant preference between sources of wood fuel, χ2 (2, n = 520) = 43.76, p <0.05.
The strength of preference was subsequently determined using Cramér’s V [128,129]:
 (10)
(10)
Where χ2 is chi-squared, n is the sample size, V is the effect size, df* is a smaller of either (R-1) or (C-1): R and C are the number of rows and columns respectively, in the frequency table. Consequently, the value of Cramér’s V is:
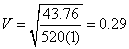 (11)
(11)
According to Cohen’s 1988 guidelines [128,129] presented in Table 17, the obtained value of V suggests that the effect size of natural forest preference is small.
| For df* = 1 | 0.10 < V < 0.30 | Small effect |
| 0.30 < V < 0.50 | Medium effects | |
| V > 0.50 | Large effect | |
| For df* = 2 | 0.07 < V < 0.21 | Small effect |
| 0.21< V < 0.35 | Medium effects | |
| V > 0.35 | Large effect | |
| For df* = 3 | 0.06 < V < 0.17 | Small effect |
| 0.17< V < 0.29 | Medium effects | |
| V > 0.29 | Large effect |
Table 17: The observed frequencies and expected frequencies for chi-squared test.
Discussions of Results
The empirical evidence from the present study has revealed several household fuels: kerosene, firewood, charcoal, grid electricity, crop residues, natural gas, solar electricity, diesel and petrol. The study didn’t encounter any household that was using coal and LPG. Of the above-mentioned fuels, the main ones are kerosene (used by 83% of the respondents), firewood (used by 81% of the respondents), charcoal (used by 58% of the respondents) and grid-electricity (used by 14.6% of the respondents). Firewood and charcoal are the main cooking fuels in the study area. The households use a fuel mix―empirically supporting the energy stack model. The majority of the households (51.4%) collect firewood, mainly from the natural forest (73.6% of the firewood collectors). About 46 % of respondents reported that firewood collection is mainly undertaken by women, and nearly 15% of the respondents posited that firewood collection is the task carried out by women and children. This is the evidence that women suffer disproportionately in the event of wood fuel scarcity. When analysed using the chi-squared (χ2) test, the preference of households for natural forest-wood fuel was found to be statistically significant, χ2 (2, n = 520) = 43.76, p <b0.05 and effect size of the preference was small: Cramér’s V = 0.29.
Multiple binary logistic regression analysis was carried out to find out factors affecting choice of cooking fuels (firewood and charcoal) in the study area. It was found that the statistically significant factors are: residence ownership (p < 0.001): households with owned residence prefer firewood to charcoal, dwelling category (p < 0.001): households with modern dwellings prefer charcoal to firewood, education of household head (p < 0.05): the higher the education level of the household head the more is the preference of charcoal to firewood, household income (p < 0.01): households with higher income prefer charcoal to firewood; and location of the household (p < 0.001): households in urban areas have more preference to charcoal than their counterparts in non-urban areas.
Households’ dependency on wood fuel as a source of energy in the study area is overwhelming. Empirical evidence suggests that there are a number of factors which influence this situation. The main factors are poor availability of alternative sources of energy and escalating prices of the available non-wood fuels. The findings of this study support the energy stacking model, suggesting that while efforts to avail other sources of fuels alternative to wood fuel to the population in the study area are highly recommended, existing sources of fuel should concurrently be increased and used more efficiently. The support towards the energy stacking model coupled with high household dependency on wood fuel, is sufficient evidence that biomass fuel in general and wood fuel in particular will remain the major and in many cases the only – source of household cooking and/or heating fuel. It is reasonably plausible to argue that since (according to the findings of this study) at any point in time a household will use a fuel mix, efforts targeted at reducing pressure on natural forests should explicitly aim at reducing the share of wood fuel in household total fuel mix.
Conclusions
This research analysed household energy consumption with special focus on the consumption patterns. The findings indicated that majority of the households are dependent on wood fuel as their source of energy. Speaking with 95% confidence: 79.80 - 83.20% and 56.40 - 59.60% of households in the study area use firewood and charcoal respectively. The findings suggested that statistically significant factors affecting household fuel choice are (presented in descending order of significance): residence ownership, dwelling category, geographical location of the household, household income and educational level of household head.
The empirical evidence in the present study is in support of the energy stacking model – rather than the energy ladder model – of household fuel consumption. This has practical implications that the most appropriate strategies for improving household energy services in the study area should be those targeted at improving the household fuel mix proportions as opposed to those aimed at exclusively replacing one type of fuel by another. Thus issues of rural electrification and provision of alternative fuels to biomass should go in tandem with the improvement in sustainable natural forest management.
The study has evidently shown that there is a statistically significant preference of the households for natural forests as sources of wood fuel. It is unlikely therefore that afforestation programmes in the study area will have a significant impact on reducing pressure on natural forests. Consequently, more concerted efforts should be directed towards improving the sustainable management of the natural forests, but this doesn’t imply whatsoever that tree planting activities should be ignored. Ecologically speaking, the loss of natural forests cannot be compensated by plantation forests because they have different values in terms of biodiversity and ecosystem functions.
Policy Recommendations
The central government should: (a) Promote, disseminate and scale-up the uptake of improved firewood and charcoal stoves. The stoves should be affordable, durable and consider the socio-cultural aspects of the end-users. The overarching message to end-users should stress saving fuel expenditure and improving health of the users. It would be prudent for the government to institute a body responsible for quality control of the improved stoves. (b) Strive to increase household accessibility to electricity by electrifying the rural areas and reducing (subsidising) the connection costs. (c) Promote other alternative fuels for household cooking and heating purposes such as briquettes (saw-dust/charcoal dusts), LPG and natural gas. (d) regularly and consistently provide adequate and well-targeted extension education services to the community so as to change their habits, way of thinking and attitudes towards environmental management issues.
Households show a strong preference for natural forests in comparison to plantation forests as a source of wood fuel. My personal recommendation is that tree planting (particularly for fuel purposes) should be carried out in conjunction with education and advice on suitability of plantation forests and choice of species for wood fuel uses. Tree species to be planted should be carefully selected to ensure that their energy output is comparable to the preferred natural forest species. Field experience, empirical findings and literature all indicate that the local preference for wood fuel species in the community can be explained by the physical properties of their wood. It is further recommended that the regional and district forest officials should make available improved charcoal production technologies to all charcoal makers in their respective areas, and put in place by-laws requiring all charcoal to be produced using improved technologies. The existing forest management laws and by-laws should be strictly enforced. Environmental management committees from local communities surrounding the forest resources should be involved in all steps of sustainable forest management planning undertaken at regional/ district level.
The local communities under their village leaders are the immediate managers of the forest resources. They should have both sense of ownership of forest resources and responsibility for its management. If the local community is not dedicated towards management of their surrounding forest resources, no amount of efforts from higher levels will bring about a sizeable change towards a desired outcome. It is with this understanding that the following recommendation is tasked to the village-level leaders: (a) a by-law at village level should be made to ensure that all wood fuel- using households use improved stoves; (b) charcoal makers should be monitored by the village leaders and/ or environmental management committees to ensure that all (charcoal makers) should be required to use improved charcoal production technology; (c) village leaders should devise a mechanism which will ensure that households have individual wood lots for fuel purposes.
Acknowledgement
I owe so much-and therefore am exceedingly grateful - to my supervisor Prof. Colin Price for his outstanding guidance, advice, assistance, encouragement and constructive criticism throughout the study. I wish to register my gratitude to Prof. Y.M. Ngaga of Sokoine University of Agriculture (SUA), Tanzania, for his assistance in shaping my study theme and subsequently editing my questionnaires prior to field work data collection.
I am indebted to my employer, the Sokoine University of Agriculture for granting me the study leave and Association of Commonwealth University Sponsorship for financing my studies and the British Council for effectively administering the scholarship. My heart-felt gratitude also go to the WWF for their partial financial support during fieldwork, without which data collection would be absolutely difficult undertaking due to my then financial constraints for fieldwork. Successful data collection also hinged on diligent and devoted fieldwork assistants who painstakingly rendered their assistance in collecting quality data. I will thus not do them justice if I don’t acknowledge them.
I am highly indebted to all respondents in the study area including but not limited to households, fuel vendors, charcoal stove producers and vendors. Their cordial cooperation rendered to me during data collection is highly appreciated. Last but not least, I’m grateful to Dr. Suzana Augustino and her husband Revocatus Nyefwe who warmly welcome me the first time I arrived at Bangor, thereby healing my homesickness. I will always remember their kindness. Special regards go to Dr. James Walmsley and my colleagues PhD students: Sally, Pete, Paul, Elizabeth, Jacob, Refaat, and Betty Waized, to name but a few, for their miscellaneous contributions to the success of my studies.
References
- Alabe M (1994) Rural and urban energy assessment in developing countries. Seminar Paper presented to the Faculty of Technology. Buyero University, Kano, Nigeria.
- Jamal S (2005) Energy and poverty: Myths, links and policy issues. Energy working notes. Energy and mining sector Board, The World Bank Group. pp: 24.
- Leach G, Gowen M (1987) Household energy hand book. World Bank Technical Report No. 67. Washington, D.C.
- TaTEOO (2005) Sustainable Energy and Development Forum. Newsletter issue No.3. pp: 23.
- Thomas A (2005) Development of a least cost energy supply model for the SADC region. University of Cape Town.
- United Nations (2013) Sustainable development challenges. World Economic and Social Survey, 216.
- United Nations (2014) Gender equality and sustainable development. World survey on the role of women in development, pp: 132.
- Panayotou T (2003) Economic growth and the environment. Economic survey of Europe 45-72.
- Attigah B, Mayer-tasch L (2013) The impacts of electricity access on economic development. A literature review. Production use of energy. PRODUSE pp: 26
- OECD (2008) Natural resources and pro-poor growth. The Economics and Politics. DAC guidelines and references series. A good practice paper, pp: 170.
- World Economic Forum (2012). Energy for economic growth. Energy vision update. Industry agenda, pp: 47.
- Zhao Y, Wang C, Wang S, Tibig LV (2005) Impact of present and future climate variability on agriculture and forestry in humid and sub-humid tropics. Clim Change 70: 73-116.
- G8 (2002) G8 action programme on forest. Final Report, Ministry of Foreign Affairs of Japan.
- Malhi Y, Grace J (2000) Tropical forests and atmospheric carbon dioxide. Trends Ecol Evolut 15: 332-337.
- Toman MA (2001) Climate change economics and policy. An RFF Press book. Resources for the future, Washington, DC, pp: 276.
- McKendry P (2002) Energy Production from biomass (Part 1): Overview of biomass. Bioresour Technol 83: 37-46.
- Gielen DJ, de Feber MAPC, Bos AJM, Gerlagh T (2001) Biomass for energy or materials? A Western Europe systems engineering perspective. Energy policy 29: 291-302.
- Demirbas A (2001) Biomass resource facilities and biomass conversion processing for fuel and chemicals. Energ Convers Manage 42:1357-1378.
- Demirbas A (2008) Importance of biomass energy sources for Turkey. Energ Policy 36: 834-842.
- Leach G (1992) The Energy Transition. Energ Policy 20: 116-123.
- Hildegardo C (1992) Firewood use and the effects on ecosystem: A case study of the Sierra of Piura, North-western Peru. GeoJournal 26: 297-309.
- Amous S (1999) The role of wood in Africa. Wood energy today for tomorrow. In: Rivero SI, Flood R (eds.). Forestry Department, FAO, Rome Italy.
- African Energy Policy Research Network (2004) Sustainable energy consumption in Africa. UN-DESA Report. Final Report.
- IEA (2012) Technology roadmap: Bioenergy for heat and power. International Energy Agency, Paris.
- Timmons D, Harris JM, Roach B (2014) The Economics of renewable energy. Global Development and Environment Institute, Massachusetts.
- Intergovernmental panel on climate change (2007) Fourth assessment report (AR4).
- IEA (2002) World energy outlook. Energy and poverty special issue. International Energy Agency, Paris, France.
- Kandpal JB, Maheshwari RC (1994) Combustion of biomass fuels in two cook-stoves for their conservation. Centre for rural development and technology, Indian institute of technology, New Delhi, India.
- World Bank (2002) A draft revised forest strategy for the World Bank group. Washington DC, USA.
- Sander K, Haider SW, Hysen B (2011) Wood-based biomass energy development for sub-saharan Africa. Issues and Approaches, African Renewable Energy.
- Kaale BK (2005) Baseline study on biomass energy conservation in Tanzania. SADC Programme for Biomass Energy Conservation (ProBEC). Report, Gaborone, Botswana, pp: 55.
- African energy policy research network (2002) African Energy Data Handbook, version 8, AFREPREN, Nairobi.
- Hernoe T (2004) 2004 Cogeneration week in Thailand, Miracle Grand Convention Hotel, Bangkok.
- United Republic of Tanzania (URT) (1998) National Forest Policy. Ministry of Natural Resources and Tourism, pp: 55.
- United Nations (2007) Population below poverty line, rural, percentage-United Republic of Tanzania. United Nations Statistics Division.
- Brainard J, Lovett A, Bateman I (2006) Sensitivity analysis in calculating the social value of carbon sequestered in British grown Sitka Spruce. J For Econ 12: 201-228.
- Price C (1995) Economic evaluation of financial and non-financial costs and benefits an agro-forestry development and the values of sustainability. Agro-forestry Systems 30: 75-86.
- WHO (2002) World Health Report 2002: Reducing risks, promoting healthy life. World Health Organization, Geneva, pp: 7-14.
- Jack, D (2004) Income household energy and health.
- Ozer P (2004) Firewood consumption and deforestation in the Sahel: Are FAO statistics reliable? John Libbey Eurotext. CAB abstract 15: 243-251.
- Wood TS, Baldwin S (1985) Fuelwood and charcoal use in developing countries. Annual Review. Energy 10: 407-429.
- Price C (2006) Environmental Economics. Lecture notes for postgraduate students 2006/2007, University of Wales.
- Dugan PC, Durst PB, Ganz DJ, Mckenzie PJ (2003) Advancing assisted natural regeneration (ANR) in Asia and Pacific. FAO Regional office for Asia and the Pacific. Bangkok. Report, pp: 45.
- Lamb D, Gilmour D (2003) Rehabilitation and restoration of degraded forests. IUCN, Gland, Switzerland and Cambridge, UK and WWF, Gland, Switzerland, pp: 10.
- Heal G, Conrad G (2006) Incentive to reduce tropical deforestation. J For Econ 11: 201-203.
- Mugo F, Ong C (2006) Lessons of East Africa’s unsustainable charcoal trade. ICRAF Working Paper no. 20. Nairobi, Kenya. World Agro-forestry Centre.
- Intergovernmental Panel on Climate Change (IPCC) (2000) Land use, land-use change and forestry. Cambridge University Press, UK.
- Houghton JT, Meira Filho LG, Callander BA, Harris N, Kattenbertg A, et al. (1996). Climate change 1995. The science of climate change. Cambridge University Press, Cambridge, pp: 572.
- Nepstad DC, Verissimo A, Alencar A, Nobre C, Lima E, et al. (1999) Large-scale impoverishment of Amazonian forests by logging and fire. Nature 398: 505-508.
- FAO (2000) FRA 2000 – On definitions of forest and forest cover change. FRA programme, working paper 33, Rome, Italy.
- FAO (2001) Global forest resources assessment 2000, Rome, Italy
- FAO (1981) Forestry and rural development. FAO, Rome. Forestry pp: 26.
- Dube I (2001) Energy Services for the Urban Poor in Zimbabwe 2nd draft report AFREPREN Secretariat, Nairobi. 52.
- ESMAP (1999) Household energy strategies for urban India: The case of Hyderabad. World Bank Washington, D.C.
- Arnold JEM, Köhlin G, Persson R, Shepherd G (2003) Fuelwood Revisited: What has changed in the last decade? Center for International Forestry Research (CIFOR). Bogor, Indonesia, pp: 35.
- Gerald AL (1988) Residential energy in the third world. Annual Review of Energy 13: 47-65.
- Julia CA, Douglas FB (1985) The causes of deforestation in developing countries. Annals of the association of American geographers 75: 163-184.
- Achard F, Eva HD, Stibig H, Mayaux P, Gallego J, et al. (2002) Determination of deforestation rates of the world’s humid tropical forests. Science 297: 999-1002.
- Foster DR (1992) Land use history (1730–1990) and vegetation dynamics in central New England, USA. J Ecol 80: 753-771.
- Rinku RC (2006) Driving forces of tropical deforestation: The role of remote sensing and spatial models. Singapore Journal of Tropical Geography 27: 82-101.
- Fox J (1984) Firewood consumption in Nepali village. Environ Manage 8: 243-250.
- Bhatt BP, Sachan MS (2004) Firewood consumption pattern of different tribal communities in Northeast India. Energy Policy 32: 1-6.
- United Nations-Energy (2005) The energy challenge for achieving the millennium development goals. Un Energy paper 1-20.
- Gill J (1985) Stoves and deforestation in developing countries. Paper presented to the UK-ISES conference energy for development –What are the solutions? University of Reading, England.
- Sheng GX (1989) Biomass gasifiers: from waste to energy production. Biomass 20: 3-12.
- Foell W (2008) Clean cooking fuels & technologies. Report of the Istanbul pre-workshop on energy and poverty.
- Boahene K (1998) The challenge of deforestation in tropical Africa: Reflection on its principal causes, consequences and solutions. Land Degradation and Development 9: 247-258.
- Chamshama SAO, Nduwayezu JB (2002) Rehabilitation of degraded sub-humid lands in Sub-Saharan Africa: A synthesis. Sokoine University of Agriculture, Tanzania.
- Blay D, Bonkounguo E, Chamshama SAO, Chikamai B (2004) Rehabilitation of degraded lands in Sub-Saharan Africa: Lessons learned from selected case studies. In: Wood P, Yapi AM (eds.) Forestry Research Network for Sub-Saharan Africa (FORNESSA).
- Hartter J, Boston K (2007) An integrated approach to modelling resources utilisation for rural communities in developing countries. J Environ Manage 85: 78-92.
- Malimbwi RE, Misana S, Monela GC, Jambiaya G, Nduwamungu J (2001) Charcoal potential in Southern Africa (CHAPOSA). Final Report, pp: 67.
- Schlag, N. and Zuzarte, F. (2008) Market barriers to clean cooking fuels in Sub-Saharan Africa: A review of literature. SEI Working Paper.
- Reddy BS (2004) Economic and social dimensions of household energy: A case study of India. In: Ortega E, Ulgiati S (eds.) Proceedings of IV Biennial International Workshop advances in energy studies. Unicamp, Campinas, SP, Brazil, pp: 469-477.
- Ramachandra TV, Krishna SV, Shruthi BV (2005) Decision support system for regional domestic energy planning. J Sci Ind Res 64: 163-174.
- FAO (1993) Forest Resources Assessment 1990-Tropical Countries, Forestry, Rome, pp: 112.
- FAO (2002) Forestry outlook study for Africa: Regional overview of opportunities and challenges towards 2020. Forestry paper, Rome.
- FAO (2007) Opportunities and risks of wood energy production: Greenhouse gas emission and poverty could be reduced, deforestation could increase. FAO News room.
- http://rainforests.mongabay.com/20tanzania.htm
- Monela GC, Abdallah JM (2007) External policy impacts on Miombo forestry development. In: Dube Y, Schminuthusen (eds) Cross-sectoral policy developments in forestry. CAB International Publishers pp: 116-124.
- Drigo R (2006) Wood fuel integrated supply/demand overview mapping (WISDOM) methodology. Spatial wood fuel production and consumption analysis of selected African countries. FAO-Forestry Department –Energy. Consultancy Report.
- NAFORMA (2015) National forest resource monitoring and assessment of tanzania mainland. Main Results, pp: 1-106.
- Morgan-Brown T (2012) Applying the verified carbon standards (VCS) in REDD pilot projects in Tanzania: A description of the MUJUMITA and TFCG approach. Special edition on REDD. The Arc Journal. Tanzania Forest Conservation Group.
- Sauer J, Abdallah JM (2007) Forest Diversity, tobacco production and resource management in Tanzania. For Policy Econ 9: 421-439.
- Zahabu E, Skutsh MM, Sosovele H, Malimbwi RE (2007) Reduced emission from deforestation and degradation. Afr J Ecol 45: 451-453.
- Quinn CH, Huby M, Kiwasila H, Lovett JC (2007) Design principles and common pool resource management: An institutional approach to evaluating management in semi-arid Tanzania. J Environ Manage 84: 100-113.
- URT (2000) Forestry outlook studies in Africa. Ministry of Natural resources and Tourism, Dar-es-Salaam, Tanzania, pp: 36.
- URT (2003) The National Energy Policy. Ministry of Energy and Minerals. United Republic of Tanzania.
- Mwandosya M, Meena H, Mackenzie G (1997) The newsletter of the UNEP collaborating centre on energy and environment. Country Study News, Tanzania.
- Ishengoma RC, Ngaga YM (2001) Wood fuel consumption in urban areas of Tanzania. Consultancy Final Report. MNRT and ORGUT, Dar-es-Salaam, Tanzania.
- Sanga GA, Jannuzzi GDM (2005) Impacts of efficient stoves and cooking fuels substitution in family expenditures of urban households in Dar-es-Salaam, Tanzania. Energy Discussion Paper No. 2.59.1/05. International Energy Initiative.
- Milledge AH, Gelvas IK, Arhrends A (2007) Forestry, Governance and National Development. Lessons learned from logging boom in southern Tanzania. TRAFFIC East/Southern Africa/Tanzania Development Partners Group/Ministry of Natural Resources and Tourism, Dar-es-Salaam, Tanzania, pp: 252.
- Boberg J (1993) Competition in Tanzania wood fuel markets. Energ Policy 21: 474-490.
- Tepliz-sembitzky W (2006) The significance of Biomass Energy Strategies (BEST) for Sub-Saharan Africa. Background paper for 1st regional workshop on biomass energy strategy (BEST) development , held in Dar-es-Salaam, Tanzania.
- Carissa W, Marlene R, Duraiappah AK (2005) Connecting poverty and ecosystem services. A series of seven country scoping studies. Focus on Tanzania. United Nations Environment Programme (UNEP) and International Institute for Sustainable Development (IISD) pp: 33.
- Kaale BK (1984) Trees for Village Forestry. - Forest Division, Ministry of Lands, Natural Resources and Tourism, Dar es Salaam, Tanzania.
- Nkonoki SR (1983) The poor man’s energy crisis: A report of Tanzania rural energy consumption survey. Dar es Salaam, Tanzania.
- Ahlbäck AJ (1988) Forestry for Development in Tanzania. IDRC, Swedish University of Agricultural Science, Uppsala, Sweden, pp: 71.
- Monela GC, O’Kting’ati A, Kiwelle PM (1993) Socio-economic aspects of charcoal consumption and environmental consequences along the Dar-es Salaam-Morogoro Highway, Tanzania. Forest Ecol Manag 58: 249-258.
- Kilahama F (2005) Impact of increased charcoal consumption to forests and woodlands in Tanzania.
- Lusambo LP (2002) Socio-economic Analysis of landuse factors causing deforestation of miombo woodlands. Case study of kilosa District-Tanzania. M.Sc. Dissertation.
- Christoph W, Adrian P (2000) Modelling lifestyle effects on energy demand and related emissions. Energ Policy 28: 549-566
- Organisation for Economic Cooperation and Development (OECD) (2002) Towards sustainable household consumption? Trend and Policies in OECD countries.
- Alan P (2004) Energy efficiency-its potential: Some perspectives and experiences. Background paper for International Energy Agency Energy Efficiency Workshop, Paris.
- Ramirez CA, Blok K, Neelis M (2006) Adding apples and oranges: The monitoring of energy efficiency in the Dutch food industry. Energ Policy 34: 1720-1735.
- Byer T (1987) Review of Household Energy Issues in Africa. Washington, DC: World Bank, pp: 86.
- Dzioubinski O, Chipman R (1999) Trends in consumption and production: Household energy consumption. Economics and Social Affairs, United Nations.
- Iddi S, Hakan S (1997) Managing Natural forest at the Village level: Reaching the ultimately development goal. XI World Forest Congress. Antalya, Turkey 5.
- Simon AH, Kaale BK (2005) Bridging the gap: Linking timber trade with the infrastructural development in the southern Tanzania. Baseline data before completion of Mkapa Bridge. TRAFFIC East/Southern Aftrca, Dar es Salaam, pp: 119.
- Andrea B, Goldemberg J (1996) Desertification, energy consumption and liquified petroleum gas use, with an emphasis on Africa. Energy Sustain Dev 2: 32-37.
- Monela GC, Kihiyo VBMS (1999) Wood energy in Sub-Saharan Africa. In: Palo, M, Uusivuri J (eds.) World forests, society and environment. Kluwer Academic Publishers, Dordrecht, The Netherlands, pp: 153-160.
- Gauslaa Y (1989) Management and regeneration of tropical woodlands with special references to Tanzanian conditions. A literature review. Lidia 2: 37-112.
- Mansilla H, Garcia R, Tapia J, Duran, H, Urzua S (1991) Chemical characterization of Chilean hardwoods. Wood Science and Technology 25: 145-149.
- Demirbas A (2003) Biodiesel fuels from vegetable oils via catalytic and non-catalytic supercritical alcohol transesterifications and other methods: A survey. Energ Convers Manage 44: 2093-2109.
- FAO (1987) Simple technologies for charcoal making. FAO forestry paper No. 41. Forest Industries Division, Forestry Department, Rome.
- Wilson I (2002) Some practical sampling procedures for development research. Statistical services centre, University of Reading, UK. A paper presented at a conference on Combining Qualitative and Quantitative Methods in Development Research, held at Centre for Development Studies, Swansea University.
- Mugasha AG, Chamshama SAO, Gerald VVK (2004) Indicators and tools for restoration and sustainable management of Forests in East Africa. I-TOO Working paper No. 3. State of Forests and Forestry research in Tanzania, pp: 66.
- Japan International Cooperation Agency (JICA) (1998) Integrated agro-ecological research of the miombo woodlands in Tanzania. Final Report. SUA and Kyoto University, pp: 413.
- Linda M (1999) Questioning virtuous spirals: Microfinance and women empowerment in Africa. J Int Dev 11: 957-984.
- Hosier RH, Kipondya W (1993) Urban household energy in Tanzania. Price, Substitutes and poverty. Energ Policy 21: 454-473.
- Chaudhuri S, Pfaff ASP (2003) Fuel choice and indoor air quality: A household-level perspective on economic growth and the environment.
- Davis M (1998) Rural household energy consumption: The effects of access to electricity-evidence from South Africa. Energ Policy 26: 207-217.
- Hosier RH, Dowd J (1987) Household fuel choice in Zimbabwe: An empirical test of energy ladder hypothesis. Resour Energ 9: 347-361.
- Campbell BM, Vermeulen SJ, Mangono JJ, Mabugu R (2003) The energy transition in action: Urban domestic fuel choices in a changing Zimbabwe. Energ Policy 31: 553-562.
- Alam M, Sathaye J, Barnes D (1998) Urban household energy use in India: Efficiency and policy implications. Energ Policy 26: 885-891.
- Foster V, Tre JP, Wodon Q (2000) Energy consumption and income: An inverted-U consumption at the household level? The Word Bank Poverty Group.
- Baland J, Bardhan P, Das S, Mookherjee D, Sarkar R (2007) Environmental impact of poverty: evidence from firewood collection in rural Nepal. Econ Dev Cult Change 59: 23-61.
- Bartlett JE, Kotrlik JW, Higgins CC (2001) Oroganizational Research: Determining Appropriate Sample Size in Survey Research. Information Technology, Learning, and Performance Journal 19: 43-50.
- Gravetter FJ, Wallnau LB (2004) Statistics for the behavioural Sciences. 6th (edn.) Thomson Learning Academic Resource Centre, pp: 746.
- Gravetter FJ, Wallnau LB (2007) Statistics for the behavioural Sciences. 7th (edn.) Thomson Learning Academic Resource Centre, pp: 760.
- Erlandsen S, Nymoen R (2008) Consumption and population age structure. J Popul Econ 21: 505-520.
- Lenzen M (2006) Environmental implication of an aging society: Integrated sustainability analysis. The University of Sydney, Australia. Unpublished.
- UNDP and World Bank (2003) Household Fuels use and Fuel switching in Guatemala.
- Adelekan IO, Jerome AT (2006) Dynamics of household energy consumption in traditional African City, Ibadan-Nigeria. Environmentalist 26: 99-110.
- Hartmann B, Sherbinin A (2001) Exploring the links between global environmental change, human security and population: A meeting in the AVISO Policy Briefing series. Environmental Change and Security Program, Unpublished.
- Fuchs DA, Lorek S (2000) An inquiry into the impact of globalization on the potential for sustainable consumption in households. Report presented at the workshop on sustainable household consumption: Impacts, Goals and Indicator for energy-use, transport and food, Norway.
- Boonekamp PGM (2007) Price elasticities, policy measures and actual developments in household energy consumption-A bottom up analysis for the Netherlands. Energ Econ 29: 133-157.
- Jiang L (2007) Population/household dynamics, energy consumption and Carbon emission in the US, China and India. Third Annual Symposium of Population, Work and Family policy Research Collaboration. Social and Economic well-being of Canada’s population in 2017. Ottawa Congress Centre, Ontario.
- Abrahamse W (2007) Energy Conservation through behavioural change: Examining the effectiveness of a tailor-made approach. PhD thesis, University of Groningen, The Netherlands, pp: 144.
- www.mv-research.com
- Morisette JT, Khorram S (1998) Exact binomial confidence interval for proportion. Remote sensing brief. Photogrammetric Engineering and Remote Sensing 64: 281-283.
- Koether RT (2012) Confidence intervals for proportions. Hampden-Sydney College, Virginia.
- Ali Z (2005) The role of health professionals in tobacco control: evidence from global health professional survey (GHPS) of dental students in Bangladesh. A report prepared for World Health Organization (WHO), South-East Asia Regional Office (SEARO), New Delhi, India.
- Heinze DT, Feller P, McCorkle BA, Morsch M (2006) Computer-assisted auditing for high volume medical coding. Perspectives in Health Information Management, CAC Proceedings.
- Max S (2008) Finite population correction factor.
- Abrache J (2013) Sampling distribution and confidence interval estimation. Advanced Quantitative Methods. School of Business Administration, AL Akhawayn University.
- Arntzen JW, Kgathi DL (1984) Some determinants of the consumption of firewood energy in developing countries: The case of Rural Botswana 4: 24-44.
- Centre for International Forestry Research (CIFOR) (2007) Forests and climate change: Tough but fair decisions needed. Newsletter No. 43.
- Kalipeni E (1994) Population growth and environmental degradation in Malawi. In: Kalipeni E (ed.) Population growth and environmental degradation in Southern Africa. Lynne Rienner Publishers, Boulder London, pp: 17-38.
- Kulindwa KA, Sosovele H, Mgaya YD (2000) Tanzania: Rufiji, Ruvu, and Wami Mangroves. In: Wood A, Stedman-Edwards P, Mang J (eds.) Root Causes of Biodiversity loss, Earthscan Publication Ltd, pp: 309-336.
- Malimbwi RE, Zahabu E, Madadi LM, Monela GC, Misana S, et al. (2005) Tree species preference, volume estimation and charcoal kiln efficiencies in eastern Tanzania miombo woodlands. In: Maliondo SMS (ed.) Proceedings of the Tanzania Association of Foresters Meeting. Tanzania Association of Foresters, Morogoro, Tanzania, pp: 35-39
- Radhakrishna RB (2007) Tips for Developing and Testing Questionnaires/Instruments. J Extension 45.
- Shisana O, Simbayi L (2002) Nelson Mandela/HSRC Study of HIV/AIDS: South African National HIV prevalence, the risks and mass media. Household Survey 2002. HSRC Press.
Relevant Topics
- Aquatic Ecosystems
- Biodiversity
- Conservation Biology
- Coral Reef Ecology
- Distribution Aggregation
- Ecology and Migration of Animal
- Ecosystem Service
- Ecosystem-Level Measuring
- Endangered Species
- Environmental Tourism
- Forest Biome
- Lake Circulation
- Leaf Morphology
- Marine Conservation
- Marine Ecosystems
- Phytoplankton Abundance
- Population Dyanamics
- Semiarid Ecosystem Soil Properties
- Spatial Distribution
- Species Composition
- Species Rarity
- Sustainability Dynamics
- Sustainable Forest Management
- Tropical Aquaculture
- Tropical Ecosystems
Recommended Journals
Article Tools
Article Usage
- Total views: 20282
- [From(publication date):
specialissue-2016 - Mar 31, 2025] - Breakdown by view type
- HTML page views : 18274
- PDF downloads : 2008