Homocysteine Affects Vascular Smooth Muscle Cell Proliferation by Interacting with Angiotensin II Type 1 and Type 2 Receptors
Received: 01-Feb-2021 / Accepted Date: 20-Feb-2021 / Published Date: 27-Feb-2021 DOI: 10.4172/2168-9652.1000294
Abstract
Homocysteine Affects Vascular Smooth Muscle Cell Proliferation by Interacting with Angiotensin II Type 1 and Type 2 Receptors Vascular smooth muscle cell (VSMC) proliferation is accepted to be important in the development of thickness of the arterial wall and causing myocardial infarction, abdominal aortic aneurysm, and atherosclerosis. Another risk factor is asserted to be the elevated plasma homocysteine (Hcy) level. It is thought that there is an interaction between these pathologies, which are caused by hyperhomocysteinemia (HHcy), and renin-angiotensin system (RAS), but the mechanism of this interaction is unknown. Therefore, the investigation of the relationship between Hcy and angiotensin II (Ang II) type 1 receptor (AGTR1) and type 2 receptor(AGTR2) be able to contribute to the explanation of the pathophysiology of cardiovascular diseases. For this purpose, Hcy, Hcy+AGTR1 antagonist (olmesartan), Hcy+AGTR2 agonist (CGP42112A), and Hcy+AGTR1 antagonist+AGTR2 agonist were treated to VSMC cultured from rat thoracic aorta. Cell proliferation was evaluated by MTT after 24 hours. After protein isolation, AGTR1 and AGTR2 protein expressions were determined by Western blotting. And AGTR1 and AGTR2 mRNA expressions were detected by RT-PCR. Hcy increased VSMC proliferation depending on the dose (p<0.01); AGTR1 antagonist and AGTR2 agonist reduced this proliferation (p<0.005). While Hcy increased the expression of AGTR1 protein and mRNA in VSMC, Hcy+AGTR1 antagonist treatment reduced protein and mRNA expression. However, Hcy reduced AGTR2 protein and mRNA expression, Hcy+AGTR2 agonist treatment increased these expressions. As a result, Hcy can be increased VSMC proliferation through AGTR1 and AGTR2; this proliferation can be reduced by the treatment of the AGTR1 antagonist/AGTR2 agonist.
Keywords: Angiotensin II type 1 receptor; Angiotensin II type 2 receptor; Homocysteine; Vascular smooth muscle cell; Cell culture
Introduction
Cardiovascular disease is one of the leading causes of death. Vascular smooth muscle cells (VSMC) are an important component of the vascular wall. It is stated that VSMC’s proliferation increasing is an important risk factor for cardiovascular diseases such as atherosclerosis [1]. In the meantime, plasma homocysteine (Hcy) levels increasing have been suggested as another important risk factor for the development of cardiovascular disease. Hcy is an intermediate of methionine metabolism, and serum Hcy levels are between 5-15 μM. Increased dietary methionine intake, genetic abnormalities, nutritional deficiencies, renal failure, age, and sex lead to elevated serum Hcy levels above 15μM, affecting Hcy metabolism [2-5]. This condition is defined as hyperhomocysteinemia (HHcy) [6]. It has been reported that there is a positive relationship between cardiovascular diseases [7] and HHcy that may play a pivotal role in the development of atherosclerosis in the general population and restenosis after angioplasty [8-11].
Although cardiovascular diseases are observed in hyperhomocysteinemic patients, the mechanisms underlying this process are still unclear. Possible causes have been reported to be vascular endothelial damage and dysfunction, coagulation and fibrinolytic system deterioration, abnormal lipid metabolism, the proliferation of VSMC, and monocyte activation [12-14]. The most emphasized of these mechanisms is the proliferation of VSMC. Some studies suggest that Hcy can induce cellular proliferation by activating protein kinase C15 and MAPK pathway16 by providing c-fos and c-myb expression [15,17]. However, in these studies, the underlying mechanism of Hcy-induced proliferation in VSMC is largely unknown.
It is known that angiotensin II (Ang II) is the primary mediator of the renin-angiotensin system (RAS) and affects the cardiovascular system as systemic, autocrine, or paracrine. Ang II plays an important role in vascular pathogenesis [18,19]. It has been reported that the bioactive effects of Ang II are mediated by Ang II receptor type 1 (AGTR1) and Ang II receptor type 2 (AGTR2), in particular G-proteinlinked receptors (GPCR).
It has been shown in some studies that activation of AGTR1 leads to cardiac remodeling, ventricular hypertrophy, neointima formation, smooth muscle cell (SMC) proliferation, and migration [20,21]. It has been reported that AGTR1 blockage reduces intimal thickening, neointimal formation, and hyperplasia in in vivo models, and VSMC proliferation and migration in in vitro models of vascular damage [22,23]. Therefore, AGTR1 antagonists have been used clinically to treat hypertension, atherosclerosis, cardiovascular, and some renal diseases [24-26]. It has been suggested that AGTR2 exhibits anti-proliferative, pro-apoptotic changes in VSMC and mediates vasodilatation, growth inhibition, mainly by antagonizing AGTR1 [27], and its expression is increased during cardiovascular pathologies [28-30]. Due to their role in the physiological and physiopathological processes of AGTR1 and AGTR2, it is possible that their protein expression and mRNA synthesis can be controlled at certain levels [31-33].
It is thought that not only HHcy-induced VSMC proliferation but RAS activation may play an important role in the pathogenesis of cardiovascular diseases. When the literature studies are examined, it is thought that there is an interaction between HHcy and RAS in cardiovascular diseases, but the mechanism of this interaction is not known. Explaining the proliferative activity of Hcy in VSMC and its relationship with Ang II receptors (AGTR1 and AGTR2) will contribute to the prevention and treatment of cardiovascular diseases.
When this information is taken into consideration, to investigate the direct interaction between Hcy and Ang II receptors on the cardiovascular system without adding Ang II to the medium, cell proliferation and AGTR1/AGTR2 protein and mRNA expression were investigated by applying AGTR1 antagonist (olmesartan) and AGTR2 agonist (CGP42112A) in Hcy-containing medium to VSMC.
Results
Immunohistochemical evaluation
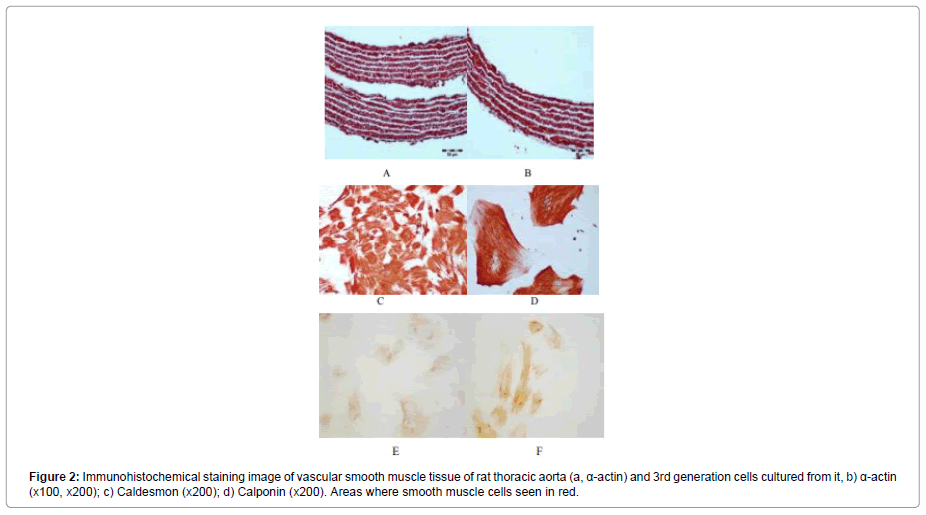
In order to show the purity of the smooth muscle tissue used in culture, immunohistochemical staining of the tissue was performed. The α-actin staining of the smooth muscle tissue preparation was performed. The red-stained areas in the preparations after staining were evaluated as α-actin specific stained smooth muscle cells (Figure 1).
The preparations prepared for cultured 3rd generation cells were stained with α-actin, caldesmon, and calponin for immunohistochemical evaluation. Figure 2a shows that α-actin fibers of all cells and all cells are stained with α-actin. Similarly, the cells stained with caldesmon and calponin are shown in Figure 2b and c.
Effect of different doses of hcy on cell proliferation for 24 and 48 hours
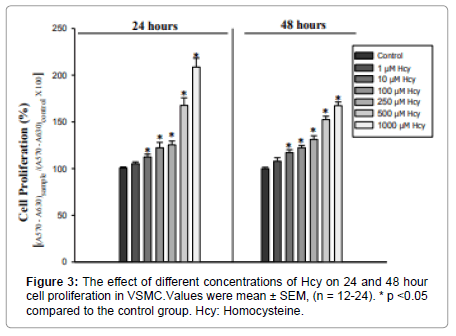
The effect of different doses of Hcy (1, 10, 100, 250, 500, and 1000μM) on 24 and 48-hour cell proliferation was investigated. Medium treated cells were used as a control group. The increase in cell proliferation by 1μM of Hcy was not statistically significant compared to the control group. At 24 hours of cell proliferation, a significant difference was found between the other doses of Hcy [H (6.N=88) =62.6]. There was a significant increase in cell proliferation at 10μM (U=43 p=0.003), 100μM (U=29 p=0.000), 250μM (U=22 p=0.000), 500μM (U=0 p=0.000) ve 1000 μM’lık (U=0 p=0.000) doses of Hcy compared to the control group (Figure 3).
There was also a difference in the 48-hour application [F (6.77) =73.03 p=0.000]. Compared with the control group, 10 100, 250, 500, and 1000μM applications caused a significant increase (p=0.000) (Figure 3).
Effect of Hcy, AGTR1 antagonist and AGTR2 agonist application on cell proliferation
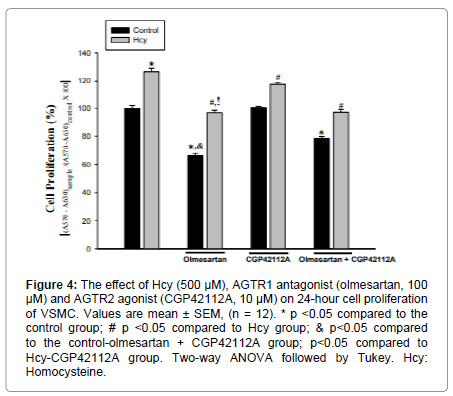
The effect of AGTR1 antagonist and AGTR2 agonist on cell proliferation was found to be significant [F (4.88) =142.54 p=0.000]. When compared with the control group, 100 μM administration of AGTR1 antagonist significantly decreased cell proliferation. (p=0.00). The application of AGTR2 agonist did not cause a statistically significant change in cell proliferation. Co-administration of AGTR1 antagonist and AGTR2 agonist reduced cell proliferation compared to the control group (p=0.000). Only AGTR1 antagonist administration resulted in a greater reduction in cell proliferation compared to the co-administration of AGTR1 antagonist and AGTR2 agonist (p=0.000) (Figure 4).
Figure 4: The effect of Hcy (500 μM), AGTR1 antagonist (olmesartan, 100 μM) and AGTR2 agonist (CGP42112A, 10 μM) on 24-hour cell proliferation of VSMC. Values are mean ± SEM, (n = 12). * p <0.05 compared to the control group; # p <0.05 compared to Hcy group; & p<0.05 compared to the control-olmesartan + CGP42112A group; p<0.05 compared to Hcy-CGP42112A group. Two-way ANOVA followed by Tukey. Hcy: Homocysteine.
There was a significant effect of Hcy on the proliferation of VSMC [F(1,88)=294,96 p=0.000]. Compared to the control group, 500 μM administration of Hcy caused a statistically significant increase in cell proliferation (p=0.000) (Figure 4).
Significant interaction was found between Hcy and AGTR1 antagonist/AGTR2 agonist applications in VSMC proliferation [F(2.88)=10.79 p=0.000]. Cell proliferation was significantly decreased in Hcy+AGTR1 antagonist Hcy+AGTR2 agonist, Hcy+AGTR1 antagonist+AGTR2 agonist groups when compared with the Hcy group (p=0.000) (Figure 5). Co-administration of Hcy and AGTR1 antagonists resulted in a greater reduction in cell proliferation compared to co-administration of Hcy and AGTR2 agonists (p=0.000). There was no statistically significant difference in cell proliferation between Hcy+AGTR1 antagonist and Hcy+AGTR1 antagonist+AGTR2 agonists. Co-administration of the Hcy+ AGTR1 antagonist+AGTR2 agonist resulted in a greater reduction in cell proliferation than the Hcy+AGTR2 agonist administered group (p=0.000) (Figure 4).
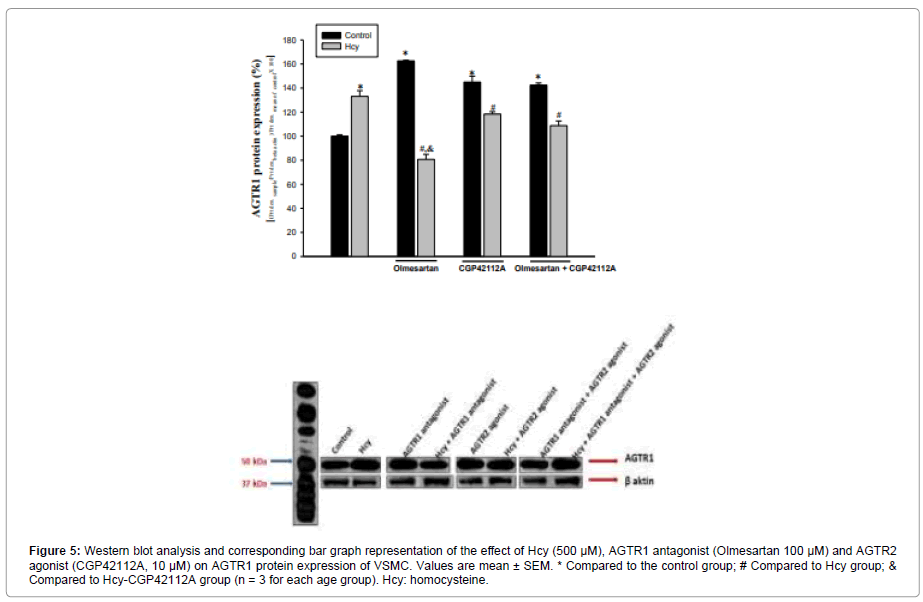
Figure 5: Western blot analysis and corresponding bar graph representation of the effect of Hcy (500 μM), AGTR1 antagonist (Olmesartan 100 μM) and AGTR2 agonist (CGP42112A, 10 μM) on AGTR1 protein expression of VSMC. Values are mean ± SEM. * Compared to the control group; # Compared to Hcy group;& Compared to Hcy-CGP42112A group (n = 3 for each age group). Hcy: homocysteine.
AGTR1 Protein Expression Analysis
AGTR1 antagonist and AGTR2 agonist caused an increase in AGTR1 protein expression (63% and 45%, respectively) compared to the control group. AGTR1 antagonists increased the AGTR1 protein level by 18% more than AGTR2 agonists. Co-administration of AGTR1 antagonist+AGTR2 agonist resulted in a 42% increase in AGTR1 protein expression compared to the control group (Figure 5).
Hcy 500 μM administration also increased AGTR1 by 33% compared to control. Hcy+AGTR1 antagonist administration reduced the AGTR1 protein level by 60% compared to the Hcy treated group. Compared to the Hcy group, AGTR1 protein level decreased by 12% in co-administration of Hcy+AGTR2 agonist. Compared with the Hcy group, the Administration of Hcy+AGTR1 antagonist resulted in a 48% greater reduction in AGTR1 protein level than co-administration of Hcy+AGTR2 agonist (Figure 5).
AGTR1 protein expression decreased by 19% in the Hcy+AGTR1 antagonist+AGTR2 agonist group compared to the Hcy-treated group (Figure 5).
AGTR2 Protein Expression Analysis
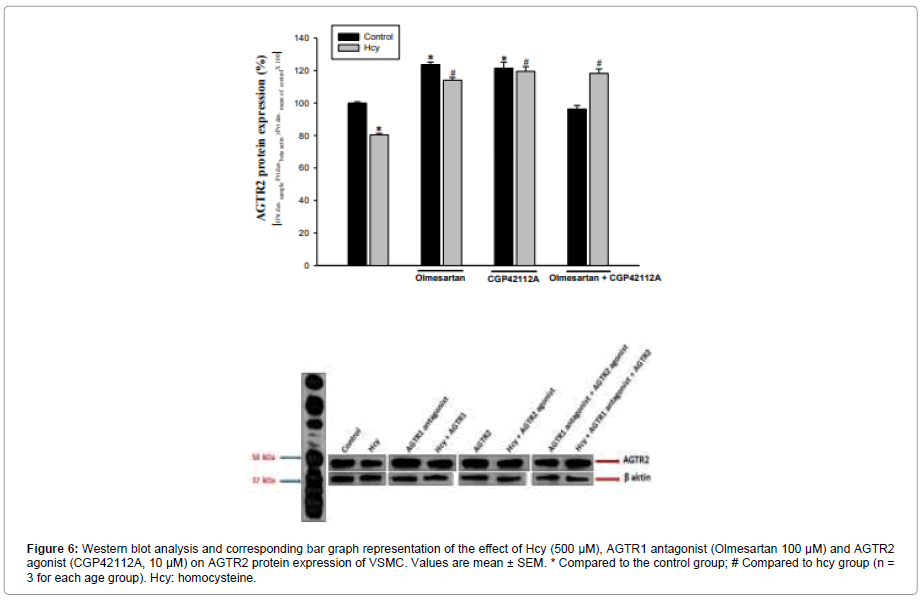
It was determined that AGTR2 protein expression was increased 23% in the AGTR1 antagonist group and 21% in the AGTR2 agonist group compared to the control group. When the AGTR1 antagonist and AGTR2 agonist groups were compared, no significant difference was found between their effects on AGTR2 protein expression compared to the control group. Co-administration of AGTR1 antagonist+AGTR2 agonist did not produce a significant difference (4% reduction) in AGTR2 protein level compared to control (Figure 6).
Figure 6: Western blot analysis and corresponding bar graph representation of the effect of Hcy (500 μM), AGTR1 antagonist (Olmesartan 100 μM) and AGTR2 agonist (CGP42112A, 10 μM) on AGTR2 protein expression of VSMC. Values are mean ± SEM. * Compared to the control group; # Compared to hcy group (n = 3 for each age group). Hcy: homocysteine.
In the Hcy group, AGTR2 expression decreased by 20% compared to the control group. Hcy+AGTR1 antagonist and Hcy+AGTR2 agonist applications caused an increase in AGTR2 level (42%, 49%, respectively, according to the Hcy group), Compared to the Hcy treated group, protein expression increased by 47% in the group of three agents (Hcy+AGTR1 antagonist+AGTR2 agonist), (Figure 6).
AGTR1a mRNA Expression Analysis
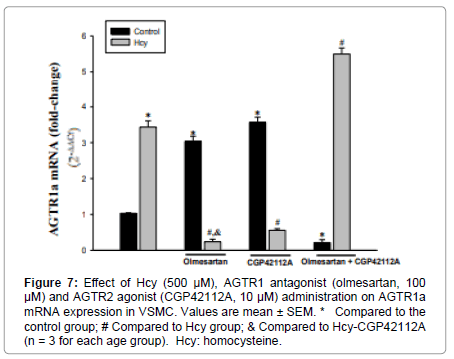
AGTR1a mRNA expression was increased 3-fold in the AGTR1 antagonist group and 3.5-4-fold in the AGTR2 agonist group compared to the control group. Co-administration of AGTR1 antagonist+AGTR2 agonist resulted in a 78% decrease in AGTR1a mRNA expression (Figure 7).
Figure 7: Effect of Hcy (500 μM), AGTR1 antagonist (olmesartan, 100 μM) and AGTR2 agonist (CGP42112A, 10 μM) administration on AGTR1a mRNA expression in VSMC. Values are mean ± SEM. * Compared to the control group; # Compared to Hcy group; & Compared to Hcy-CGP42112A (n = 3 for each age group). Hcy: homocysteine.
Application of 500μM Hcy increased AGTR1a mRNA expression by 3-3.5 fold compared to the control group. Both Hcy+AGTR1 antagonist and Hcy+AGTR2 agonist administration caused a decrease in AGTR1a mRNA expression compared to the Hcy treated group (93%, 84%, respectively).
Compared with Hcy administration, the Hcy+AGTR1 antagonist administration resulted in more reduction in AGTR1a mRNA expression than Hcy+AGTR2 agonist administration (Figure 7).
Co-administration of all three of the Hcy+AGTR1 antagonist+AGTR2 agonist resulted in a 1.5-2-fold increase in AGTR1a expression compared to the Hcy group (Figure 7).
AGTR1b mRNA Expression Analysis
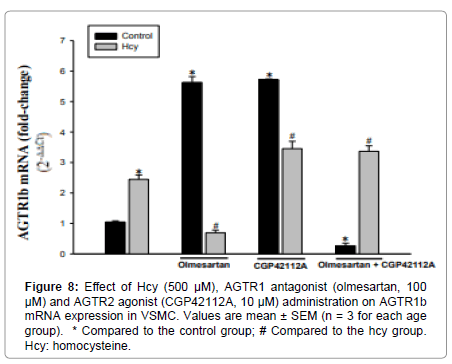
AGTR1b mRNA expression in primary VSMCs increased 5.5-6 times in both AGTR1 antagonist and AGTR2 agonist groups compared to the control group. The administration of AGTR1 antagonist+AGTR2 agonist resulted in a 75% decrease in AGTR1b mRNA expression compared to control (Figure 8).
Hcy treatment of VSMC resulted in a 2-2.5-fold increase in AGTR1b mRNA expression compared to the control group. Compared with the Hcy-treated group, Hcy+AGTR1 antagonist administration reduced expression by 72%. According to the Hcy group, administration of Hcy+AGTR2 agonist and co-administration of all three of the Hcy+AGTR1 antagonist+AGTR2 agonist resulted in a 1-1.5-fold increase in AGTR1b mRNA expression (Figure 8).
AGTR2 mRNA Expression Analysis
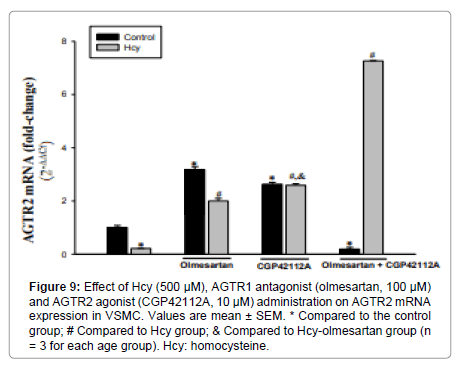
AGTR1 antagonist and AGTR2 agonist applications caused an increase compared to control (3-3.5 fold and 2.5-3 folds, respectively). AGTR1 antagonist caused more AGTR2 expression than AGTR2 agonist. In the AGTR1 antagonist+AGTR2 agonist group, AGTR2 mRNA expression decreased by 81% compared to the control group (Figure 9).
Figure 9: Effect of Hcy (500 μM), AGTR1 antagonist (olmesartan, 100 μM) and AGTR2 agonist (CGP42112A, 10 μM) administration on AGTR2 mRNA expression in VSMC. Values are mean ± SEM. * Compared to the control group; # Compared to Hcy group; & Compared to Hcy-olmesartan group (n = 3 for each age group). Hcy: homocysteine.
Application of 500μM Hcy resulted in a 79% reduction in AGTR2 mRNA expression compared to the control group. Compared to the Hcy group, expression increased 9-9.5 fold in the Hcy+AGTR1 antagonist group and 12 fold in the Hcy+AGTR2 agonist group (Figure 9).
Compared with Hcy administration, the Hcy+AGTR2 agonist administration resulted in a greater increase in AGTR2 mRNA expression than Hcy+AGTR1 antagonist administration (Figure 9).
Co-administration of all three of the Hcy+AGTR1 antagonist+AGTR2 agonist resulted in a very significant increase in AGTR2 mRNA expression compared to Hcy administration (33.5-34 fold, Figure 9).
Discussion
Proteins such as α-SMA, caldesmon, calponin, SM-MHC, smoothelin-A/B, and cellular retinol-binding protein have recently been used to identify SMC [34,35]. Most of these proteins are found in SMC either as a component of contraction or as a regulator of contraction. In order to show that the cells we used were obtained from pure vascular smooth muscle tissue during our experimental study, immunohistochemical staining was performed. Smooth muscle tissue isolated from rat thoracic aorta was stained with VSMC-specific α-SMA. Cells isolated and primarily cultured from this tissue were also stained with α-SMA, caldesmon, and calponin. When considering the roles of AGTR1 and AGTR2 in physiological and physiopathological processes, it is normal to control protein and mRNA syntheses of these receptors at certain levels31-33. In the literature, it is reported that AGTR1 and AGTR2 proteins antagonize each other’s effects. In this case, changes in the balance of protein levels of the receptors will affect cell proliferation. From this point of view, it would be meaningful to discuss receptor expressions and proliferation together to understand whether both the effect of these receptors on cell proliferation and the effect of Hcy on proliferation is related to these receptors.
In our study, 100 μM olmesartan administration without Ang II addition caused an increase in both receptor protein and mRNA expression (protein AGTR1 63%, and AGTR2 23%, mRNA AGTR1a 3 fold, AGTR1b 5.5-6 fold, and AGTR2 3-3.5 fold). This resulted in a 34% reduction in cell proliferation. The antiproliferative effect of olmesartan can be explained by the increase in AGTR2 receptor expression. Also, the presence of olmesartan in the environment may block the proliferative effect by blocking AGTR1.
Consistent with our study, in a study conducted in 2018, Wang et al. reported increased AGTR1a and AGTR1b mRNA expression in adipose tissue after 10 weeks of olmesartan (30 mg/kg/day) administration in the rat [36]. Another study in the heart muscle also showed that olmesartan administration increased AGTR1 mRNA expression [37].
In another study with rat aortic vascular SMC line A7r5, it was reported that 100 μM administration of AGTR1 antagonist reduced proliferation without causing cell apoptosis despite the absence of Ang II38. It has been suggested that this decrease in proliferation was due to Ang II, which is produced locally in tissues by blocking the receptor with AGTR1 antagonist, which does not show the proliferative effect [38].
As a result of our study conducted in our cell culture laboratory in 2018, it was shown that Ang II synthesis might be present in VSMC that was cultured primarily [39]. Based on this information, we may suggest that AGTR1 antagonists may reduce proliferation caused by Ang II production locally in the thoracic aortic SMC with AGTR1 blockade.
The application of 10μM CGP42112A without Hcy and Ang II treatment increased in protein (AGTR2 21%, AGTR1 45%) and mRNA levels (AGTR2 2.5-3 fold, AGTR1a-b 3.5-4 and 5.5-6, respectively). It has been reported that the AGTR2 receptor is abundantly expressed in fetal tissues, but it is found to be low levels in adult tissues, and this level increases again in some pathological conditions such as vascular injury [40,41]. This suggests that AGTR2s play an important role in the remodeling of cells involved in the pathogenesis of cardiovascular and renal diseases. When the studies in the literature are examined, it is suggested that AGTR1 and AGTR2 have a mutually antagonistic effect [40]. It is suggested that when AGTR1 and AGTR2 are stimulated at the same time, the cell growth signals generated by AGTR1s are terminated with AGTR227, 40. While the level of both receptors increased in our study, the unchanged cell proliferation may be due to the antagonism of these receptors. There are a limited number of studies evaluating the effect of CGP42112A on VSMC proliferation in the literature. When these studies are examined, it is seen that there are studies indicating that in accordance with our study, the AGTR2 receptor has no effect on proliferation in addition to the studies showing that it decreases proliferation. As a result, due to its contradictory effects, there is no consensus on the biological consequences of AGTR2 activation. The absence of a similar study in the literature requires further studies to elucidate this issue.
Blocking of AGTR1s with 100μM olmesartan and activation of AGTR2s with 10μM CGP42112A resulted in a 42% increase in AGTR1 protein expression, while it was expected to trigger a significant increase on both receptors; there was no significant change in AGTR2 expression. This may be due to the interaction of the receptors with each other. The 21% reduction in proliferation caused by the co-administration of both agents may be due to the blockage of AGTR1s with olmesartan. Besides, in the literature, the absence of a study investigating the combined effect of AGTR1 and AGTR2 in VSMC makes our findings remarkable. Further studies on how both receptor activities affects each other’s activation under non-pathological conditions will help explain the function of these receptors in physiological cell proliferation.
VSMC proliferation is known to play an important role in the development of serious cardiovascular pathologies such as atherosclerosis. However, it has been suggested that elevated Hcy levels in plasma is another risk factor for cardiovascular diseases, and the underlying mechanisms are tried to be clarified.
Clinical and experimental studies have shown that RAS and HHcy play a role in various vascular pathologies separately. However, the relationship between the activation of both receptors of Ang II and HHcy has not been extensively studied. Moreover, when the current studies are examined, it is noteworthy that no studies are investigating the relationship between Hcy and AGTR2. In conclusion, the effect of AGTR1 and AGTR2 on proliferation caused by Hcy, especially at pathological concentration, and its contribution to vascular injury is not fully known. Therefore, we investigated the effect of AGTR1 antagonist and AGTR2 agonist administration on cell proliferation under high Hcy conditions.
At 24 and 48 hours of Hcy administration at concentrations of 1, 10, 100, 250, 500, and 1000μM, Hcy increases dose-dependent proliferation in VSMC. The increase in AGTR1 protein expression by 33%, AGTR1a, and AGTR1b mRNA levels (3-3.5 and 2-2.5 fold, respectively) of 500 μM Hcy, which leads to a 68% increase in cell proliferation, may explain its proliferative effect. Also, the reduction in AGTR2 protein and mRNA levels (20% and 79%, respectively) appears to support this proliferation.
Consistent with our findings, a study of Hcy (500μM) in VSMC of the human aorta showed increased AGTR1 expression. Increases in AGTR1 expressions have been reported in studies on cell groups such as fibroblast and endothelial cells where Hcy is applied. Also, many studies have investigated the direct effect of Hcy on VSMC proliferation and showed that Hcy increases proliferation. This effect of Hcy is attributed to the activation of various pathways within the cell. It has been suggested that Hcy exhibits proliferative effect by stimulating various pathways, such as increased DAG production and PKC activation, stimulation of c-fos and c-jun transcription mediating expression of many cytokines, particularly the growth factors in the carotid artery, activation of MAPK and the essential transcription factor AP-1 in the cell nucleus. However, it is not known how Hcy initiates activation of these pathways that are stimulated in the intracellular environment.
In our study, 100μM administration of Olmesartan decreased increased AGTR1 protein and mRNA expression (40%, 93%, and 72%, respectively) after Hcy, whereas decreased AGTR2 protein and mRNA levels (43% and 9-9.5 fold) increased. These findings support the reduction of Hcy’s proliferative effect with the administration of olmesartan (23% reduction in proliferation).
Xiao Li Zhan et al. (2018) reported that the application of 500μM Hcy significantly increased cell proliferation in human VSMC and that 1 μM olmesartan reduce this increase by affecting p-ERK1/2 and p-p38MAPK expressions.
In a recent study by Tuoyi Li et al., an increase in vascular wall thickness was reported in Hcy groups after oral administration of Hcy (1.8 g/L) to mice for 4 weeks. Also, in this study, it has been shown Hcy binds directly to AGTR1 and activate these receptors.
In our study, the application of CGP42112A did not cause a significant decrease in the level of increased AGTR1 expression in the presence of Hcy (12% decrease) but caused an increase in decreased AGTR2 expression (protein 49% and mRNA 12-fold). In particular, the increase in AGTR2 expression supports a decrease in cell proliferation. No studies are investigating the relationship between Hcy and AGTR2 in the literature. As stated in a limited number of studies, it has been reported that AGTR2s inhibit proliferation by antagonizing AGTR1 in pathological conditions. Based on this result, it can be suggested that AGTR2 antagonize the proliferative effects of AGTR1 in the HHcy model in our study.
In addition, suppression of proliferation caused by Hcy was greater in olmesartan than in CGP42112A. This may be since olmesartan further reduces the level of AGTR1 protein expression.
In conclusion, our findings show that Hcy may affect proliferation by regulating the balance of expression levels of AGTR1 and AGTR2. However, it is not known how Hcy accomplishes this effect and which pathways it uses for this effect. In this case, it may be thought that Hcy may have performed by interacting directly with the binding sites on AGTR1, such as Ang II, or it may activate intracellular proliferation pathways through different pathways. However, it will be possible to obtain final results with further studies.
As reported by Li et al., it can be suggested that Hcy activates AGTR1 by binding to different sites from Ang II binding sites and converting the Ang II receptor to different conformation. Lin’s study supports our study, but the absence of any other similar study in the literature clearly shows that more studies are needed on this subject.
Conclusion
Because of these new studies and our study, it can be said that Hcy can modulate AGTR1 and AGTR2. Hcy-induced AGTR1 receptor activation should be considered for treatment in patients with HHcy. It may be considered that AGTR antagonists may be an option for the prevention or treatment of HHcy-induced vascular injuries. Therefore, in addition to reducing total plasma Hcy, the use of AGTR1 antagonist and AGTR2 agonists may be useful for these patients.
Methods and Materials
DL-Homocysteine (H4628), Olmesartan (SML1394), and CGP- 42112A (C160) were obtained from Sigma-Aldrich. Beta Actin Polyclonal Antibody (20536-1-AP), AGTR1 Polyclonal Antibody (25343-1-AP), and Peroxidase-conjugated Goat Anti-Rabbit IgG (SA00001-2) were purchased from Proteintech, and Rabbit Polyclonal Anti-Angiotensin II Receptor Type-2 (TA328707) was obtained from Origene. AGTR1a (Rn02758772-s1), AGTR1b (Rn02132799-s1) and AGTR2 (Rn00560677-s1) TaqMan Gene Expression Assays were purchased from Thermo Fisher.
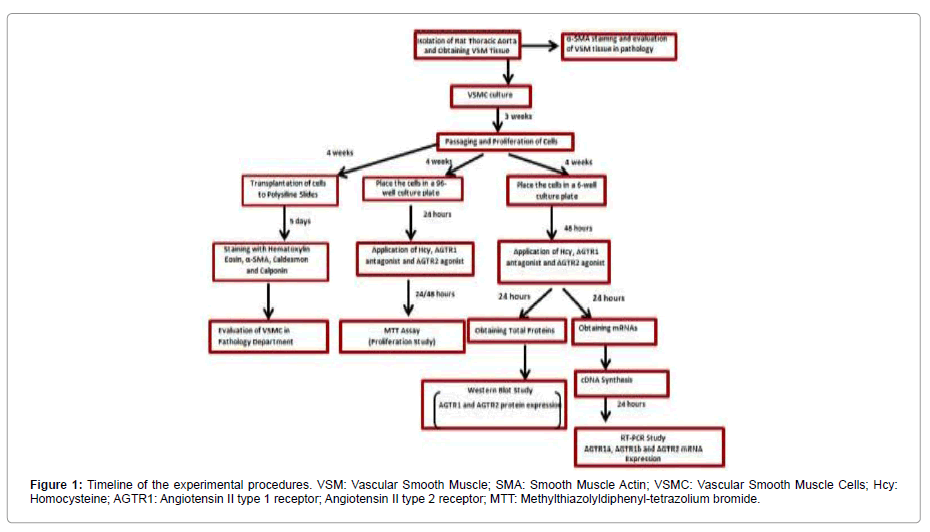
Immunohistochemical evaluation of smooth muscle tissue: The experimental procedure of our study was carried out within the framework of ethical permission obtained from The Cukurova University Faculty of Medicine Medical Sciences Experimental Search and Application Center Ethics Committee (Figure 1). Wistar albino rats (male weighing 180-240G) obtained from the same center was used in the study. The thoracic aorta of the anesthetized rat was isolated from the blood clot in a petri dish with a transfer solution containing HBSS (L-2055, Sigma-Aldrich) and 1% penicillin-streptomycin antibiotic (P 4333, Sigma-Aldrich). The adventitia and endothelial layers of the thoracic aorta were removed on the paraffin block with microsurgical scissors and scalpel. Then, α-actin staining specific for SMC was performed immunohistochemically.
Cell culture and immunohistochemical evaluation: Isolated vessel smooth muscle was dissected into small pieces using a scalpel. The parts were incubated in DMEM (Dulbecco’s MEM, FG-0415, Biochrom AG) for 45 min. Fractions were incubated at 37°C for 45 minutes in DMEM (Dulbecco’s MEM, FG-0415, Biochrom AG). 2g/L BSA (Bovine Serum Albumin, A-3156), 15mM HEPES (H-3375), 250μg/mL soybean trypsin inhibitor (T-6522), 200μM calcium 62.5μg/ mL elastase (E-7885) and 500 μg/mL collagenase type IA (C-2674) from Sigma-Aldrich was added to DMEM. After incubation, 80% DMEM, 20% FBS (v/v) (Fetal Bovine Serum, S-0115, Biochrom AG), and 1% penicillin-streptomycin antibiotic were resuspended with cell medium. It was then placed in a 37˚C incubator containing 5% CO2 - 95% air.
When the cells completely covered the culture plate surface, trypsin EDTA (T-4049, Sigma) was added to the culture plate and incubated at 37°C for 90 seconds and then centrifuged at 800G for 3 minutes. Cell medium was added to the pellet portion to obtain cell suspension. Cultured cells were determined to be smooth muscle cells by α-actin, caldesmon, and calponin staining specific for smooth muscle cells. Immunohistochemical staining of both tissue and cell preparations were performed at the Department of Pathology of Cukurova University Medicine Faculty.
Evaluation of cell proliferation: MTT method was used on cell proliferation studies. Fourth-generation cells were placed in four 96-well culture dishes (5x10³-1x10⁴ cells in each well). Cells were incubated for 24 hours at 37°C. In the first study, to investigate the effect of various doses of Hcy on cell proliferation, Hcy was dissolved in cell medium, and doses of 1, 10, 100, 250, 500, 1000, 1000μM were administered to the cells for 24 and 48 hours.
In the second study, 500μM Hcy, AGTR1 antagonist (olmesartan, 100μM), and AGTR2 agonist (CGP42112A, 10μM) were incubated for 24 hours to investigate the effect of these agents on cell proliferation. After application, MTT (Methylthiazolyl-diphenyl-tetrazolium bromide, M-5655, Sigma) was added to the wells and incubated for 4 hours. The solution was then removed, and DMSO (100μL) was added to each well. Color change after thirty minutes incubation was measured by ELISA reader (Eon, Biotek brand) as absorbance value at 570nm (A570) and 630nm (A630). Subtraction of A570 and A630 values were considered as the index of cell viability. The net absorbance in the wells of cells cultured with cell medium was considered as 100% viability. The viability percentage of the treated cells was calculated using the formula (A570 - A630) sample / (A570 -A630) control X 100.
Western Blot Analysis
For Western blot analysis, 3 x 10⁵ cells were placed in each well of four 6-well plates. Then, 500μM Hcy, AGTR1 antagonist (olmesartan, 100 μM), and AGTR2 agonist (CGP42112A, 10μM) were administered. After 24 hours, 427.5 μL of RIPA buffer (sc-24948, Santa Cruz) was added, and the lysed cells were removed from the surface with a plastic cell scraper. The lysates were centrifuged at 10,000 g for 10 minutes in a centrifuge at +4°C and separated in 10% SDS-PAGE prepared with Acrylamide Kit (161-0173, Bio-rad). Blots were then incubated with primary antibodies (β actin 1:1000, AGTR1 1:500, and AGTR2 1:500) and secondary antibodies (1:10000) with StrepTactin-HRP conjugated (161-0381, Bio-rad). Finally, after the treatment with Enhanced Chemi Luminescence (170-5060, Bio-rad) solution, the irradiation formed was transferred to X-ray film, and protein bands were made visible. X-ray films were displayed on the computer, and quantitative analysis of band protein densities was performed with Image Lab Software 6.0 (Bio-Rad). In this assay, specific protein concentration amounts were normalized by dividing the amount of band density of β-actin protein. The values were compared with the control group, and the band density amounts were expressed as % change: [(Protein densitysample/Protein densityBeta-actin)/Prt densityMean of the control 100]. The protein concentration of the control group was taken as 100%.
PCR Assay
Quantitative measurements of mRNAs encoding AGTR1a, AGTR1b, AGTR2, and actin proteins were performed by RT-PCR. For this purpose, 3x10⁵ cells were transplanted into each well of four 6-well plates as in the Western blot study. Then, 500μM Hcy, AGTR1 antagonist (olmesartan, 100μM), and AGTR2 agonist (CGP42112A, 10μM) were administered. After 24 hours, 500μL of Trizol was added, and the cells were removed from the surface through a plastic cell scraper. The lysate samples were then centrifuged at 10.000G for 10 minutes in a centrifuge at 4°C, and 105μL of chloroform was added to the supernatant. After centrifugation at 10.000G for 15 minutes, it was observed that the solution in Eppendorf was divided into three phases as DNA, protein, and RNA from bottom to top. From these three phases, the same amount of isopropanol was added to the 70% transparent portion of the supernatant and centrifuged at 10.000G for 15 minutes. 1 mL of 75% ethyl alcohol was added to the pellet and centrifuged again at 10.000G for 5 minutes. Finally, 20uL of DNAase and RNAase-free water was added to the supernatant, and mRNA samples were prepared.
In order to determine the purity of RNA extract, 1.5μL was taken from each mRNA sample, and absorbance values were measured at 260 and 280nm in spectrophotometer ve the ratio of these values was taken. A value above 1.8 was accepted for RNA purity of samples.
Supplementary DNA (cDNA) was synthesized by adding 10μL of mRNA to 10μL of the solution prepared using the Reverse Transcription Kit (RT Buffer (10%), dNTP (8%), Rendom Primary (20%) and cDNA reverse transcriptase enzyme (10%)).
Finally, the newly synthesized cDNAs were amplified using Taqman Universal Master Mix (50%), Taqman Exp Ass kit (5%), DEPC water (35%), and mRNA samples (10%). All samples were normalized with β-actin. RT-PCR gene expression study was repeated 3 times in total, and Ct values were analyzed. Livak method was used for the comparative analysis of Ct values. After averaging the Ct values of the reference group, the ΔCt value of the reference was calculated by subtracting β actin values from the target gene of the reference group. The ΔCt value of the samples was also determined by subtracting the β actin Ct value from the target gene Ct value of the samples. To calculate the ΔCt, The ΔCt values of the reference group were subtracted from the ΔCt values of the samples. Finally, the 2- value of these was calculated, and the amount of fold change of mRNA expression according to the reference group was calculated as follows. 2-[(Ct target - CtActin) sample - (Ct target - CtActin) reference].
Statistical Analysis
Statistical analysis of the data was performed with the SPSS 16.0 program. In the comparison of normal distribution data, in cell proliferation studies One - way ANAVO was used in Hcy ‘s dose study, and Two-way ANAVO was used to evaluate Hcy and Ang II receptor interactions. Dunnet test (if compared to control) and Tukey test were performed for multiple comparisons between the groups. A comparison of non-normal data was performed with Kruskal Wallis. Bonferroni-corrected Mann-Whitney U test was used for comparisons between groups. Results were within 95% confidence interval and p<0.05 was considered significant.
Protein expression by western blot and mRNA expression by RTPCR were analyzed as mean and standard error (SE).
Conflict of Interest
There is no conflict of interest for all authors.
Ethical Approval
This study was approved by Cukurova University Faculty of Medicine Medical Sciences Experimental Search and Application Center Ethics Committee (Date: July 27, 2015, and Decision number: 2).
Funding
This work was supported by the Scientific Research Office of Cukurova University (I.U BAP, Project numbers: TDK-2015-5274).
Acknowledgment
Authors’ contributions: Z.G.Y. contributed to conceiving and designing the study, data collection, analysis, and manuscript preparation. A.D. and K.A providing study design and critical revisions that are important for the intellectual content. Z.C., H.O., and S.Z. contributed to data collection.
References
- Schwartz SM, Ross R (1984) Cellular proliferation in atherosclerosis and hypertension. Prog Card Dise 26: 355-372.
- Eikelboom JW, Lonn E, Genest J, Jr Hankey G, Yusuf S (1999) Homocyst(e) ine and cardiovascular disease: a critical review of the epidemiologic evidence. Ann Inter Med 131: 363-375.
- Sakamoto A, Nishimura Y, Ono H, Sakura N (2002) Betaine and homocysteine concentrations in foods. Pediatr Int 4: 409-413.
- Duell PB, Malinow MR (1997) Homocyst(e)ine: an important risk factor for atherosclerotic vascular disease. Curr Opin Lipidol 8: 28-34.
- Rodrigo R, Passalacqua W, Araya J, Orellana M, Rivera G (2003) Homocysteine and essential hypertension. J Clin Pharmacol 43: 1299-1306.
- Seshadri S (2002) Plasma homocysteine as a risk factor for dementia and AlzheimerÂ’s disease. N Engl J Med 346: 476-483.
- Masaki T (2007) Hyperhomocysteinemia is associated with visceral adiposity in Japanese patients with type 2 diabetes mellitus. Diabetes Res Clin Pract 77: 168-173.
- Schnyder G, Roffi M, Flammer Y, Pin R, Hess OM (2002) Association of plasma homocysteine with restenosis after percutaneous coronary angioplasty. Eur Heart J 23: 726-733.
- Ganguly P, Alam SF (2015) Role of homocysteine in the development of cardiovascular disease. Nutr J 14: 6-15.
- Guthikonda S, Haynes WG (2006) Homocysteine: role and implications in atherosclerosis. Curr Athero Rep 8: 100-106.
- McCully KS (2015) Homocysteine and the pathogenesis of atherosclerosis. Expert Rev Clin Pharmacol 8: 211-219.
- Jakovljevic B, Gasic B, Kovacevic P, Rajkovaca Z, Kovacevic T (2015) Homocystein as a risk factor for developing complications in chronic renal failure. Materia Socio-Medica 27: 95-98.
- Buccianti G (2004) Plasma homocysteine levels and cardiovascular mortality in patients with end-stage renal disease. J Neph 17: 405-410.
- Heinz J, Kropf S, Luley C, Dierkes J (2009) Homocysteine as a risk factor for cardiovascular disease in patients treated by dialysis: A meta-analysis. Am J Kidney Dis 54: 478-489.
- Dalton ML, Gadson PF, Jr Wrenn RW, Rosenquist TH (1997) Homocysteine signal cascade: production of phospholipids, activation of protein kinase C, and the induction of c-fos and c-myb in smooth muscle cells. Faseb J 11: 703-711.
- Woo DK, Dudrick SJ, Sumpio BE (2000) Homocysteine stimulates MAP kinase in bovine aortic smooth muscle cells. Surg 128: 59-66.
- Liu X, Luo F, Li J, Wu W, Li H (2008) Homocysteine induces connective tissue growth factor expression in vascular smooth muscle cells. J Thromb Haemost 6: 184-192.
- Jiang X, Carretero OA (2010) Local angiotensin II aggravates cardiac remodeling in hypertension. Am J Physiol Heart C 299: 1328-1338.
- Bader J (2001) Tissue renin-angiotensin systems: new insights from experimental animal models in hypertension research. J Mol Med 79: 76-102.
- Kaschina E, Unger T (2003) Angiotensin AT1/AT2 receptors: Regulation, signalling and function. Blood Pressure 12: 70-88.
- Kassab S (2006) The angiotensin type 1 receptor antagonist valsartan attenuates pathological ventricular hypertrophy induced by hyperhomocysteinemia in rats. JRAAS 7: 206-211.
- Kohno M (2000) Effects of valsartan on angiotensin II-induced migration of human coronary artery smooth muscle cells. J Japanese Soc Hypertens 23: 677-681.
- Liu HW (2002) Effect of estrogen and AT1 receptor blocker on neointima formation. Hypertens 40: 451-457.
- Ostergren J (2004) Candesartan for the treatment of hypertension and heart failure. Expert Opin Pharmaco 5: 1589-1597.
- Ferrario CM (2002) Use of angiotensin II receptor blockers in animal models of atherosclerosis. Am J Hypertens 15: 9-13.
- Rayner B, Jaeger B, Verboom CN, Pascoe M (2004) Potential renoprotective effects of the angiotensin receptor blocker eprosartan: A review of preliminary renal studies. Cardiovasc J South Afr 15: 32-37.
- Horiuchi M, Akishita M, Dzau VJ (1999) Recent progress in angiotensin II type 2 receptor research in the cardiovascular system. Hypertens 33: 613-621.
- Wharton J (1998) Differential distribution of angiotensin AT2 receptors in the normal and failing human heart. J Pharmacol Experiment Therapeut 284: 323- 336.
- Griendling KK, Lassegue B, Alexander RW (1996) Angiotensin receptors and their therapeutic implications. Annu Rev Pharmacol 36: 281-306.
- Lopez JJ (1994) Distribution and function of cardiac angiotensin AT1- and AT2- receptor subtypes in hypertrophied rat hearts. Am J Physiol 267: 844-852.
- Duffy AA, Martin MM, Elton TS (2004) Transcriptional regulation of the AT1 receptor gene in immortalized human trophoblast cells. Biochem 1680: 158- 170.
- Ikeda Y (1999) Transcriptional suppression of rat angiotensin AT1a receptor gene expression by interferon-gamma in vascular smooth muscle cells. Biochem Biophys Res Communicat 262: 494-498.
- Kambe T, Kinjyo N, Hiruki H, Kubo T (2004) Basal transcriptional regulation of rat AT1 angiotensin II receptor gene expression. Clin Experiment Pharmacol Physiol 31: 96-100.
- Jones BA, Aly HM, Forsyth EA, Sidawy AN (1996) Phenotypic characterization of human smooth muscle cells derived from atherosclerotic tibial and peroneal arteries. J Vasc Surg 24: 883-891.
- Owens GK, Kumar MS, Wamhoff BR (2004) Molecular regulation of vascular smooth muscle cell differentiation in development and disease. Physiol Rev 84: 767-801.
- Wang TJ, Lian GL, Cai XQ, Lin ZH, Xie LD (2018) Effect of prehypertensive losartan therapy on AT1R and ATRAP methylation of adipose tissue in the later life of high-fat-fed spontaneously hypertensive rats. Mol Med Rep 17: 1753- 1761.
- Sukumaran V (2011) Olmesartan, an AT1 antagonist, attenuates oxidative stress, endoplasmic reticulum stress and cardiac inflammatory mediators in rats with heart failure induced by experimental autoimmune myocarditis. Int J Biol Sci 7: 154-167.
- Tambelline N (2012) The effect of losartan on angiotensin ii-induced cell proliferation in a rat aorta smooth muscle cell line. Braz Arch Biol Techn 55: 263-268.
- Horiuchi M (2002) Recent progress in AT1 and AT2 receptor research. Japanese J Clin Med 60: 1873-1880.
- Louis S, Saward L, Zahradka P (2011) Both AT (1) and AT (2) receptors mediate proliferation and migration of porcine vascular smooth muscle cells. Am J Physiol Heart Circulat Physiol 301: 746-756.
- Mifune M, Sasamura H, Shimizu-Hirota R, Miyazaki H, Saruta T (2000) Angiotensin II type 2 receptors stimulate collagen synthesis in cultured vascular smooth muscle cells. Hypertens 36: 845-850.
Citation: Yasar ZG, Dogan A, Akillioglu K, Cicek Z, Zorludemir S, et al. (2021) Homocysteine Affects Vascular Smooth Muscle Cell Proliferation by Interacting with Angiotensin II Type 1 and Type 2 Receptors. Biochem Physiol 10: 294. DOI: 10.4172/2168-9652.1000294
Copyright: © 2021 Yasar ZG, et al. This is an open-access article distributed under the terms of the Creative Commons Attribution License, which permits unrestricted use, distribution, and reproduction in any medium, provided the original author and source are credited.
Share This Article
Recommended Journals
Open Access Journals
Article Tools
Article Usage
- Total views: 1955
- [From(publication date): 0-2021 - Nov 21, 2024]
- Breakdown by view type
- HTML page views: 1228
- PDF downloads: 727
