Research Article Open Access
Hif1α Mediated Ho-1 Expression in Fish Adipocytes: Role of Hypoxia In Ennore Estuary
Padmini Ekambaram1* and Parimala Parasuraman21Associate Professor in Biochemistry, Bharathi Women’s College, Affiliated to University of Madras, Chennai 600108, Tamil Nadu, India
2Research Scholar, Bharathi Women’s College, Affiliated to University of Madras, Chennai 600108, Tamil Nadu, India
- *Corresponding Author:
- Padmini E
Associate Professor in Biochemistry,
Bharathi Women’s College, Affiliated to University of Madras
Chennai 600108, Tamil Nadu, India
Tel: +91-044-26213748
Fax: +91-044-25280473
E-mail: ntrfbwc@gmail.com
Received date: May 18, 2017; Accepted date: May 23, 2017; Published date: May 29, 2017
Citation: Ekambaram P, Parasuraman P (2017) Hif1α Mediated Ho-1 Expression in Fish Adipocytes: Role of Hypoxia In Ennore Estuary. J Marine Sci Res Dev 7:230. doi: 10.4172/2155-9910.1000230
Copyright: © 2017 Ekambaram P, et al. This is an open-access article distributed under the terms of the Creative Commons Attribution License, which permits unrestricted use, distribution, and reproduction in any medium, provided the original author and source are credited.
Visit for more related articles at Journal of Marine Science: Research & Development
Abstract
Heme oxygenase-1 (HO-1), an inducible stress protein; is involved in the regulation of adipogenesis, cellular bioenergetics and cytoprotective mechanism against hypoxia induced oxidative stress. Polluted aquatic environment leads to large oxygen fluctuations which may cause alteration in fish adaptation mechanism by HIF1α regulation. Environmental pollutants have a high tendency to accumulate, persist and bio-concentrate in adipocytes due to its lipophilic nature which ultimately causes adipocytes hypoxia that in turn affects metabolic energy balance. CYP1A2 and HO-1 are the chief detoxifying and cytoprotective enzymes involved in the oxidative metabolism of a wide variety of pollutants and its mediated cytotoxic products. The key role of hypoxia and its mediated signaling protein changes in fish adipocytes due to low dissolved oxygen in Ennore estuary was demonstrated in our previous work. Therefore, we analyzed the effect of pollutants induced hypoxia by assessing CD, HNE, TAC, G3PDH, ATP, HIF1α, HO-1 and CYP1A2 in fish adipocytes of control/unpolluted site and test/polluted site. Increase in CD, HNE, HIF1α, HO-1 along with a decrease in TAC, G3PDH, ATP and CYP1A2 observed in test adipocytes. From the results achieved, it shows that induction of HO-1 by HIF1α is crucial in maintaining the cell integrity to secure adipocytes and its maturation in the fish collected from the hypoxic environment. This study also highlights the role of HIF1α and HO-1 in regulating the expression of CYP1A2 during pollutants induced hypoxic condition.
Keywords
Adipocytes; Energy; Hypoxia; Metabolism; Pollutants
Introduction
Molecular mechanisms during depleted oxygen condition and strategy behind the adipocyte cell survival mechanism are poorly understood. In particular the responding regulatory mechanism is almost unknown in fish adipocytes. Estuarine ecosystems are more tender to hypoxic conditions in which fish exhibit a wide range of tactics to counteract aquatic hypoxia. In response to hypoxia, cells can sense oxygen depletion and adapt to the hypoxia environment through a series of distinctive biological processes [1]. Adipocytes are the principal cells involved in the regulation of energy homeostasis for sustaining cell survival in the hypoxic environment. In the present study, heme oxygenase-1 (HO-1, small heat shock protein, MW: 32kDa) is analyzed in the adipocytes of grey mullet, which is a better marker of the cellular response to a hypoxic insult [2]. Here the pollutants induced stress condition is described as pollutants induced hypoxia, as pollutants have a major role in triggering cellular hypoxia [3]. HO-1 is an inducible gene whose transcription is regulated in response to a wide variety of cellular stress stimuli, including oxidative stress, hypoxia and inflammatory cytokines [4]. HO-1, a metabolic enzyme utilizes electrons supplied by NADPH CYP 450 reductase (CPR) and oxygen to break the heme moiety to liberate biliverdin (BV), carbon monoxide (CO) and iron. Though heme acts as a prime part of numerous metabolic enzymes as a core catalytic unit and as a cofactor in enzymatic processes (e.g., cytochrome p450, iNOS and guanylate cyclase) [5], its accumulation during oxidative stress (OS) may cause extensive toxicity and free radical generation. Hence it is degraded by the cytoprotective enzyme HO-1, which is the only catalytic process that enables removal of toxic heme.
More free radicals are likely to be produced during cellular hypoxia. Accumulation of free radicals in turn leads to the production of ROS and RNS which ultimately results in the generation of cellular antioxidants in an attempt to counteract the possible damage [6]. Present work encompasses two different areas of toxicological research by analyzing the oxidants such as conjugated diene (CD), hydroxyl nonenal (HNE) and antioxidant status by total antioxidant capacity (TAC). Peroxidation of lipids leads to the formation of primary product conjugated dienes (CDs) and CD on further oxidation leads to the formation of HNE, which serves as the end product [7,8]. Analyzing OS marker is crucial as it diffuse within the cell directly by reacting with cell surface proteins, thereby causing secondary alterations in the structure and functions of cells [9]. Thus it causes cellular redox signal transduction, which in turn propagates their noxious action [10]. The measure of total antioxidant capacity (TAC) is considered to be vital, as it measures the cumulative action of all the antioxidants during stress condition [11].
Metabolism is the foundation of biological system which allows the organisms to respond and adapt to any intracellular and extracellular changes during stress. Lipid metabolism plays a vital role, which helps to maintain a milieu conductive to the production and storage of energy and to cellular growth [12]. Triacylglycerol (TG) serves as the major energy storage form in adipocytes. Fatty acids (namely, long chain acyl- CoA) and glycerol 3-phosphate (G3P) serves as the direct precursors for TG synthesis in adipose tissue. Glycerol 3-phosphate dehydrogenase (GPDH) is a key enzyme providing glycerol 3-phosphate for TG synthesis in adipose tissue and is regarded as a marker for adipocyte differentiation. GPDH is the target gene regulated by peroxisome proliferator activated receptor γ (PPARγ) which is a crucial activator of adipogenesis [13].
Environmental hypoxia often evokes ATP alteration in the stressed cells, which is highly detrimental in the cellular bioenergetics [14]. High-energy phosphate in the form of ATP is required for virtually all synthetic and degradative processes within the cell, including membrane transport, protein synthesis and lipogenesis [15]. ATP, the energy store of cells, is produced mainly by oxidative phosphorylation in the electron transport system [16] or by glycolytic pathway [17]. The major causes of ATP depletion are reduced supply of oxygen, nutrients, mitochondrial damage and the actions of toxins [18].
Hypoxia-inducible factor 1 (HIF1) is considered to be the most critical transcription factor and a master regulator that plays a key role in regulation of metabolic adaptation during hypoxia. It is a heterodimer composed of α and β subunits in which HIF1α is sensitive to oxygen tension, whereas HIF1β (also referred to as aryl hydrocarbon receptor nuclear translocator, ARNT) is a constitutively expressed and oxygeninsensitive subunit [19]. It activates a broad range of genes which are protecting cells against hypoxia [20]. Under normoxia, HIF-1α has an extremely short half-life of less than five minutes, being continually synthesized and degraded, mediated by the hydroxylation of two prolyl residues (402 and 564) in the oxygen- dependent degradation domain (ODD) by the specific prolyl hydroxylases and by preventing it from associating with ARNT. Under hypoxic conditions, the hydroxylation of prolyl residues is inhibited, leading to stabilization of HIF-1α and which dimerizes with ARNT, that evades the proteasomal destruction leading to its accumulation [21,22] which in turn regulate the adaptation mechanism for cell survival [23].
CYP450 are known as mixed function oxidases involved in the oxidative metabolism of xenobiotics [24] and it is regulated by HO-1 and HIF1α [21,25]. Typically, the substrates for these enzymes are highly lipophilic, so they tend to escape from the liver detoxification system and accumulate in fat tissue where they are metabolized by the P450s to produce a more water-soluble product, facilitating their disposition and clearance. Similar to HO-1, the P450 enzymes use molecular oxygen and electrons provided by CPR to insert an oxygen atom into a substrate molecule [25]. Xenobiotics bind with the AHR (aryl hydrocarbon receptor), inducing the formation of nuclear AHRARNT heterodimers, which up regulates genes encoding xenobiotics metabolizing enzymes [26]. Minghua et al. [27] reported that ARNT has differential potential to form heterodimers with either the AHR or HIF1α to mediate biological responses against xenobiotics exposure and low oxygen tension. In the present study CYP1A2 was assessed as it is a major phase I enzyme of the CYP450 family and a critical indicator of environmental exposure to hypoxia [28].
The molecular mechanism by which cells respond to hypoxia and the process of metabolic reprogramming is unknown. Understanding the molecular changes in fish exposed to hypoxic stress could reveal novel mechanisms of stress tolerance that may shed new light on adipocyte biology and remodeling during a natural environmental stress condition. Therefore, here we outline the key components of the cellular hypoxia signaling pathway mediated metabolic reprogramming in fish adipocytes which necessitates the rapid knowledge of adaptive changes in metabolic organization.
Materials and Methods
Study site and study animal sampling
Mugil cephalus (M.cephalus) commonly known as grey mullet with an average length of 30-32 cm were collected from Kovalam (control) and Ennore (test) estuaries using baited minnow traps, which were situated on the east coast of India. Contamination of this estuary by heavy metals and the difference in physical, chemical and biological characteristics has already been confirmed by previous studies [29- 33]. Water quality was assessed by analyzing the dissolved oxygen level of both Kovalam and Ennore estuary.The dissolved oxygen level was estimated by CHEMLINE portable dissolved oxygen meter CL-930 and it is expressed as ppm. Simultaneously fish were collected from both estuaries and placed immediately into insulated containers filled with aerated estuarine water at ambient temperature (25-30°C) and salinity (24-29 ppt). Fish were maintained in the above specified conditions for 4-5 hrs until the start of the experimental procedure for the isolation of adipocytes. The experiments were divided into 3 batches with minimum 5 samples at each time.
Adipocytes isolation
Subcutaneous adipose tissue was carefully removed from each fish (n=20), then it was washed with distilled water separately and the adipocytes were isolated by the method of Rodbell (1964) [34] with some minor modifications (at temperature 18°C). Briefly, adipose tissue was cut into small pieces and incubated in polypropylene tubes with isosmotic Krebs’s buffer (pH 7.4, 280 mM) containing collagenase type II (0.3 mg/ml) and 1% BSA without glucose for 60 min in a water bath under gentle shaking at 18°C. The cell suspension was filtered through a 100 μm filter to remove large undigested tissue particles and centrifuged at 700 xg for 10 min. Then the pellet was washed by flotation. Finally, floating cells were carefully removed as it contains mature adipocytes [35]. The isolated adipocytes from each fish (control and test fish) were separately used for following experiments.
Cell viability assay
The viability of adipocytes was determined by trypan blue staining [36]. This dye exclusion test is used to determine the number of viable cells present in a cell suspension and is based on the principle that live cells possess intact cell membrane that exclude dyes such as trypan blue, whereas dead cells do not exclude dyes. In brief, suspension cells were harvested by centrifugation. An equal volume of 0.4% (w/v) trypan blue was added to a cell suspension at a concentration of approximately 1 × 10⁶ per mL. The cells were then incubated for 3 min and loaded into a hemacytometer. Nonviable, deep blue cells as well as viable, clear cells were counted in three separate fields using bright field optics. The viability percentage was calculated by dividing the number of viable cells by the number of total cells and multiplying it by 100.
Estimation of protein
To estimate the level of protein, adipocytes were harvested in cell suspension buffer (Kreb’s buffer pH-7.4), centrifuged (15 minutes at 2000 rpm), and resuspended in cell lysis buffer (20 mM Tris pH 7.5, 1% Triton X- 100, 1 mM ethylenediamine tetraacetic acid (EDTA), 1 mM ethylene glycol-bis (2-aminoethyl)-tetraacetic acid (EGTA), 1 mM phenylmethyl sulphonylfluoride (PMSF), 5 mM sodium pyrophosphate, 2 mM sodium orthovanadate and protease inhibitor). The cell suspension was incubated for 30 minutes at 4°C, with occasional shaking and centrifuged at 16,000 xg for 10 minutes in 4°C to remove the cellular debris. The supernatant was the cell lysate, whose protein concentration was determined by the classical method of Bradford [37] with coomassie brilliant blue G-250, using bovine serum albumin as a standard. The protein concentration was expressed as mg protein/g of fresh weight of adipose tissue. Based on the requirement of the sample for each experiment, sample was diluted to acquire 100 μg of protein.
Estimation of stress markers
Conjugated diene was measured by the method of Recknagel and Glende [38]. HNE was assessed by ELISA kit MBS161454 (My Biosource) following the manufacturer’s instructions.
Estimation of TAC
TAC was evaluated by the method described by Prieto et al. [39] and expressed as Trolox equivalent in mmol /L.
Assay of GPDH
GPDH activity was measured by following Sottile and Seuwen [40] with slight modifications. Cells were washed with PBS and the assay mixture was added to the tube (0.1 M triethanolamine, 2.5 mM EDTA, 0.1 mM b-mercaptoethanol, and 334 mM NADH, pH 7.7) and tubes were incubated for 10 min at 30°C. The reaction was started by adding 4 mM dihydroxyacetone phosphate. GPDH activity was measured spectrophotometrically at 340 nm. GPDH served as the standard for the assay and results were expressed as mU/mg protein (1 U=1 mmol NADH/min).
Estimation of ATP/ADP ratio
The ratio of ATP to ADP was determined by HPLC according to the method of Anderson and Murphy [41].
Quantification of HIF1α, CYP1A2 and HO-1 using ELISA
HIF1α, CYP1A2, and HO-1 were quantified using HIF1α ELISA kit (CSB-E12112H, CUSA BIOTECh, China, 96 T), CYP1A2 ELISA kit (E93294Hu, Prolab marketing PVT ltd), HO-1 (ADI-EKS-800, Biogeniux) according to the manufacturer’s instructions.
Statistical Analysis
Data were analyzed using statistical software package version 7.0. Student’s t-test was used to ascertain the significance of variations between control and test fish adipocytes. All data were presented as mean ± SD. Differences were considered significant at p<0.05, p<0.01 and p<0.001.
Results
Dissolved oxygen level
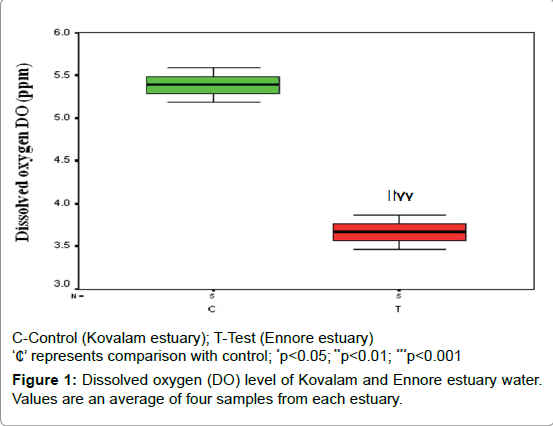
The dissolved oxygen level is represented by Figure 1 which depicts the decreased DO level (29%; p<0.01) in Ennore estuary water when compared to Kovalam estuary water.
Cell viability
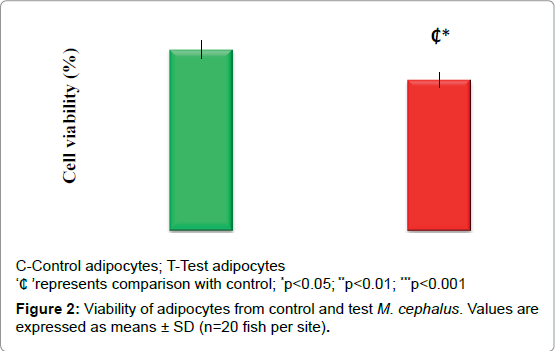
Figure 2 depicts the cell viability. Decrease in the cell viability (17%; p<0.05) observed in test adipocytes when compared to control adipocytes.
Level of protein
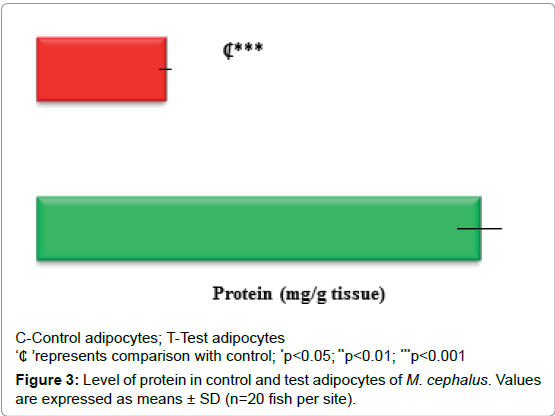
Decreased protein concentration (71%, p<0.001) observed in test adipocytes than control adipocytes (Figure 3).
Oxidant status
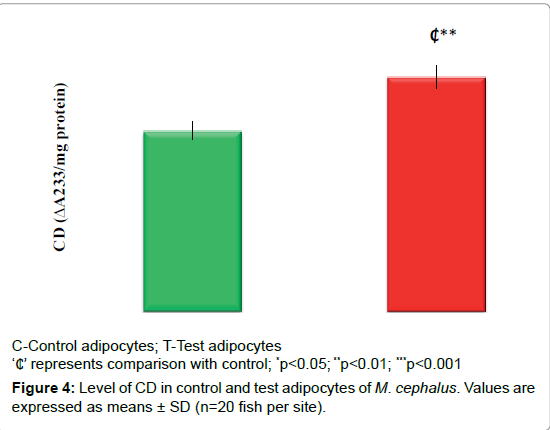
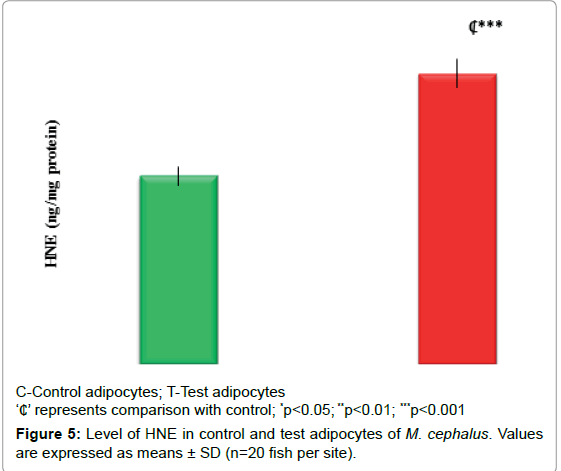
Figures 4 and 5 displays the OS markers (CD & HNE). It depicts an increase in CD (30%, p<0.01) and HNE level (55%, p<0.001) in test adipocytes than control adipocytes.
Antioxidant status
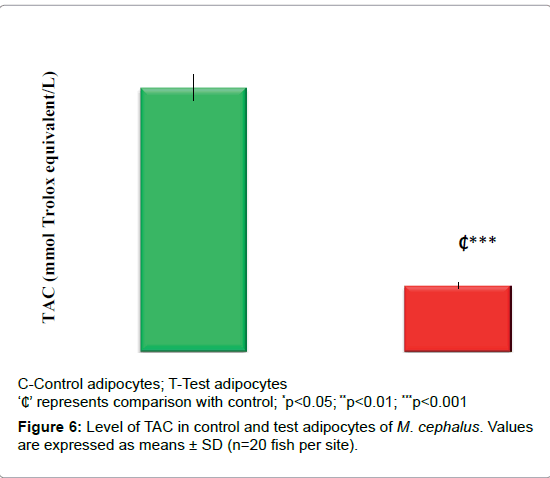
Decrease in the TAC (75%, p<0.001) observed in test adipocytes than control adipocytes (Figure 6).
Level of G3PDH and ATP/ADP ratio
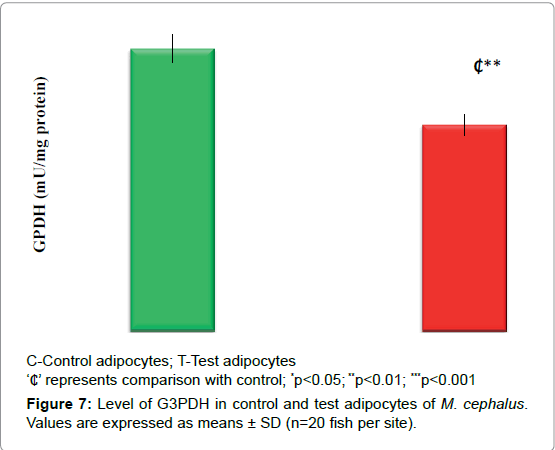
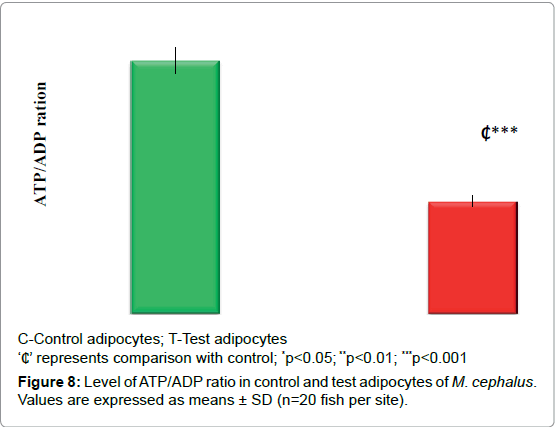
Figures 7 and 8 demonstrates the level of G3PDH and ATP/ADP ratio. In test adipocytes G3PDH and ATP/ADP ratio decreased by 27% (p<0.01) and 56% (p<0.001) than control adipocytes.
Expression of HIF1α
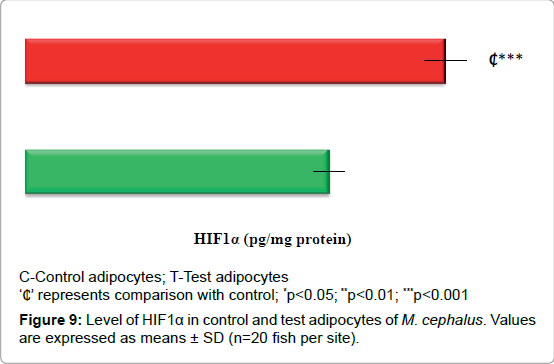
Figure 9 depicts the increase in the expression of HIF1α by 38% (p<0.001) in test adipocytes than control adipocytes.
Expression of HO-1
Expression of HO-1 is presented in Figure 10. Increase in the expression of HO-1 by 44% (p<0.001) observed in test adipocytes than control adipocytes.
Expression of CYP1A2
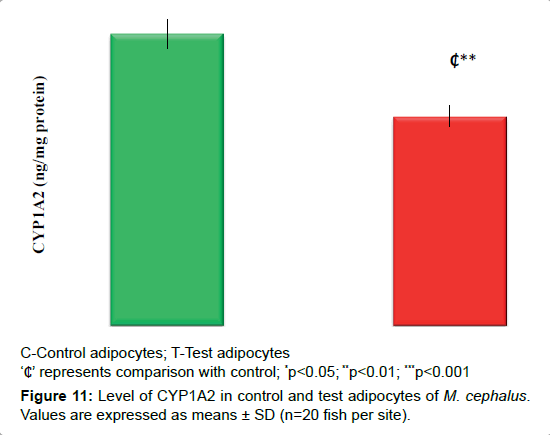
Decrease in the expression of CYP1A2 by 28% (p<0.01) observed in test adipocytes than control adipocytes (Figure 11).
Discussion
Estuarine hypoxia is a key causative factor of environmental pollutants, evidenced by low dissolved oxygen in Ennore estuary when compared to Kovalam estuary. Hypoxia triggers the metabolic alterations in the adipose tissue which results in stress associated tissue dysfunction. Due to the importance of adipocytes in energy regulations, current research is directed towards finding out signaling proteins impression involved in the adaptive strategy of fish adipocytes during pollutants induced hypoxia and its mediated stressed condition. Cytotoxic effect under pollutants exposure is confirmed by the cell viability and the protein level, which were found to be declining in the test fish adipocytes. The present study reveals that pollutants serve as the key factor in the development of considerable distress in fish adipocytes. It was depicted by the level of CD and HNE acclivity significantly with the diminished TAC level in test fish adipocytes.
Zhang and his colleagues [42] reported that accumulation of intracellular peroxide products in adipocytes/adipose tissues contributes to lipolytic activation. Coherently G3PDH level was found to be decreased in test fish adipocytes when compared to control fish adipocytes. Loss of G3PDH in adipose tissue may lead to loss of fat mass [43] which depicts the existence of dysregulation in the TG synthesis and adipogenesis as noted in our previous work [32].
The fundamental biochemical abnormality in hypoxic cells is cell injury with reduced intracellular generation of ATP [44]. As described above, loss of ATP leads to the failure of many energy-dependent cellular systems. Semenza (2007) [45] described that hypoxia induces the expression of HIF-1α which results in the inhibition of the electron transport chain and ATP production, limit the overproduction of reactive oxygen species during hypoxia and slows the rate of oxygen depletion. The coordinated regulation of metabolic demand and supply is required to maintain metabolic adaptation and cellular homeostasis during hypoxia [18]. Coherently in the present work, we observed the ATP level deprivation in fish adipocytes under pollutants induced hypoxic condition.
Fish may adopt acute hypoxic stress by changes in behavior, physical and morphological nature, whereas in chronic hypoxic condition fish adapt at molecular level. The major molecular level stress adaptation includes the activation of the HIF1α [46,33] which is correlated to the present study. It was confirmed by the variation in the expression of HIF1α in fish adipocytes from pollutants induced hypoxic condition. It also emphasized that HIF1α protein is a candidate biomarker for determining exposure of fish to hypoxic events [22].
Induction of HIF1α markedly enhances the level of HO-1 [47]. During hypoxia mediated oxidative stress, cellular heme is released and contributes to the growing “free heme pool.” Free heme is a potent pro-oxidant and increases ROS levels [48]. Elevated levels of heme are toxic and catalyze oxidative damage to cells, tissues, and organs. Hence the role of HO-1 is vital which acts as the crucial enzyme catalyzing the heme degradation. Khitan and his colleagues [48] stated that the protective effect of HO-1 is ascribed to its role in decreasing the cellular heme content as they are highly toxic and leading to the generation of ROS and RNS. Similarly, in the present study increased HO-1 expression was observed in test adipocytes suggesting that HNE acts as a potent inducer of HO-1 to provide cytoprotective function which was similar to the study reported by Iles and his colleagues [49]. Terry and his colleagues [50] reported that TNFα induces HO-1 to render protection against oxidant stress, which is similar to our previous study where we observed increased TNFα [32]. TNFα is also known to regulate G3PDH and its mediated lipogenesis process [51]. Coherently we have observed diminished G3PDH level in fish adipocytes under pollutants induced hypoxic condition. From the result, it is confirmed that HO-1 is responsible for the regulation of adipocyte function by decreasing endogenous ROS, for the maintenance of metabolic reprogramming process in fish adipocytes.
In addition to oxidative stress markers, the major drug metabolizing enzyme- antioxidant CYP1A2 was assessed in the present study to demonstrate its effect in adipocytes during pollutants induced hypoxia. Fradette and Souich [52] have reported the reduction in the expression of CYP1A2 in hypoxia induced animal models. Both HIF1α and CYP1A2 are biomarkers of environmental exposure to hypoxia and xenobiotics, act through the same aryl hydrocarbon receptor [21]. Similarly, present work observed the decreased expression of CYP1A2 in test fish adipocytes compared to control fish adipocytes depicting the role of environmental pollutants in causing O2 deprivation which in turn results in diminished CYP1A2, but enhanced HIF1α. Morel and Barouki [53] have reported that ROS were shown to down-regulate CYP1A mRNA level in rat hepatocytes which is concomitant to our data. Reed and his colleagues (2011) [25] suggested that induction of HO-1 leads to the diminished level of CYP1A2 as they were sharing the same redox partner NADPH CYP 450 reductase for electrons to insert an oxygen atom into a substrate molecule. Diminished CYP1A2 may also be due to HIF1α dimerization with ARNT as CYP1A2 requires the activation and the association of AHR-ARNT complex [27]. Hence it is suggesting that elevation of HIF1α and HO-1 is crucial for regulating the adaptive mechanism rather than CYP1A2.
Current study clearly emphasized the effect of stress induced signaling protein changes in energy balance adapted by fish adipocytes during pollutants induced hypoxia. The primary key finding of this study includes the adaptive mechanism rendered by HIF1α in HO-1 induction and its subsequent effect on metabolic reprogramming. Decreased CYP1A2 in test fish adipocytes hints that adipocytes acts as a prime depot for toxic compounds due to the lipophilic nature of the toxic elements, thereby limiting the systemic toxicity by decreasing the availability of toxic chemicals to other cells. Hence the present study concludes that the differential expression of signaling and its associated metabolic reprogramming may serve as an adaptive mechanism for the cells to survive during environmental hypoxic condition.
References
- Padmini E,Parimala P, Tharani J (2016a) Differential regulation of pro and anti apoptotic proteins in fish adipocytes during hypoxic conditions. Fish physiology and Biochemistry 42: 919-934.
- Feder ME, Hofmann (1999) Heat-shock proteins, molecular chaperones, and the stress response: evolutionary and ecological physiology. Ann RePhysiol 61: 243-282.
- Padmini E, Meenakshi N, Parimala P (2015) HIF1α regulates survival proteins in fish brain under pollutants induced hypoxic condition. JPR9: 491-499.
- Ferrandiz ML, Devesa I (2008) Inducers of heme oxygenase-1.Curr Pharm Des 14: 473-86.
- Wegiel B, Nemeth Z, Matheus CC, Bulmer AC, Otterbein LE (2014) Heme Oxygenase-1: A Metabolic Nike. Antioxand Redox Signal p:11.
- Li SY, Fu ZJ, Lo ACY (2012) Hypoxia-Induced Oxidative Stress in Ischemic Retinopathy. Oxidative Medicine and Cellular Longevityp: 1-10.
- Chen ZH, Niki E (2006) 4-Hydroxynonenal (4-HNE) has been Widely Accepted as an Inducer of Oxidative Stress. Is this the Whole Truth about it or can 4-HNE also exert Protective Effects?. IUBMB Life 58: 372-373.
- Lucchi L, Banni S, Melis MP, Angioni E, Carta G, et al. (2000) Changes in conjugated linoleic acid and its metabolites in patients with chronic renal failure. Kidney Intern 58:1695-1702.
- Uchida Y, Ohba K, Yoshioka T, Irie K, Muraki T, et al. (2004) Cellular Carbonyl Stress Enhances the Expression of Plasminogen Activator Inhibitor-1 in Rat White Adipocytes via Reactive Oxygen Species-dependent Pathway.J BiolChem 279: 4075-4083.
- Demozay D, Mas JC, Obberghen RS (2008) FALDH Reverses the Deleterious Action of Oxidative Stress Induced by Lipid Peroxidation Product 4-Hydroxynonenal on Insulin Signaling in 3T3-L1 Adipocytes. Diabetes 57: 1216-1226.
- Ghiselli A, Serafini M, Natella F, Scaccini C (2000) Total antioxidant capacity as a tool to assess redox status: critical view and experimental data. Free Radical Biol and Med 29: 1106-1114.
- Singh R, Beriault R, Middaugh J, Hamel R, Chenier D, et al. (2005) Aluminum-tolerant Pseudomonas fluorescens: ROS toxicity and enhanced NADPH production. Extremophiles 9: 367-373.
- Patsouris D, Mandard S, Voshol PJ, Escher P, Tan NS, et al. (2004) PPARalpha governs glycerol metabolism. JClin Invest 11:94-103.
- Kabakov AE, Budagova KR, Latchman D, Kampinga HH (2002) Stressful preconditioning and HSP70 overexpression attenuate proteotoxicity of cellular ATP depletion. American J of Physiolology and Cell Physiol283: 521-534.
- Peck R (1996) Biochemistry, a foundation. Brooks/Cole. Pacific Grove CA.
- Cleveland HP (1997) Integrated principles of zoology(10thedn.) William C. Brown/McGraw Hill Book: New York.
- Rich PR (2003) The molecular machinery of Keilin's respiratory chain. Biochem Society Transactions 31: 1095-1105.
- Wheaton WW, Chandel NS (2011) Hypoxia. 2. Hypoxia regulates cellular metabolism. Am J Physiol Cell Physiol300: 385-393.
- Wang R, Jin F, Zhong H (2014) A novel experimental hypoxia chamber for cell culture. American J of Cancer Research 4: 53-60.
- Miyata T, Takizawa S, van Ypersele de Strihou C (2011) Hypoxia. 1. Intracellular sensors for oxygen and oxidative stress: novel therapeutic targets. Am J Physiol Cell Physiol300: C226-31.
- Rahman S, Thomas P (2012) Effects of Hypoxia Exposure on Hepatic Cytochrome P450 1A (CYP1A) Expression in Atlantic Croaker:Molecular Mechanisms of CYP1A Down-Regulation. PLoS ONE 7: 40825.
- Xiao H, Gu Z, Wang G, Zhao T (2013) The Possible Mechanisms Underlying the Impairment of HIF-1α Pathway Signaling in Hyperglycemia and the Beneficial Effects of Certain Therapies. Intern J of Medical Sci10: 1412-1421.
- Bento CF, Pereira P (2011) Regulation of hypoxia-inducible factor 1 and the loss of the cellular response to hypoxia in diabetes. Diabetologia 54: 1946-1956.
- Zanger UM, Klein K (2013)Pharmacogenetics of cytochrome P450 2B6 (CYP2B6): advances on polymorphisms, mechanisms, and clinical relevance.Front Genetics 4: 24.
- Reed JR, Cawley GF, Backes WL (2011) Inhibition of Cytochrome P450 1A2-Mediated Metabolism and Production of Reactive Oxygen Species by Heme Oxygenase-1in Rat Liver Microsomes. Drug Metabolism Letter 5: 6-16.
- Sanjay J, Emin M, Min ML, Celeste S, Christopher AB (1998) Gene expression pattern- Expression of ARNT, ARNT2, HIF1a, HIF2a and Ah receptor mRNAs in the developing mouse. Mechanisms of Dev73: 117-123.
- Minghua N, Alan LB, John PG (2001) Interactions between aryl hydrocarbon receptor (AhR) and hypoxia signaling pathways. EnvironToxicol and Pharmacol10: 17-27.
- Padmini E, Tharani J (2015) Differential expression of HO-1 and CYP1A2 during up-regulation of ERK in stressed fish hepatocytes.Environ Monitoring and Assessment 187: 41-47.
- Padmini E, VijayaGeetha B (2007a) A comparative seasonal pollution assessment study on estuary with respect to metal accumulation in Mugilcephalus. Oceanological and Hydrobiological Studies. 35: 1-13.
- Padmini E, VijayaGeetha B (2007b) Seasonal influences on water quality parameters and pollution status of the Ennore estuary, Tamilnadu. Indian J Environ Hydrology 15: 1-9.
- Padmini E, Parimala P (2014) Cytoprotective role of hemeoxygenase-1 in polluted estuarine Mugilcephalus. IAJLB 2: 32-46.
- Padmini E, Parimala P (2015) Role of HSP70 and the associated signaling molecules in fish adipocytes during pollutants induced hypoxia. IOSR Journal of Environmental Science, Toxicology and Food Technol 9: 16-26.
- Padmini E, Meenakshi N, Parimala P (2016b) Differential expression of survival proteins during hypoxic insult on brain endothelial cells of grey mullets. Marine Pollution Bulletin.
- Rodbell M (1964) Metabolism of isolated adipocytes. I. Effects of hormones on glucose metabolism and lipolysis. Biological chem239: 375-380.
- Bouraoui L, Gutierrez J,Navarro I (2008) Regulation of proliferation and differentiation of adipocyte precursor cells in rainbow trout (Oncorhynchusmykiss). J of Endocrinol198: 459-469.
- Strober W (2001) Trypan blue exclusion test of cell viability. CurrProtocImmunol, May, Appendix 3, Appendix 3B 18432654 (P, S, E, B, D).
- Bradford M (1976) A rapid and sensitive method for the quantitation of microgram quantities of protein utilizing the principle of protein–dye binding. Analytical Biochem 72: 248-254.
- RecknagelRO, Glende EA (1984)Spectrophotometric detection of lipid conjugateddienes. Methods Enzymol105: 331-337.
- Prieto P, Pineda M, Aguilar M (1999) Spectrophotometric quantitation of antioxidant capacity through the formation of phosphomolybdenum complex, Specific application to the determination of vitamin E. Annual Biochem 26: 337-341.
- Sottile V, Seuwen K (2001) A high-capacity screen for adipogenic differentiation. Analytical Biochem 293:124-128.
- Anderson FS, Murphy RC (1976) Isocratic separation of some purine nucleotide, nucleoside and metabolites from biological extract by high-performance liquid chromatography. J Chromatogr121: 251-262.
- Zhang X, Wang Z, Li J, Gu D, Li S, et al. (2013) Increased 4-Hydroxynonenal Formation Contributes to Obesity-Related Lipolytic Activation in Adipocytes. Plos one 8: 70663.
- Sledzinskia T, Korczynskaa J, Goykeb E, Stefaniakc T, Markuszewskac MP, et al. (2013) Association Between Cytosolic Glycerol 3-Phosphate Dehydrogenase Gene Expression in Human Subcutaneous Adipose Tissue and BMI. Cell PhysiolBiochem32: 300-309.
- Kumar V, Abbas AK, Fausto N, Richard M (2007) Robbins Basic Pathology, (8thedn.) Health Sci p: 960.
- SemenzaGL (2007) Oxygen-dependent regulation of mitochondrial respiration by hypoxia-inducible factor. Biochemistry J 405: 1-9.
- Regazzetti C, Peraldi P, Grémeaux T, Lendom RN, Sahra IB, et al. (2009) Hypoxia Decreases Insulin Signaling Pathways in Adipocytes. Diabetes 58: 95-103.
- Lee PJ, Jiang BH, Chin BY, Iyer NV, Alam J, et al. (1997) Hypoxia-inducible factor-1 mediates transcriptional activation of the heme oxygenase-1 gene in response to hypoxia. J of Biological Chem28: 272.
- Khitan Z, Harsh M, Sodhi K, Shapiro JH, Abraham NG (2014) HO-1 Upregulation Attenuates Adipocyte Dysfunction, Obesity, and Isoprostane Levels in Mice Fed High Fructose Diets. Nutrition and Metabolismpp: 1-13.
- Iles KE, Dickinson DA, Wigley AF, Welty NE, Blank V, et al. (2005) HNE increases HO-1 through activation of the ERK pathway in pulmonary epithelial cells. Free RadicBiol Med 39: 355-364.
- Terry CM, Clikeman JA, Hoidal JR, Callahan KS (1999) TNF-alpha and IL-1alpha induce heme oxygenase-1 via protein kinase C, Ca2+, and phospholipase A2 in endothelial cells. American J of Physiology 276: 1493-501.
- Nayan GP, Holder JC, Smith SA, Kumar S, Eggo MC (2003) Differential Regulation of Lipogenesis and Leptin Production by Independent Signaling Pathways and Rosiglitazone During Human Adipocyte Differentiation. Diabetes. 52: 43-50.
- Fradette C, Souich DP (2004) Effect of hypoxia on cytochrome P450 activity and expression. Curr Drug Metab5: 25771.
- Morel Y, Barouki R (1998) Down-regulation of Cytochrome P450 1A1 Gene Promoter by Oxidative Stress: critical contribution of nuclear factor 1. BiolChemJ 73: 26969-26976.
Relevant Topics
- Algal Blooms
- Blue Carbon Sequestration
- Brackish Water
- Catfish
- Coral Bleaching
- Coral Reefs
- Deep Sea Fish
- Deep Sea Mining
- Ichthyoplankton
- Mangrove Ecosystem
- Marine Engineering
- Marine Fisheries
- Marine Mammal Research
- Marine Microbiome Analysis
- Marine Pollution
- Marine Reptiles
- Marine Science
- Ocean Currents
- Photoendosymbiosis
- Reef Biology
- Sea Food
- Sea Grass
- Sea Transportation
- Seaweed
Recommended Journals
Article Tools
Article Usage
- Total views: 3705
- [From(publication date):
June-2017 - Mar 31, 2025] - Breakdown by view type
- HTML page views : 2874
- PDF downloads : 831

