Research Article Open Access
Heavy Metals Contaminants in Water and Fish from Four Different Sources in Sudan
Salwa MEK1*, Sara AM1, Samia HA1, Abdalla EB2, Manal YI3, Samia AH1 and Hala EA1
1Department of Biochemistry, Nutrition, Toxicology and Pharmacology, Central Veterinary Research Laboratory, Sudan
2Faculty of Pharmacy, Algaseem University, Saudi Arabia
3Department of Pathology, Central Veterinary Research Laboratory, Sudan
- *Corresponding Author:
- Salwa MEK
Department of Biochemistry
Nutrition, Toxicology and Pharmacology
Central Veterinary Research Laboratory, Sudan
Tel: 916742300134
E-mail: salwamuhamed@hotmail.com
Received date: February 25, 2016; Accepted date: April 01, 2016; Published date: April 06, 2016
Citation: Salwa MEK, Sara AM, Samia HA, Abdalla EB, Manal YI, et al. (2016) Heavy Metals Contaminants in Water and Fish from Four Different Sources in Sudan. J Infect Dis Ther 4:275. doi:10.4172/2332-0877.1000275
Copyright: © 2016 Salwa MEK, et al. This is an open-access article distributed under the terms of the Creative Commons Attribution License, which permits unrestricted use, distribution, and reproduction in any medium, provided the original author and source are credited.
Visit for more related articles at Journal of Infectious Diseases & Therapy
Abstract
Fish and water resources that promoted as natural sources that free of contaminant, were selected from three states (Khartoum, Nahr elnile and Sinnar). Water and Fish samples were assayed for Lead, Cadmium, Mercury, Arsenic, Zink and Copper. Fish samples showed low levels of Zinc, Cadmium and Copper compared to the standard acceptable levels, while lead showed a significant high level compared to the standard acceptable level. Zinc and copper levels in water samples were significantly lower than the standard acceptable levels, while cadmium level was higher at Gabal awalia dam area (Khartoum state). Mercury and arsenic showed high and low levels respectively compared to standard levels. All water samples recorded significant high level of lead compared to the standard acceptable level.
Keywords
Mercury; Zinc; Lead; Water; Fish; Cadmium; Arsenic; Copper
Introduction
Minerals present in food can be essential, nonessential or toxic to human consumption. Minerals such as iron, copper, zinc and manganese are essential and play important roles in biological systems. Meanwhile, mercury, lead and cadmium are toxic, even in trace amounts. However, essential minerals can also produce toxic effects at high concentrations [1]. Marine foods are very rich sources of various mineral components. The total content of minerals in raw flesh of marine fish and invertebrates is in the range of 0.6-1.5% of wet weight [2]. However, variation in mineral composition of marine foods can occur due to seasonal and biological differences (species, size, dark/ white muscle, age, sex and sexual maturity), area of catch, processing method, food source and environmental conditions (water chemistry, salinity, temperature and contaminant) [3-5].
The elemental anomaly in the groundwater regime once created through natural processes or by unintended or unethical human intervention, often goes unabated. The toxicity of an element depends on the dose, the chemical form, route of exposure, bio–availability, and distribution in the body, and storage and excretion parameters. In recent years, considerable interest has been focused on assessing the human health risk posed by metals, metalloids, and trace elements in the environment. It has long been recognized that large areas of the globe contain human populations characterized by having trace element deficiency, or excess including chronic poisoning [6-8].
Heavy metals are among the most persistent of pollutants in the aquatic ecosystem because of their resistance to decomposition in natural conditions [9]. High concentrations of these metals can be released into the aquatic environment as a result of leaching from bedrocks, atmospheric deposition, water drainage, runoff from riverbanks, and discharge of urban and industrial wastewaters [10,11].
Consumption of fish provides an important nutrient to a large number of people worldwide and thus makes a very significant contribution to nutrition. Fish is a highly proteinous food, consumed by a large percentage of the populace because of its availability and palatability [12].
Considering the nutritional benefits associated with fish consumption and the attendant risk associated with eating fish, it has therefore become important that the proximate and mineral composition of fish be assessed in order to ensure they meet the requirements of food regularities and commercial specifications [13] and also establish the safety level of fish.
Materials and Methods
The preparation of samples for mineral elements analysis followed a method described in Official Methods of Analysis of the Association of Official Analytical Chemists [14]. Approximately 5 g of sample was weighed into acid-washed crucible and dried in oven 105°C for one day. Dried samples were then digested in furnace oven at 550°C overnight. The ash was digested in 5ml of 65% nitric acid (HNO3) by boiling for about two minutes and cooling to room temperature. The cooled solution was filtered through Whatman filter paper (No. 41) and made up to 25 ml with 65% nitric acid [14]. Ten ml were transferred into 15 ml polypropylene test tube for injection into Phoenix 986 atomic absorber (Phoenix- UK).
The water samples were collected in one liter polythene bottles and duly treated with 6N HNO3 at the site itself. Atomic absorption Spectrophotometer was used to find – out the concentration of the trace element in the collected water samples.
Data Analysis
Data were analyzed using SPSS (Scientific Package of Social Science) version 17.0. The mean, standard deviation (SD), and one-way ANOVA test
Results and Discussion
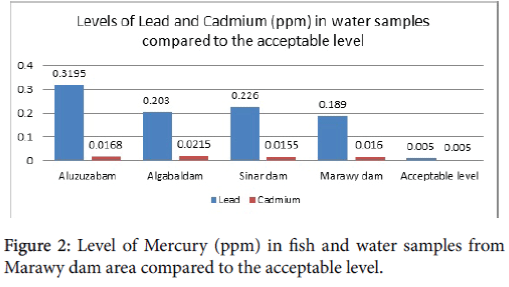
The level of lead (Pb), in different samples obtained from different regions, was remarkably high compared to the acceptable level, Aluzuzab area showed the highest concentration (0.32 ppm), in return the highest concentration of lead in fish samples was detected in Aluzuzab dam area, but the concentration was below the acceptable level (2 ppm).
This result agrees with (Haram, 2015), who reported high concentration of lead in water samples obtained from Algabal dam area, the detected concentration was 0.14 ppm, also this result goes with what was reported by (Seddeket, 1996), and (Marouf, 2006), they recorded levels ranged from 0.42-0.74 ppm.
The high levels of lead could be attributed to the presence of industrial and agricultural discharges, direct sewage bonds discharge.
Cadmium (Cd), level in all samples (water and fish), brought from different regions was not significantly different at (p<0.05), all levels exceeded the acceptable level of (Cd) in water (0.005 ppm) in regard to fish samples all detected concentrations were below the acceptable level (1.0 ppm) (Figure 1).
Though the result obtained in the current study was below the results reported by Haram. 2015, but still exceeds the permissible limits.
Cadmium in fish samples was below the results recorded by Egbal, (2010), who reported that, cadmium concentration in water and fish samples was 0.353-0.326 ppm and 0.348-0.018 ppm respectively.
Cadmium is used in Nickel-Cadmium, rechargeable batteries and for planting, also used for some paints, plastic and ceramic industry [15] which is all found in Khartoum city industrial areas, and drainage into the White Nile, through sewage bonds.
Zinc (Zn), concentration in water samples obtained from Algabal dam and Marawy dam area, was significantly (p<0.05) high compared to those obtained from Sinar dam area, generally the different levels were below the acceptable level (5 ppm), this could be justified by the effect of water Ph, on Zinc mobilization, acidic Ph, lower the concentration of Zinc (Spreger, 1987, and Driscoll, 1987), so the industrial waste could be of acidic Ph, and surface water was altered to become acidic because of those wastes, and as a result the concentration of Zinc was lowered.
Fish samples in some areas, showed concentrations of Zinc, higher than that already exist in their aquatic surround, this goes with the observation, observed that the level of zinc found in their bodies did not directly relate to the exposure concentrations. A recent study shows that bioaccumulation of zinc in fish is inversely related to the aqueous exposure. This evidence suggests that fish placed in environments with lower zinc concentrations can sequester zinc in their bodies.
Water content of Copper (Cu), was analyzed in samples which brought from Algabal dam, Sinar dam and Marawy dam area, there was no significant different levels noticed between the three regions, all detected levels were below the acceptable ones (1.0 ppm and 30 ppm, for water and fish, respectively) (Tables 1 and 2).
| Area | Lead (Pb ppm) | Cadmium (Cd ppm) | Zinc (Zn ppm) | Copper (Cu ppm) |
|---|---|---|---|---|
| Aluzuzabam | 0.3195 ± 0.0128 | 0.0168 ± 2.733 | ---------------* | --------------* |
| Algabaldam | 0.2030 ± 0.0128 | 0.0215 ± 2.733 | 0.0945 ± 7.72 | 0.1745 ± 0.0454 |
| Sinar dam | 0.2260 ± 0.0128 | 0.0155 ± 2.733 | 0.0161 ± 7.72 | 0.1285 ± 0.0454 |
| Marawy dam | 0.1890 ± 0.0128 | 0.0160 ± 2.733 | 0.0950 ± 7.72 | 0.1175 ± 0.0454 |
| Acceptable level | 0.005 [16] | 0.005 [16] | 5.0 [16] | 1 [16] |
Data are means± standard error, means in the same column followed by the same letter are not significant at (p<0.05).
* = Not measured in this area.
Table 1: The levels of trace elements in water samples.
| Area | Lead (Pb ppm) | Cadmium (Cd ppm) | Zinc (Zn ppm) | Copper (Cu ppm) |
|---|---|---|---|---|
| Aluzuzab | 0.3660±0.0126 | 0.0160±0.0408 | --------* | -------* |
| Algabaldam | 0.2547±0.0126 | 0.0805±0.0408 | 0.1128±3.92 | 0.1321±3.99 |
| Sinar dam | ----------* | --------* | --------* | -------* |
| Marawy dam | 0.2268±0.0126 | 0.0425±0.0408 | 0.1180±3.92 | 0.1403±3.99 |
| Acceptable level | 2 [15] | 1.0 [15] | 100 [15] | 30 [15] |
Data are means ± standard error, means in the same column followed by the same letter are not significant at (p<0.05).
* = Not measured in this area.
Table 2: The levels of trace elements in fish samples.
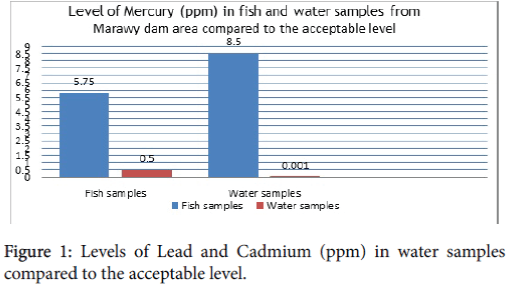
The Arsenic (As), and Mercury (Hg), levels were measured in samples (water and fish), obtained from Marawy dam area, in regard to Arsenic, the detected concentrations were below the acceptable levels (0.025 ppm, and 2 ppm), for water and fish respectively. Mercury levels in both, water and fish samples from Marawy dam area, were remarkably high, compared to the acceptable levels (0.001 ppm and 0.5 ppm), for water and fish, respectively (Table 3).
| Element (ppm) | Fish samples | Acceptable level (ppm) | Water samples | Acceptable level (ppm) |
|---|---|---|---|---|
| Arsenic (As) | 0.0180±1.86 | 2.0 (EPA, 2001) | 0.0193±1.86 | 0.025 (EPA, 2001) |
| Mercury (Hg) | 5.75±1.41 | 0.5 (EPA, 2001) | 8.50±1.41 | 0.001 (EPA, 2001) |
Data are means ± standard error, means in the same row followed by the same letter are not significant at (p<0.05).
Table 3:The level of Arsenic and Mercury in water and fish samples from Marawy dam area.
This high concentration of mercury could be due to the intensive use of it in gold mining process in that area (Figure 2).
Conclusion
The results present new information on different levels of these metals in the four regions and their concentration were so far within the standard acceptable level except for lead, cadmium and mercury. Water and fish from these four regions are considered as a public health hazard.
Recommendations
Quick response should be taken by the authorities of these four regions to treat the polluted water.
Fish and water from these four regions are highly contaminated and should be restricted from being used in any activity affects human health, restricted actions should be taken to stop contamination, by making a revision of the drainage systems of factories located in those regions, and treatment of waste should be revised at the first place. Also mining activity should be organized and regulated.
References
- Sivaperumal P, Sankar TV, Viswanathan Nair PG (2007) Heavy metal concentrations in fish, shellfish and fish products from internal markets of India vis-à-vis international standards. Food Chemistry 102: 612-620.
- Sikorski ZE (1990) In: Resources Nutritional Composition and Preservation. Boca Raton, Florida. CRC Press-Inc pp 30-52.
- Rodrigo J, Ros G, Priago J, Lopez C, Ortuno J (1998) Proximate and mineral composition of dried salted roes of hake (Merlucciusmerluccius L.) and ling (Molvamolva L.). Food Chemistry 63: 221-225.
- Alasalvar C, Taylor KDA, Zubcov E, Shahidi F, Alexis M (2002) Differentiation of cultured and wild sea bass (Dicentrarchuslabrax): total lipid content, fatty acid and trace mineral composition. Food Chemistry 79: 145-150.
- Turhan S, Ustun SN, Altunkaynak B (2004) Effect of cooking methods on total and heme iron contents of anchovy (Engraulisencrasicholus). Food Chemistry 88: 69-172.
- Bunnell JE, Finkelman RB, Centeno JA, Selinu O (2007) Medical Geology: A globally Emerging Discipline,” GeologicaActa, 5: 273-281.
- Finkelman RB (2007) Health Impacts of Coal: Facts and Fallacies. Ambio 36: 103-106.
- Selinus O, Frank D (2000) Environmental Medicine.
- Arnason JG, Fletcher BA (2003) A 40+Year Record of Cd, Hg, Pb, and U Deposition in Sediments of Patroon Reservoir, Albany Country, NY, USA, Environmental Pollution 123: 383-391.
- Soares HMVM, Boaventura RAR, Machado AASC, Esteves da Silva JCG (1999) Sediments as Monitors of Heavy Metal Contamination in the Ave River Basin (Portugal): Multivariate Analysis of Data. Environmental Pollution 105: 311-323.
- Yang H, Rose N (2005) Trace Element Pollution Records in Some UK Lake Sediments, Their History, Influence Factors and Regional Differences. Environment International 31: 63-75.
- Foran JA, Carpenter DO, Hamilton MC, Knuth BA and Schwager SJ (2005) Risk-based consumption advice for formed Atlantic and wild Pacific salmon contaminated with dioxins and dioxin-like componds. Environmental Health Perspective 33: 552-556.
- Watermann JJ (2000) In: Composition and Quality of Fish. Torry Research Station, Edinburg pp 110-113.
- AOAC (1990) In: Helrich K, Official Methods of Analysis of the Association of Official Analytical Chemists (15th edition). Section 969.33.Airlington: Association of Official Analytical Chemists.
- World Health Organization (1989) Heavy metals environmental aspects. Environment Health Criteria. No. 85. Geneva, Switzerland.
- Environmental Protection Agency (2001) Parameters of water quality interpretation and standards.
Relevant Topics
- Advanced Therapies
- Chicken Pox
- Ciprofloxacin
- Colon Infection
- Conjunctivitis
- Herpes Virus
- HIV and AIDS Research
- Human Papilloma Virus
- Infection
- Infection in Blood
- Infections Prevention
- Infectious Diseases in Children
- Influenza
- Liver Diseases
- Respiratory Tract Infections
- T Cell Lymphomatic Virus
- Treatment for Infectious Diseases
- Viral Encephalitis
- Yeast Infection
Recommended Journals
Article Tools
Article Usage
- Total views: 13834
- [From(publication date):
April-2016 - Nov 21, 2024] - Breakdown by view type
- HTML page views : 12826
- PDF downloads : 1008


