Have Global Temperatures Reached a Tipping Point?
Received: 09-Feb-2018 / Accepted Date: 25-Feb-2018 / Published Date: 04-Mar-2018 DOI: 10.4172/2573-458X.1000149
Keywords: Global warming; CSARGW; Temperatures; Mid-ocean; CO2 concentrations
Introduction
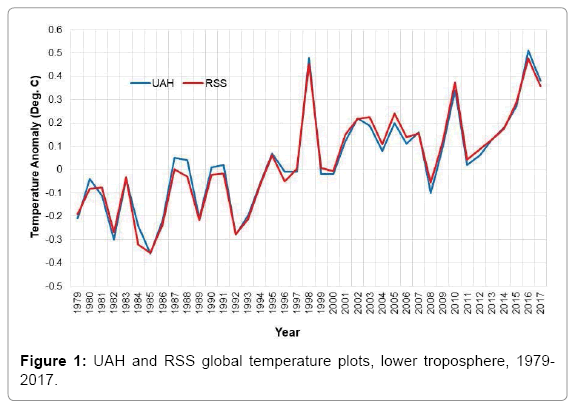
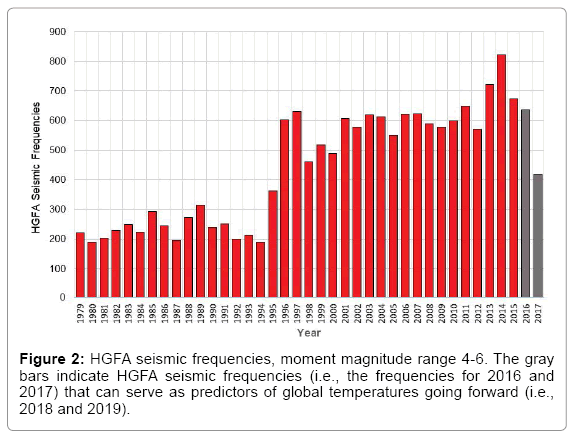
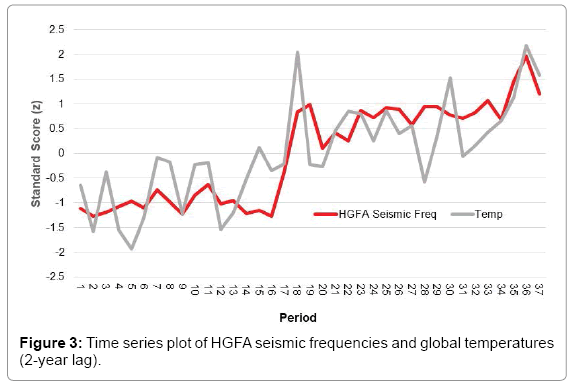
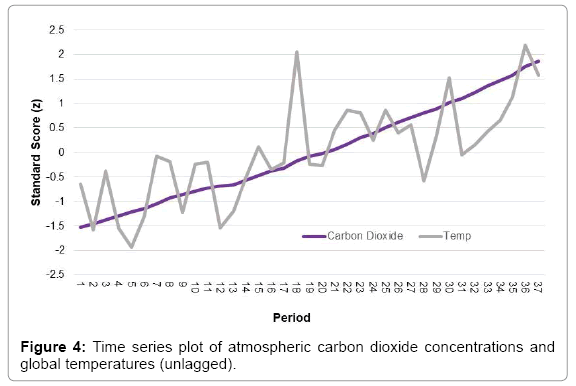
Two previous studies, The Correlation of Seismic Activity and Recent Global Warming (CSARGW) and the Correlation of Seismic Activity and Recent Global Warming: 2016 Update (CSARGW16), documented a high correlation between mid-ocean seismic activity and global temperatures from 1979 to 2016 [1,2]. As detailed in those studies, increasing seismic activity in these submarine volcanic complexes is a proxy indicator of heightened underwater geothermal flux, a forcing mechanism that destabilizes the overlying water column. This forcing accelerates the thermohaline circulation while enhancing thermobaric convection [3-6]. This, in turn, results in increased heat transport into the Arctic (i.e., the “Arctic Amplification”), a prominent feature of earth’s recent warming [7-9]. Employing the same methodology outlined in CSARGW and CSARGW16, this study extends the analysis through 2017. As such, the lower troposphere temperature anomalies (global) from the University of Alabama-Huntsville (UAH) and Remote Sensing Systems (RSS) are employed. These datasets are then averaged, and the resulting means define the global temperature anomalies (hereby referred to as “temperatures”) from 1979 to the present [10]. The time series for the UAH and RSS datasets can be seen in Figure 1. It follows that the seismic frequencies for these high geothermal flux areas (HGFA) serve as the independent variable in the analysis. Specifically, this includes the 4 to 6 moment-magnitude events from the Mid-Atlantic Ridge, the ridge complexes of the Indian and Southern Oceans, the East Pacific Rise, the submarine triple junction areas, the Carlsberg Ridge, the Reykjanes Ridge, and the West Chile Rise (Figure 2) [11]. These frequencies are then correlated with the mean global temperatures (Figure 3). It is important to note that a two-year lag is factored into the analysis: The 1979 HGFA seismic frequency is paired with the 1981 global temperature, the 1980 HGFA frequency is paired with the 1982 temperature, and so forth, for the entire series. The resulting correlation between the HGFA frequencies and the lagged global temperatures is 0.777, a statistically significant outcome that explains 60.3% of the variance in global temperatures. By contrast, an unlagged pairing of CO2 concentrations (ppm) with global temperatures yields a (lower) correlation of 0.735 (Figure 4) [12]. More importantly, multiple regression analysis reveals that mid-ocean seismicity is a significant predictor of global temperatures (p<0.05) but CO2 is not (p>0.05) (Table 1). A striking development for this experiment is that 2017 marks the first three-year decline in HGFA seismic activity since 1979 (Figure 2). Furthermore, the 2017 HGFA seismic count is 49% lower than the study period’s peak frequency in 2014, the year of the last “Super El Niño”. When viewed within the context of the entire time series, the 2017 drop-off mirrors the jump in HGFA seismic activity experienced in 1995, albeit in the opposite direction. The 1995 “tipping point” was significant as global temperatures spiked in lockstep two years later, followed by a 21-year “plateau” in both global temperatures and HGFA seismicity, a.k.a. “The Pause”. It is reasonable to conclude that this recent “gapping down” may be a tipping point towards cooler global temperatures. Using HGFA seismic frequencies as the sole predictor of global temperatures going forward, there is a 95% probability that global temperatures in 2019 will decline by 0.47°C ± 0.21°C from their 2016 peak. In other words, there is a 95% probability that 2019 temperatures will drop to levels not seen since the mid-1990s. As with any prediction, there are innumerable confounding factors that can impact the accuracy of this prognosis, including surges of sub-aerial volcanic activity, sudden changes in solar output, changes in cloud cover/height/opacity, and data representativeness problems, to name but a few. Despite these pitfalls, this type of exercise provides fresh opportunities to learn more about the role of mid-ocean geothermal inputs to the climate system. This new knowledge could prove valuable towards solving the climate puzzle, one of the most intriguing and complex projects the geosciences have ever undertaken.
| Multiple Regression Analysis | |||||
|---|---|---|---|---|---|
| Multiple R | 0.781 | ||||
| R Square | 0.610 | ||||
| Adjusted R Square | 0.587 | ||||
| Coefficients | St Error | t Stat | P-value | Significant | |
| Intercept | -0.97578 | 0.8657 | -1.127 | 0.268 | ---- |
| HGFA Seismic Freq. | 0.00064 | 0.0003 | 2.454 | 0.019 | Yes |
| CO2 | 0.00199 | 0.0026 | 0.761 | 0.452 | No |
Table 1: Parameters of multiple regression analysis employing HGFA seismic frequencies and CO2 concentrations as predictors for satellite-derived global temperatures.
References
- Viterito A (2016) The correlation of seismic activity and recent global warming. J Earth Sci Clim Change 7: 345.
- Viterito A (2017) The correlation of seismic activity and recent global warming: 2016 Update. Environ Pollut Climate Change 1: 103.
- Ballarotta M, Roquet F, Falahat S, Zhang Q, Madec G (2015) Impact of the oceanic geothermal heat flux on a glacial ocean state. Clim Past Discuss 11: 3597-3624.
- Scott JR, Martozke J, Adcroft A (2001) Geothermal heating and its influence on the meridional overturning circulation. J Geophys Res 106: 31141-31154.
- Mullarney JC, Griffiths RW, Hughes GO (2006) The effects of geothermal heating on the ocean overturning circulation. Geophysical Research Letters 33: L02607.
- Urakawa LS, Hasumi H (2009) A remote effect of geothermal heat on the global thermohaline circulation. J Geophys Res 114: C07016.
- Chylek P, Folland CK, Lesins G, Manvendra KD, Wang M (2009) Arctic air temperature change amplification and the Atlantic multidecadal oscillation. Geophysical Research Letters 36: L14801.
- Serreze M, Barry RG (2011) Processes and impacts of Arctic amplification: A research synthesis. Glob Planetary Change 77: 85-96.
- Screen JA, Simmonds I (2010) The central role of diminishing sea ice in recent Arctic temperature amplification. Nature 464: 1334-1337.
- Microwave sounding unit temperature anomalies (2018) National oceanic and atmospheric administration.
- Incorporated research institutions for seismology (2018) Wilber 3 event selector.
- Earth system research laboratory (2018) Full mauna loa CO2 record, National oceanic and atmospheric administration.
Citation: Viterito A (2018) Have Global Temperatures Reached a Tipping Point? Environ Pollut Climate Change 2: 149. DOI: 10.4172/2573-458X.1000149
Copyright: © 2018 Viterito A. This is an open-access article distributed under the terms of the Creative Commons Attribution License, which permits unrestricted use, distribution, and reproduction in any medium, provided the original author and source are credited.
Share This Article
Recommended Journals
Open Access Journals
Article Tools
Article Usage
- Total views: 6195
- [From(publication date): 0-2018 - Mar 31, 2025]
- Breakdown by view type
- HTML page views: 5353
- PDF downloads: 842


